. 2023 Jun 8;14(1):3378.
doi: 10.1038/s41467-023-39042-y.

B cell profiles, antibody repertoire and reactivity reveal dysregulated responses with autoimmune features in melanoma

Affiliations

B cell profiles, antibody repertoire and reactivity reveal dysregulated responses with autoimmune features in melanoma

Silvia Crescioli et al. Nat Commun. .

Abstract

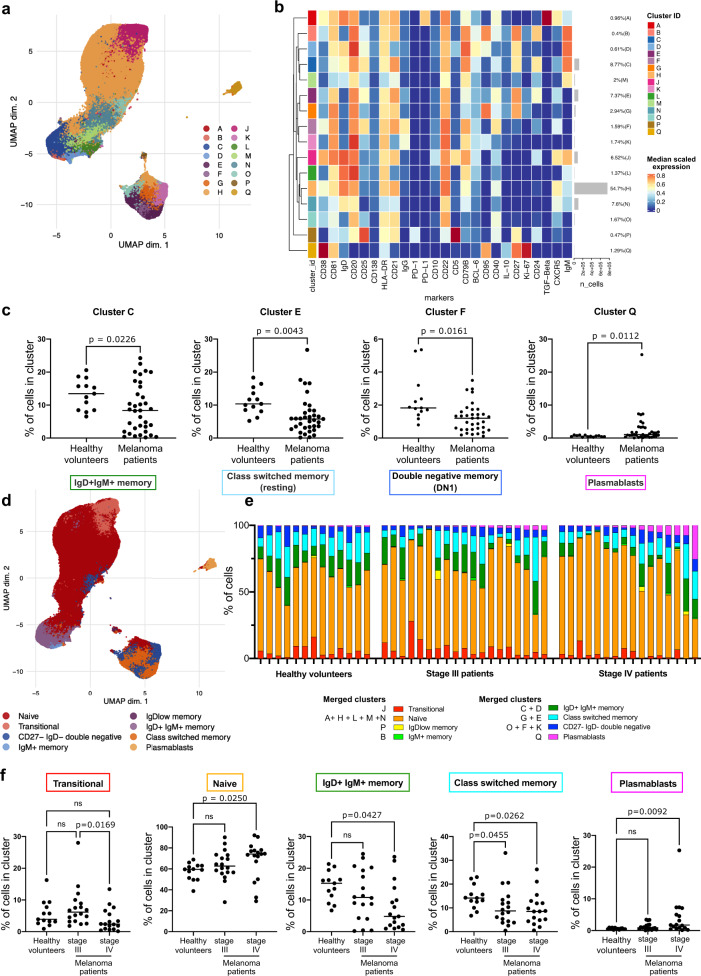
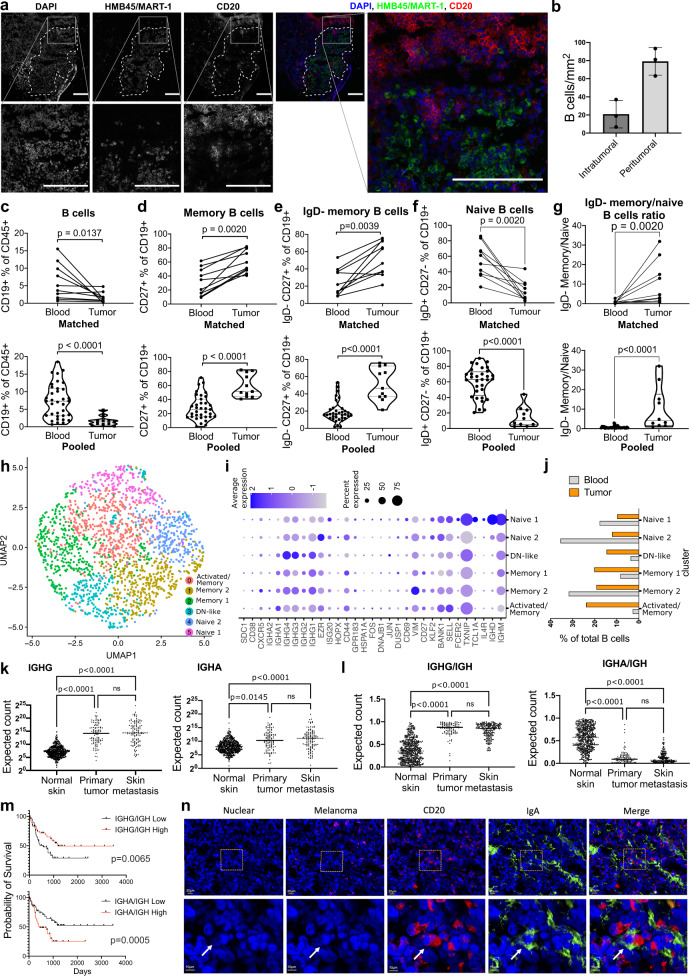
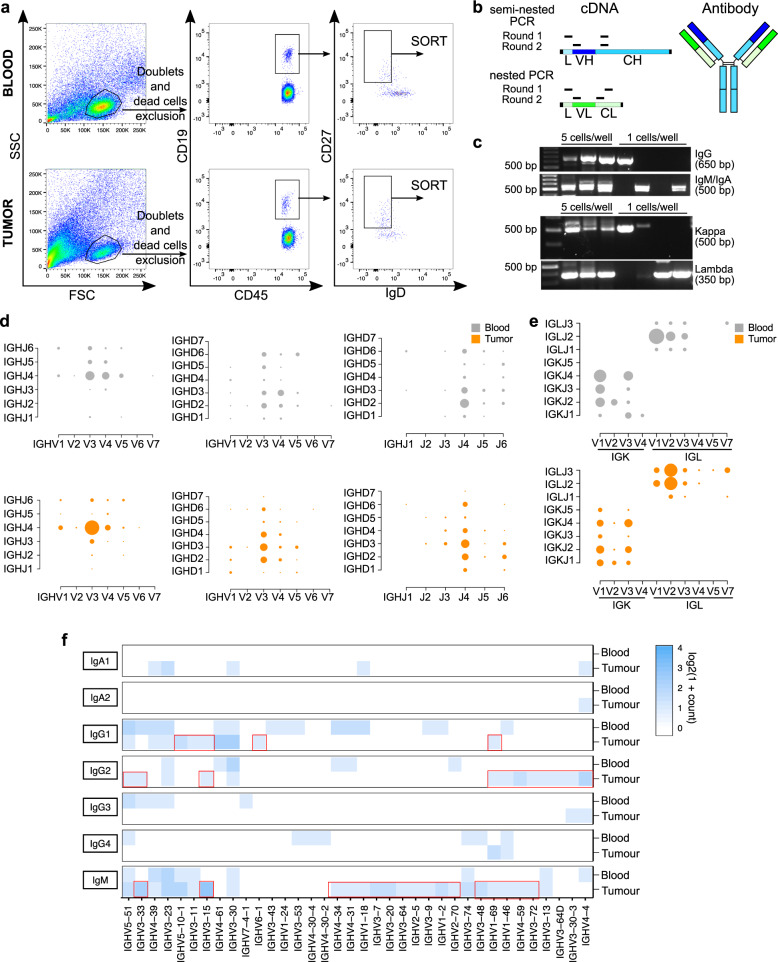
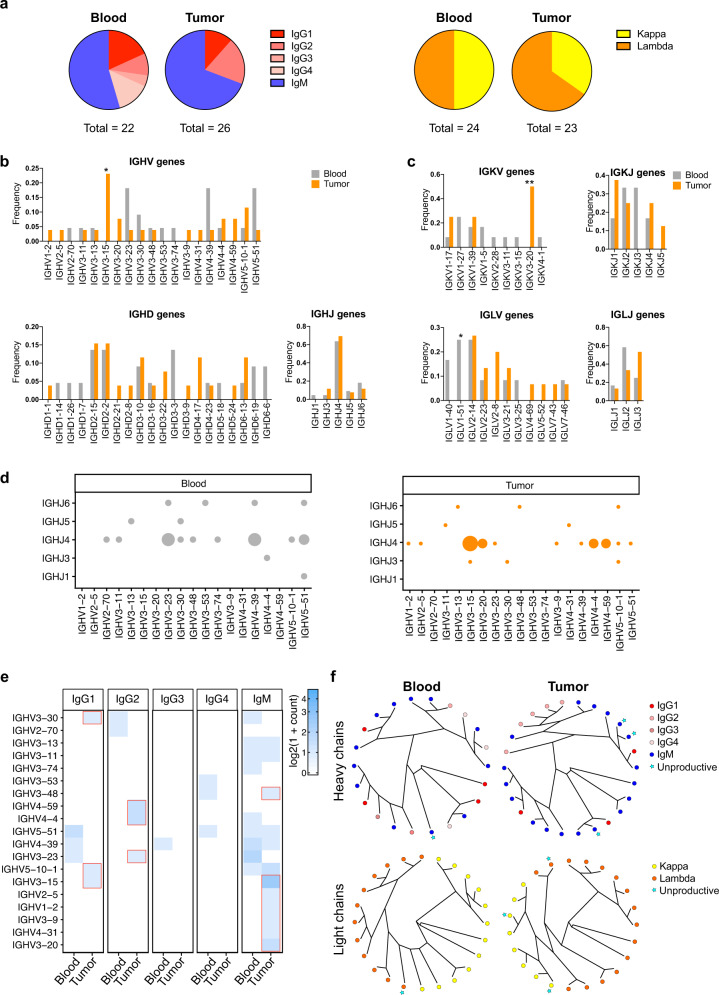
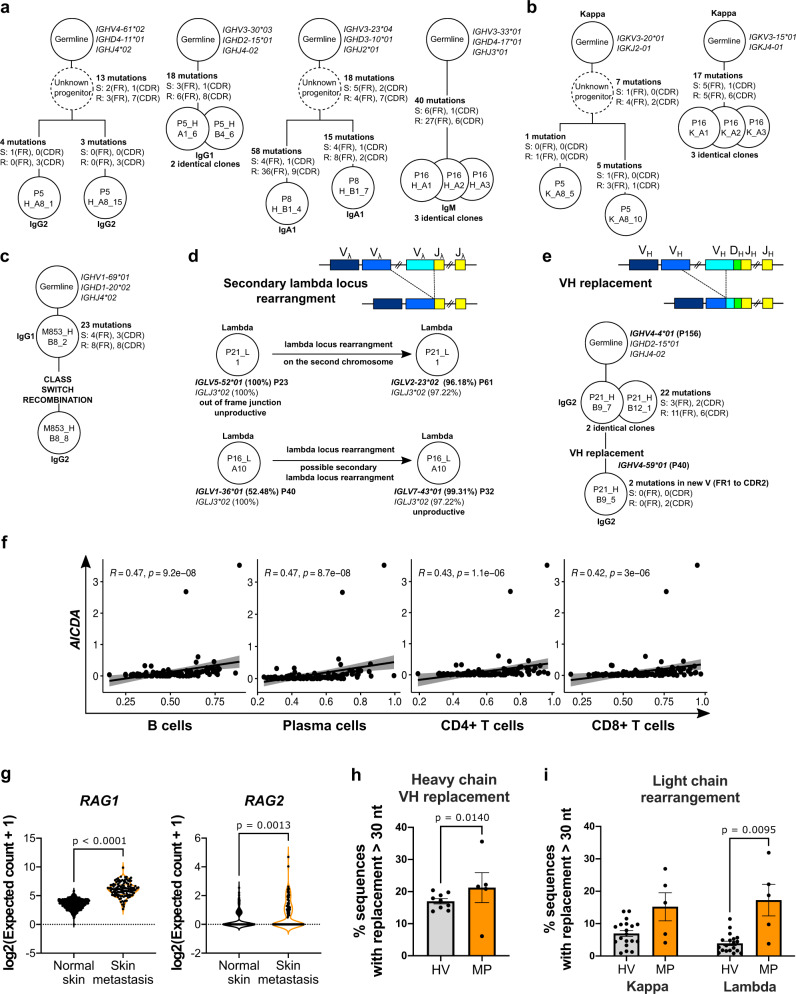
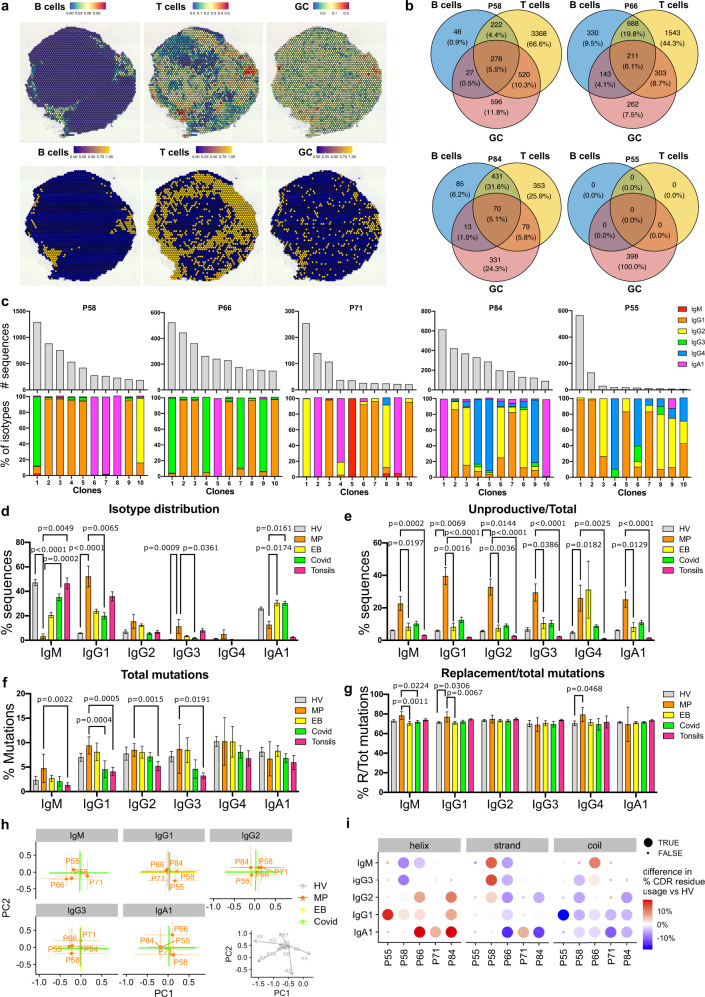
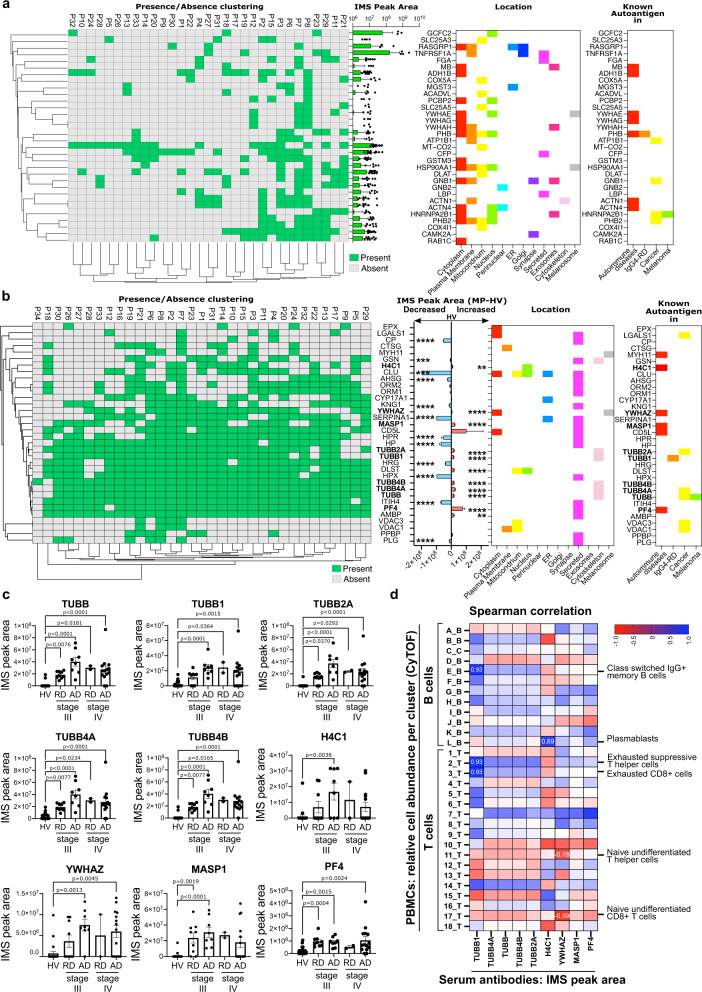
B cells are known to contribute to the anti-tumor immune response, especially in immunogenic tumors such as melanoma, yet humoral immunity has not been characterized in these cancers to detail. Here we show comprehensive phenotyping in samples of circulating and tumor-resident B cells as well as serum antibodies in melanoma patients. Memory B cells are enriched in tumors compared to blood in paired samples and feature distinct antibody repertoires, linked to specific isotypes. Tumor-associated B cells undergo clonal expansion, class switch recombination, somatic hypermutation and receptor revision. Compared with blood, tumor-associated B cells produce antibodies with proportionally higher levels of unproductive sequences and distinct complementarity determining region 3 properties. The observed features are signs of affinity maturation and polyreactivity and suggest an active and aberrant autoimmune-like reaction in the tumor microenvironment. Consistent with this, tumor-derived antibodies are polyreactive and characterized by autoantigen recognition. Serum antibodies show reactivity to antigens attributed to autoimmune diseases and cancer, and their levels are higher in patients with active disease compared to post-resection state. Our findings thus reveal B cell lineage dysregulation with distinct antibody repertoire and specificity, alongside clonally-expanded tumor-infiltrating B cells with autoimmune-like features, shaping the humoral immune response in melanoma.


Conflict of interest statement

S.N.K. and J.S. are founders and shareholders of Epsilogen Ltd. H.J.B. is employed through a fund provided by Epsilogen Ltd. S.N.K., J.S., and H.J.B. are inventors of patents on antibody technologies. All other authors have declared no conflict of interest.

Figures

Fig. 1
Fig. 1. Altered proportion of memory B cell subsets and higher proportion of plasmablasts in melanoma patient compared to healthy volunteer blood.
Evaluation of B cell subsets by CyTOF analyses (25 markers) (Biologically independent samples: Healthy volunteers, n = 13; Melanoma patients, n = 35). a UMAP plot for the B cell dataset showing the clusters generated using FlowSOM algorithm. b Heatmap representing the median scaled expression of the 25 markers used for B cell clustering. c Comparison of the relative abundance of differentially expressed B cell clusters in Healthy volunteers and Melanoma patients. d UMAP plot of the 16 clusters shown in b merged into 8 B cell populations. e Bar chart representing proportions of merged populations per sample. f Relative abundance of the 8 B cell populations in Healthy volunteers and Melanoma patients (divided per stage). Scatter plots representing mean and individual % of cells in cluster values. Statistical significance was calculated with two sided Welch’s test and nonparametric ANOVA; P < 0.05 are reported on the graphs. Source data are provided as a Source data file.
Fig. 2
Fig. 2. Memory B cells are enriched in the melanoma tumor microenvironment compared with peripheral blood.
a Immunofluorescence images on melanoma tissue depicting cancer cells (HMB45/MART-1), and B cells (CD20): single colors (DAPI, HMB45/MART-1, CD20) and merged channels (DAPI, blue; HMB45/MART-1, green; CD20, red). Dotted line indicates tumor margins. Scale bar: 200 µm. b Intratumoral and peritumoral B cells per mm2 (biologically independent samples, n = 3). cg Evaluation of B cells in patient blood compared with tumor samples by flow cytometry. Top panel: matched blood and tumor (n = 12); Bottom panel: pooled samples (blood, n = 45; tumor, n = 13). c B cells (CD19+ % of CD45+ lymphocytes). d Memory B cells (CD27+) % of B cells. e IgD- Memory B cells (IgD-CD27+) % of B cells. f IgG+ CD27- naive B cells. g IgD- memory/naive B cell ratio. hj Single cell RNAseq analysis of matched blood and tumor. h UMAP visualization of B lymphocyte populations. i Expression of the cluster gene markers in each population. j Bar chart representing the relative abundance of each B cell cluster in blood and tumor samples. k IGHG (sum of IGHG1, IGHG2, IGHG3, IGHG4) and IGHA (sum of IGHA1, IGHA2) gene expression, and l IGHG/IGH and IGHA/IGH ratio (where IGH is the sum of IGHD, IGHM, IGHG, IGHA) in normal skin (n = 555), primary melanoma lesions (n = 102) and melanoma skin metastases (n = 116) (RSEM expected count (DESeq2 standardized) dataset, TCGA TARGET GTEx study, UCSC Xena). m Overall survival analysis for IGHG/IGH and IGHA/IGH ratio high (≥50 percentile) and low (<50 percentile). n Immunofluorescence images on melanoma tissue depicting cancer cells (HMB45/MART-1), B cells (CD20) and IgA: single colors, from left to right: DAPI, blue; HMB45/MART-1, pink; CD20, red; IgA, green; merged image (right). Statistical significance was calculated with two-sided Wilcoxon test (top panel) and Mann–Whitney test (bottom panel) (cg), nonparametric ANOVA (k, l), Log rank (Mantel–Cox) (m); Error bars SEM of biologically independent samples, n = 3. (Biologically independent samples: Healthy volunteers, n = 13; Melanoma patients, n = 35; P < 0.05 are reported on the graphs. Source data are provided as a Source data file.
Fig. 3
Fig. 3. Antibody repertoires of IgD- memory B cells from melanoma patient blood and tumors.
a Multicolor flow cytometry gating strategy for sorted IgD-CD27 + B cells from melanoma patients’ blood (top panel) and tumor (bottom panel). b Schematic showing the portions of the Ig sequences isolated: annealing position of the primers used for the semi-nested and nested PCR on the Ig heavy and light chain cDNA (Left panel) and corresponding sequences on a representative antibody structure (Right panel). c Agarose gel electrophoresis of the second round of PCR products for antibody heavy and light chains (Top panel: IgG or IgM/IgA; Bottom panel: kappa or lambda). d, e Bubble plots representing d the distribution of heavy chain IGHV-IGHJ, IGHV-IGHD and IGHD-IGHJ and e light chain IGKV-IGKJ and IGLV-IGLJ gene combinations, in melanoma patient’s blood and tumor samples. f Heatmap representing IGHV gene distribution grouped by isotype, in patient blood and tumor; tumor-specific IGHV-isotype combinations are highlighted in red. Source data are provided as a Source data file.
Fig. 4
Fig. 4. Antibody repertoire in patient’s matched blood and tumor.
a Pie charts representing the isotype distribution of the heavy and light chain sequences isolated from blood and tumor of a patient with melanoma. b Frequency distribution of heavy chain IGHV, IGHD and IGHJ genes in blood and tumor. c Frequency distribution of kappa light chain IGKV and IGKJ genes and lambda light chain IGLV and IGLJ genes in blood and tumor. d Bubble plot representing the distribution of heavy chain IGHV-IGHJ gene pairing in melanoma patient blood and tumor. e Heatmap representing IGHV gene distribution grouped by isotype, in blood and tumor; tumor-specific IGHV-isotype combinations are highlighted in red. f Unrooted circular trees showing variable domain clustering according to sequence variability in blood and tumor heavy and light chain sequences annotated with information regarding the isotype or indicated if unproductive. Error bars represent bootstrapped 95% confidence intervals; statistical significance was calculated with a two-sample proportion z-test (bd); P < 0.05 are reported on the graphs. * = P < 0.05, ** = P < 0.01. Source data are provided as a Source data file.
Fig. 5
Fig. 5. Tumor-associated B cells show evidence of in situ SHM, CSR and receptor revision.
a, b Genealogical trees displaying examples of in situ SHM and clonal expansion in heavy (a) and light (b) chain of tissue resident B cell clones. c Genealogical tree displaying an example of in situ CSR. d Schematic representing secondary lambda locus rearrangement and examples of in situ lambda locus rearrangement. e Schematic representing VH replacement and genealogical tree representing an example of in situ VH replacement. d, e Germline genes are annotated with the relative position (P) in the locus. ae Trees are annotated with mutations and isotype; mutations are annotated according to the following: Silent (S), Replacement (R), in Framework (FR), in CDR (CDR). fi Long-read sequence analyses from bulk RNA extracted from tumor tissue. f Spearman correlation of AICDA gene expression with B cell, plasma cell, CD4 + T cell and CD8 + T cell signatures in melanoma skin metastases (TCGA dataset, n = 116) dataset. g RAG1, RAG2 gene expression in normal skin (n = 555) and melanoma skin metastases (n = 116) (RSEM expected count (DESeq2 standardized) dataset, TCGA TARGET GTEx study, UCSC Xena). h VH replacement frequency in healthy volunteer blood (HV, n = 9 biologically independent samples) and melanoma patient tumor (MP, n = 5) derived from long-read sequence analyses. i Light chain rearrangement frequency in healthy volunteer blood (HV, n = 19 biologically independent samples) and melanoma patient tumors (MP, n = 5 biologically independent samples). The number of sequences in the high throughput repertoires analyzed in h and i are reported in Supplementary Tables 2 and  3. g Truncated violin plots: median (dashed black line), quartile (thin line). h, i Bar charts, error bars represent SEM. Statistical significance was calculated with the Kolmogorov–Smirnov test; P < 0.05 are reported on the graphs. Source data are provided as a Source data file.
Fig. 6
Fig. 6. Spatial transcriptomic coupled with high throughput intratumoral antibody repertoire analyses suggest an active but aberrant B cell response.
a Representative image of spatial transcriptomic deconvolution of B cells, T cells and B cell germinal center (GC) signatures. Top panels, signature score per spot; bottom panels, binarized values using 50% (B cells and T cells) and 85% (GC) threshold. b Venn diagrams representing the number of spots with B cells, T cells or GC signatures and their combinations. c Bar chart representing the absolute number of sequences (top panels) and the proportion of isotypes in the top 10 clones (bottom panels) showing CSR, per tumor. dg Bar charts representing: d isotype distribution; e % of unproductive sequences; and f % of total mutations, and g % of replacement/total mutations in the V region of unique sequences from melanoma patients’ tumor (MP, n = 5) compared to healthy volunteers’ blood (HV, n = 9), ebola patient (EB, n = 12), SARS-CoV-2 patient (COVID-19, n = 16) and healthy tonsils (Tonsils, n = 8) repertoires. Statistical significance was calculated with non-parametric ANOVA compared to MP. Error bars SEM of biologically independent samples. h Principal component analysis (PCA) of heavy chain CDR3 characteristics in terms of Kidera factors. Dots depict median PC1/2 and colored lines depict inter-quartile range. i Comparison of the proportion of α-helical, β-strand and coil amino acid structures in the CDR3 sequences of the MP compared to HV repertoire data. P < 0.05 are reported on the graphs. Source data are provided as a Source data file.
Fig. 7
Fig. 7. Patient-derived antibody production and antigen discovery.
a Schematic explaining patient-derived antibody heavy and light chain cloning and production of recombinant human IgG1. b Coomassie SDS-PAGE of monoclonal antibodies bearing patient-derived variable region sequences in reducing and non-reducing conditions, annotated with kappa/lambda information. c Schematic of immuno-mass spectrometry experimental procedure and analysis pipeline for antigen discovery. Left panel: pull down of normal skin protein lysate or human melanoma protein lysate using patient-derived IgG1, anti-CSPG4 IgG1 (positive control) and anti-NIP IgG1 (negative control), followed by trypsin digestion and Shotgun Mass Spectrometry LC-MS/MS; Right panel: Shotgun Mass-Spectrometry LC-MS/MS output filtering criteria to select potential antigen peptides of interest to be confirmed by Parallel Reaction Monitored Mass Spectrometry (PRM-MS). d Summary of the immuno-mass spectrometry (blue boxes show the number of peptides pulled down by the antibodies from melanoma tissue protein lysate; red outlines represent an antibody reaction with a specific protein from normal skin protein lysate as well) and glycan array (yellow boxes show antibody reaction with specific glycans) screening results for antigen discovery with patient-derived antibodies. Source data are provided as a Source data file.
Fig. 8
Fig. 8. Immuno-mass spectrometry of serum immunoglobulins reveal altered autoantibody levels and reactivities in melanoma patients compared with healthy volunteers.
ac Biologically independent samples: melanoma patient (n = 33) and healthy volunteer (n = 23). d Biologically independent samples: melanoma patient (n = 7). a, b Serum immuno-mass spectrometry results representing proteins pulled down by antibodies from each serum sample. From left to right: clustered presence/absence heatmap flanked by a bar chart with a corresponding immuno-mass spectrometry (IMS) Peak Area depicting antigens pulled down by melanoma patient sera autoantibodies or b increase or decrease of IMS peak area in MP (n = 33) compared to HV (n = 23); antigen cellular or extracellular location; for known autoantigens: information on the disease setting. Proteins pulled down by a melanoma patients’ serum antibodies only, or by b both melanoma patients’ and healthy volunteers’ serum antibodies. In bold are the proteins of interest. c Analyses of IMS peak areas for proteins of interest (i.e., increased compared to healthy volunteers) representing the presence of autoantibodies in the serum samples (HV, healthy volunteers; patients with melanoma with stage III and stage IV disease (RD, resected disease; AD, active disease)). d Spearman correlation matrix of PBMC populations (relative cell abundance in B cell and T cell clusters analyzed by CyTOF) and serum autoantibodies (IMS Peak Area of the proteins in c of matched blood samples. Significant correlations (P < 0.05 and −0.5 <r < 0.5) are indicated by the presence of the r value on the heatmap box and by the description of the cell cluster. Statistical analyses were performed using non-parametric ANOVA (c) and Spearman correlation (d); error bars represent SEM of biologically independent samples. P < 0.05 are reported on the graphs. ** = P < 0.01, *** = P < 0.001, **** = P < 0.0001. Source data are provided as a Source data file.

Similar articles

Cited by

References

    1. Borst J, Ahrends T, Babala N, Melief CJM, Kastenmuller W. CD4(+) T cell help in cancer immunology and immunotherapy. Nat. Rev. Immunol. 2018;18:635–647. doi: 10.1038/s41577-018-0044-0. - DOI - PubMed
    1. Wei SC, et al. Distinct cellular mechanisms underlie anti-CTLA-4 and anti-PD-1 checkpoint blockade. Cell. 2017;170:1120.e7–1133.e7. doi: 10.1016/j.cell.2017.07.024. - DOI - PMC - PubMed
    1. Fridman WH, Zitvogel L, Sautes-Fridman C, Kroemer G. The immune contexture in cancer prognosis and treatment. Nat. Rev. Clin. Oncol. 2017;14:717–734. doi: 10.1038/nrclinonc.2017.101. - DOI - PubMed
    1. Cabrita R, et al. Tertiary lymphoid structures improve immunotherapy and survival in melanoma. Nature. 2020;577:561–565. doi: 10.1038/s41586-019-1914-8. - DOI - PubMed
    1. Griss J, et al. B cells sustain inflammation and predict response to immune checkpoint blockade in human melanoma. Nat. Commun. 2019;10:1–14. doi: 10.1038/s41467-019-12160-2. - DOI - PMC - PubMed

Publication types