. 2023 Jul;20(7):1070-1081.
doi: 10.1038/s41592-023-01896-x. Epub 2023 Jun 8.

Hardwiring tissue-specific AAV transduction in mice through engineered receptor expression

Affiliations

Hardwiring tissue-specific AAV transduction in mice through engineered receptor expression

James Zengel et al. Nat Methods. 2023 Jul.

Abstract

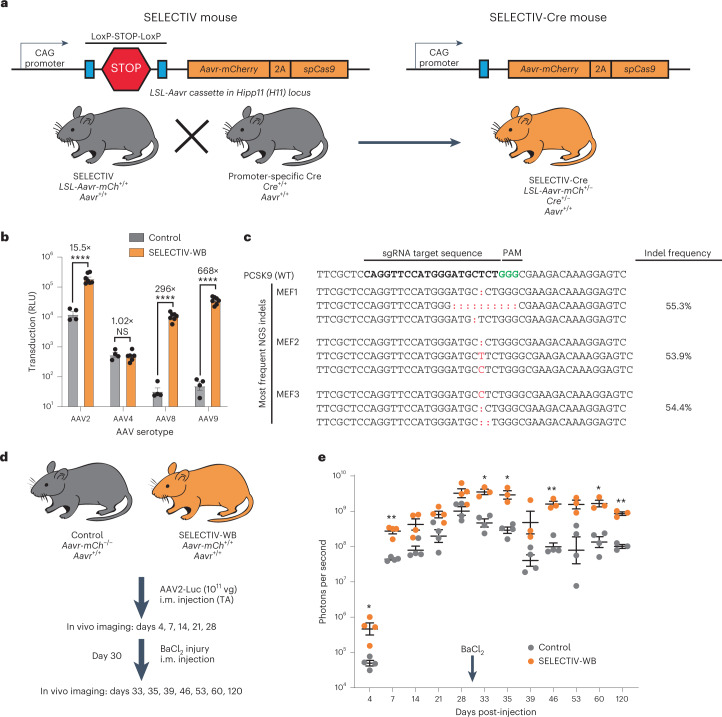
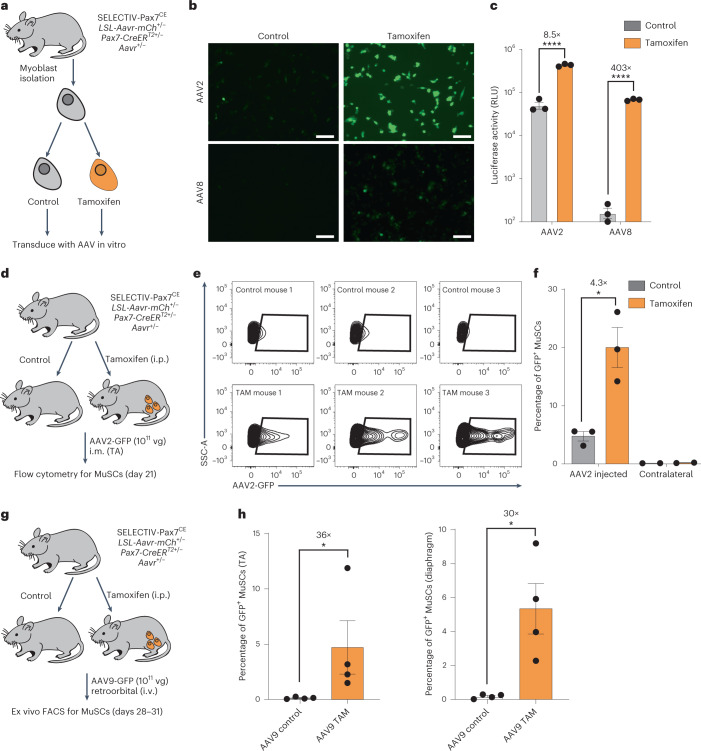
The development of transgenic mouse models that express genes of interest in specific cell types has transformed our understanding of basic biology and disease. However, generating these models is time- and resource-intensive. Here we describe a model system, SELective Expression and Controlled Transduction In Vivo (SELECTIV), that enables efficient and specific expression of transgenes by coupling adeno-associated virus (AAV) vectors with Cre-inducible overexpression of the multi-serotype AAV receptor, AAVR. We demonstrate that transgenic AAVR overexpression greatly increases the efficiency of transduction of many diverse cell types, including muscle stem cells, which are normally refractory to AAV transduction. Superior specificity is achieved by combining Cre-mediated AAVR overexpression with whole-body knockout of endogenous Aavr, which is demonstrated in heart cardiomyocytes, liver hepatocytes and cholinergic neurons. The enhanced efficacy and exquisite specificity of SELECTIV has broad utility in development of new mouse model systems and expands the use of AAV for gene delivery in vivo.


Conflict of interest statement

J.E.C., S.P. and A.S.P. are inventors on a patent filed by Stanford University regarding the use of AAVR to enhance and regulate AAV transduction. The other authors declare no competing interests.

Figures

Fig. 1
Fig. 1. Production and characterization of a platform for in vivo overexpression of AAVR in mice.
a, Construction of SELECTIV mice that allow Cre-mediated overexpression of the mouse AAV receptor (Aavr). The construct contains the CAG promoter followed by the loxP-STOP-loxP sequence, a strong transcription stop sequence that can be removed by Cre recombination. It encodes the mouse Aavr fused to mCherry and spCas9 after an F2A self-cleaving peptide sequence. This cassette was inserted into the C57BL/6 mouse genome using targeted integration in the H11 locus. SELECTIV mice can be crossed with mice expressing Cre recombinase under specific promoters to produce mice with cell-type- or tissue-specific overexpression of Aavr. b, Transduction of MEFs overexpressing AAVR. MEFs were generated from embryos from a SELECTIV-WB and WT mouse breeding (individual derived MEFS, control n = 4; SELECTIV-WB n = 6 for AAV2, AAV8 and AAV9, and n = 5 for AAV4). MEFs were transduced with AAV2-, AAV4-, AAV8- and AAV9-luciferase. Transduction was assessed by luciferase activity 48 h later. Mean value and s.e.m. are shown. Fold-changes are indicated, and the P value was calculated using a two-way analysis of variance (ANOVA) with Holm–Šídák’s multiple comparisons test, where ****P < 0.0001; NS, not significant (AAV2 P = 1.6 × 10−12, AAV4 P = 0.65, AAV8 P < 1 × 10−15, AAV9 P < 1 × 10−15). c, CRISPR genome editing using AAV-encoded sgRNA and endogenous spCas9 in SELECTIV-WB MEFs. MEFs were transduced at an MOI = 50,000 vg per cell with AAV9 encoding an sgRNA targeting PCSK9 under a U6 promoter and a GFP reporter. GFP-positive cells were sorted and isolated and indels were detected by deep sequencing. d, Schematic of study to test in vivo transduction in control and SELECTIV-WB mice after intramuscular (i.m.) injection of AAV2-luc (1011 vg) into the tibialis anterior (TA) muscle. e, In vivo transduction was measured over time (control n = 4 mice days 4–60 and n = 3 mice day 120, SELECTIV-WB n = 4 mice days 4–28 and n = 3 mice days 33–120) in mice injected (i.m.) with AAV2-luciferase by in vivo imaging and quantification. Mean value and s.e.m. are shown. The P value was calculated using a two-way ANOVA by fitting a mixed model with two-tailed Holm–Šídák’s multiple comparisons test, where *P < 0.05 and **P < 0.01 (day 4 P = 0.034, day 7 P = 0.0090, day 14 P = 0.057, day 21 P = 0.11, day 28 P = 0.11, day 33 P = 0.014, day 35 P = 0.017, day 39 P = 0.11, day 46 P = 0.0035, day 53 P = 0.11, day 60 P = 0.017, day 120 P = 0.0035). NGS, next-generation sequencing; RLU, relative luciferase units. Source data
Fig. 2
Fig. 2. Targeting of MuSCs in vitro and in vivo with inducible AAVR overexpression increased AAV transduction.
a, SELECTIV-Pax7CE mice were generated, which allow for overexpression of AAVR in Pax7+ cells (MuSCs and myoblasts) after tamoxifen treatment. These cells were transduced with AAV in vitro to assess the role of AAVR overexpression in these cells. b, SELECTIV-Pax7CE myoblasts with or without tamoxifen treatment were transduced with AAV2- or AAV8-GFP and imaged at 48 h post-transduction. Scale bars, 100 µm. c, Similarly treated cells were transduced with AAV2- or AAV8-luciferase (n = 3 wells) and luciferase activity was assessed at 48 h post-transduction. Mean value and s.e.m. are shown. The P value was calculated using a two-way ANOVA with Holm–Šídák’s multiple comparisons test, with ****P < 0.0001 (AAV2 P = 1.6 × 10−5, AAV8 P = 1.1 × 10−8). d, In vivo transduction of MuSCs by AAV2-GFP was assessed in SELECTIV-Pax7CE mice with or without tamoxifen treatment. e, Cells were isolated from the full TA muscle of the injected leg or the uninjected contralateral leg and the percentage of the transduced MuSCs was determined by FACS for GFP-positive cells in the CD11b/CD45/Sca1/CD31/a7-integrin+/CD34+ population, and the percentage of GFP-positive MuSCs was quantified for each mouse. f, The percentage of transduced cells in the MuSC population was calculated for each group for the injected leg and the contralateral leg. Mean value and s.e.m. are shown (n = 3 mice, n = 2 contralateral). The P value was calculated using an unpaired t-test (two-tailed), with *P < 0.05 (AAV2 injected P = 0.013). g, In vivo transduction of MuSCs by AAV9-GFP after systemic (intravenous (i.v.)) delivery was assessed in SELECTIV-Pax7CE mice with or without tamoxifen treatment. h, MuSCs were isolated from the TA muscle or the diaphragm, and the numbers of GFP+ cells were assessed by flow cytometry. Mean value and s.e.m. are shown (n = 4 mice). The P value was calculated using a two-tailed Mann–Whitney test, with *P < 0.05. The comparisons gave P = 0.0286 for the TA and P = 0.0286 for the diaphragm. i.p., intraperitoneal. Source data
Fig. 3
Fig. 3. AAVR overexpression changed the transduction profile in the eye towards the photoreceptor layer upon i.v. injection.
a, Control and SELECTIV-WB mice were injected intravitreally with AAV2-GFP (n = 5 mice per group, male and female, 6–7 months of age). Retinal transduction was tracked over time using fundus autofluorescence imaging and ex vivo by fluorescent microscopy of retinal wholemounts. b, Representative fundus photographs show GFP expression in retinas of live mice 3 weeks after AAV2-GFP intravitreal injection. c, Representative confocal images of retinal wholemounts (RGC layer facing upwards) of SELECTIV-WB and control mice. d, High-magnification view of wholemounts taken by confocal Z-stacks; 500 µm from optic nerve head; white dotted squares in c; RGCs are labeled with RBPMS in purple. e, Quantification of GFP-positive cells in each layer from the control and SELECTIV-WB groups. Scale bars, 500 µm (c) and 50 µm (d). For quantification, n = 5, 6 retinas (3 images per retina; 2 samples in RGC SELECTIV-WB group had 2 images per retina). Mean value and s.e.m. are shown. The P value was calculated using an unpaired t-test (two-tailed), with ****P < 0.0001, **P < 0.01 (RGC P = 3.7 × 10−6, INL P = 0.38, photoreceptor P = 0.0032). Source data
Fig. 4
Fig. 4. The SELECTIV-KO platform allows for efficient transduction of a tissue of interest with near complete reduction of transduction of nontarget tissue after systemic delivery of AAV.
a, SELECTIV-KO mice were bred with Myh6-Cre mice on an AavrKO background to generate mice with AAVR overexpression in the heart and lung while lacking endogenous Aavr expression (SELECTIV-KO-Myh6). Littermate controls heterozygous (control) or homozygous for the endogenous Aavr-KO allele (AAVR-KO) were also produced during breeding. b, Control (n = 6 mice), SELECTIV-KO-Myh6 (n = 8 mice) and AAVR-KO (n = 6 mice) mice (n = 4, 6, 2 mice, respectively, for muscle) were injected with 3 × 1010 vg AAV9-luciferase by systemic (i.v.) injection (both male and female, 6–8 weeks of age). At 21 d after injection, mice were euthanized and luciferase activity was determined in indicated organ lysates to determine AAV transduction efficiency. Mean value and s.e.m. are shown. The horizontal dashed line indicates background luminescence in nontransduced controls. Fold-changes are indicated, and the P value was calculated using an ordinary one-way ANOVA with a Holm–Šídák’s multiple comparisons post-test, with ****P < 0.0001, ***P < 0.001, **P < 0.01 and *P < 0.05 (control versus SELECTIV-KO-Myh6: liver P = 9.0 × 10−6, heart P = 7.9 × 10−5, lung P = 0.00051, muscle P = 1.0 × 10−5; SELECTIV-KO-Myh6 versus AAVR-KO: liver P = 0.16, heart P = 4.3 × 10−11, lung P = 8.9 × 10−7, muscle P = 0.11). c, Control and SELECTIVKO-Myh6 (heart-specific) mice were injected with 2 × 1011 vg PHP.eB-GFP by systemic (i.v.) injection. Mice were euthanized at 28 d post-transduction and transduction was determined in liver and heart by fluorescence microscopy. Scale bars, 200 µm. Similar results were seen in three biological replicates. d, Mice with varying levels of AAVR (control, AAVR-KO or SELECTIV-KO-Myh6, n = 3) were injected with AAV9 particles directly labeled with a positron emitter (Cu-64). e, PET was used to track particle circulation over time and projected PET/CT images are shown over 21 h, comparing control, AAVR-KO and SELECTIV-KO-Myh6 mice. f, Ex vivo quantification of AAV vector particles present in dissected heart, liver, lung and blood as determined at 22 h post-injection by PET. Mean value and s.e.m. are shown (n = 3 mice). The P value was calculated using an ordinary one-way ANOVA with a Holm–Šídák’s multiple comparisons post-test, with **P < 0.01, *P < 0.05 (heart P = 0.012, liver P = 0.0053, lung P = 0.16, blood P = 0.17). Bio-D, biodistribution; % ID/cc, percent injected dose per cubic centimeter. Source data
Fig. 5
Fig. 5. The transduction specificity of the SELECTIV-KO system is tightly controlled by the choice of Cre mouse line.
a, SELECTIV-KO mice were bred with Alb-Cre mice on an AavrKO background to generate mice with selective AAVR overexpression in liver hepatocytes and KO of Aavr in nontarget tissue (SELECTIV-KO-Alb). Littermate controls heterozygous (control) or homozygous for the endogenous Aavr-KO allele (AAVR-KO) were also produced during breeding. b, Control (n = 5 mice), SELECTIV-KO-Alb (liver-specific) (n = 5 mice) and AAVR-KO (n = 5 mice) mice were injected with 3 × 1010 vg AAV9-luciferase by systemic (i.v.) injection (both male and female, 6–8 weeks of age). Transduction was tracked over time by in vivo imaging and assessed ex vivo. Transduction was measured ex vivo for the liver, heart, lung and muscle, which demonstrated specific transduction of the liver in the SELECTIV-KO-Alb mice, with detargeting of the other organs and tissue. Mean value and s.e.m. are shown. The horizontal dashed line indicates background luminescence in lysates of a mouse not transduced by AAV9-luciferase. Fold-changes are indicated, and the P value was calculated using an ordinary one-way ANOVA with Holm–Šídák’s multiple comparisons post-test, with ****P < 0.0001, *P < 0.05 (control versus SELECTIV-KO-Alb: liver P = 0.075, heart P = 6.5 × 10−9, lung P = 3.2 × 10−5, muscle P = 9.4 × 10−8; SELECTIV-KO-Alb versus AAVR-KO: liver P = 5.5 × 10−6, heart P = 0.020, lung P = 0.34, muscle P = 0.012). c, Control and SELECTIV-KO-Alb (liver-specific) mice were injected with 2 × 1011 vg PHP.eB-GFP by systemic (i.v.) injection. Mice were euthanized at 28 d post-transduction and liver and heart were removed to determine transduction by fluorescence microscopy. Scale bars, 200 µm. Similar results were seen in three biological replicates. Source data
Fig. 6
Fig. 6. Selective AAVR expression in a neuronal subpopulation targets AAV transduction to specific regions in the brain upon systemic delivery.
a, Schematic of the experiment. Mice were injected with AAV-PHP.eB-GFP, a capsid variant that can enter the brain after systemic injection. Brains were extracted after 28 d, and sections were cut on the sagittal plain and nuclear staining was performed. Similar results were seen in two biological replicates; data for male mice are shown, at 6–8 weeks of age. b, Fluorescence microscopy in brain slices of a control mouse. Widespread transduction to different areas in the brain slice was detected (GFP; green). c, Fluorescence microscopy in brain slices of a SELECTIV-KO-Chat mice, which was bred to express AAVR in cholinergic neurons with concomitant KO in all other cell types. Transduction was observed in localized areas, which correspond to areas enriched in cholinergic neurons (GFP; green). d, Higher-magnification images of the brain slices. The AAVR-mCh expression (red) can be seen in the areas with a high density of cholinergic neurons such as the pons and medulla in the SELECTIV-KO-Chat mice. This correlates with high levels of transduction in these areas, while only moderate transduction was seen in control mice. In areas with low levels of Chat-positive cholinergic neurons, such as cerebral cortex, hippocampus and anterior olfactory nucleus, control mice have clear transduction, while SELECTIV-KO-Chat mice show little to no transduction. Scale bars, 1 mm (b,c) and 50 µm (d).
Extended Data Fig. 1
Extended Data Fig. 1. Breeding for SELECTIV-WB full body AAVR-overexpressing mice.
SELECTIV (LSL-Aavr-mCh+/+, Aavr+/+) mice were bred with E2A-Cre mice from the Jackson Laboratory (E2A-Cre+/+ Aavr+/+), which express Cre in early embryogenesis. This results in the F1 generation, which had partial editing of the LSL allele and results in mosaic overexpression of the Aavr-mCh transgene, including in some germline cells. These mice are crossed with wild-type mice to generate the F2 generation, where some mice will be Aavr-mCh+/− and E2A-Cre−/− (SELECTIV-WB). These mice are then crossed to generate the F3 generation, which includes the SELECTIV-WB mice (Aavr-mCh+/+, Aavr+/+), which were maintained as a pure line of AAVR-mCh overexpressing mice.
Extended Data Fig. 2
Extended Data Fig. 2. AAVR protein expression and immune cell profiling in mouse lines.
Tissue from Aavr+/+, Aavr+/−, Aavr−/− and, SELECTIV-WB mice were homogenized and AAVR and GAPDH protein was detected by western blotting. Samples were normalized for tissue weight and equal amounts were loaded except for the SELECTIV-WB samples for heart and lung, which were diluted 1:10 prior to loading. AAVR was not detected in AAVR-KO mice, while SELECTIV-WB mice have highly increased AAVR protein levels. b, Semi-quantitative analysis was performed by quantifying the relative expression of AAVR compared to GAPDH for each sample (all samples normalized to Aavr+/+ for each tissue). Mean value and SEM are shown (n = 3 mice) c-d, Immune cells populations in the spleen (c) and circulation (d) were quantified. There were no apparent differences in cell quantities compared to Aavr+/+ mice. Source data
Extended Data Fig. 3
Extended Data Fig. 3. In vivo imaging of mice transduced with AAV2-luc by intramuscular injection.
Control and SELECTIV-WB mice were injected with AAV2-luciferase by intramuscular injection and luciferase activity was tracked over time through in vivo imaging. Mice were injured by BaCl2 injection at day 30, and transduction continued to be tracked until day 120 post transduction.
Extended Data Fig. 4
Extended Data Fig. 4. Comparison of expression of AU040320in vivo in mice in various muscle cell types.
Data from Tabula Muris for expression of AU040320 (Aavr, mouse gene encoding AAVR), which encodes for AAVR in mice, based on single cell sequencing of FACS sorted cells. Data for the percentage of cells with detectable levels of AU040320 were graphed for all cell types with data for >100 individual cells in the original analysis. Expression of AU040320, was lowest in skeletal muscle satellite cells, with 96.3% of cells having no detectable expression. The similarly annotated skeletal muscle satellite stem cells also had minimal expression of AU040320. Source data
Extended Data Fig. 5
Extended Data Fig. 5. Breeding for SELECTIV-Pax7CE mice with inducible muscle stem cell specific AAVR overexpression.
Female SELECTIV-KO (LSL-Aavr-mCh+/−, Aavr−/−) mice were bred with male Pax7CE (Pax7-CreERT2) mice that were purchased from Jax (Stock No: 017763) to generate SELECTIV-Pax7CE (LSL-Aavr-mCh+/−, Pax7-CreERT2+/−, Aavr+/−). Treatment with tamoxifen by IP injection results in Pax7-dependent expression of the SELECTIV construct.
Extended Data Fig. 6
Extended Data Fig. 6. Breeding for SELECTIV-KO-Myh6 mice with heart cardiomyocyte specific AAVR overexpression.
SELECTIV (LSL-Aavr-mCh+/+, Aavr+/−) male and SELECTIV-KO (LSL-Aavr-mCh+/+, Aavr−/−) female mice were crossed to generate and maintain SELECTIV-KO female mice for breeding. Male mice on the BL/6 background that are Aavr−/− are sterile, so they must be maintained as Aavr+/−. Myh6-Cre (Myh6-Cre+/+, Aavr+/+) male mice were purchased from Jax (Stock No: 011038) and bred with AAVR-KO (Aavr−/−) female mice to generate Myh6-Het (Myh6-Cre+/−, Aavr+/−) male mice (optional breeding can be carried out to generate Myh6-Cre+/+, Aavr−/− males). The F1 generation SELECTIV-KO and Myh6-Het mice were bred to generate the F2 mice, which results in SELECTIV (LSL-AAVR+/−, Myh6-Cre−/−, AAVR+/−), SELECTIV-KO (LSL-Aavr-mCh+/−, Myh6-Cre−/−, Aavr−/−), SELECTIV-KO-Myh6 (LSL-AAVR-mCh+/−, Myh6-Cre+/−, Aavr−/−), and SELECTIV-WT-Myh6 (LSL-Aavr-mCh+/−, Myh6-Cre+/−, Aavr+/−). The SELECTIV-KO-Myh6 mice are used to show specific targeting of the heart with detargeting in the rest of the body, while other mice can be used as controls.
Extended Data Fig. 7
Extended Data Fig. 7. Transduction of SELECTIV-KO-Myh6 mice.
a, In vivo imaging of mice with heart cardiomyocyte specific expression of AAVR transduced with AAV9-luc. Control mice (Aavr+/−) or SELECTIV-KO-Myh6 mice were injected intravenously with AAV9 encoding luciferase. Representative mice are shown for mice on days 7, 14, and 20 mice after injection with luciferin and imaging using the Lago in vivo imaging system. Luciferase activity is more dispersed in Control mice, while activity in SELECTIV-KO-Myh6 mice is concentrated in a distinct area of the chest. b, Specific transduction of SELECTIV-KO-Myh6 mouse hearts by AAV-GFP. SELECTIV-KO-Myh6 and Control mice were transduced with AAV-PHP.eB encoding EGFP. 28-days post AAV transduction, hearts and livers were removed, and transduction was determined by microscopy (GFP; green). Hoechst nuclear staining in blue. Stitched pictures are shown for the inlays (dotted boxes) shown at higher magnification in Fig. 4c. Scale bar: 1 mm.
Extended Data Fig. 8
Extended Data Fig. 8. Transduction of SELELCTIV-KO-Alb mice.
a, In vivo imaging of mice with liver specific expression of AAVR transduced with AAV9-luc. Control mice (Aavr+/−) or SELECTIV-KO-Alb mice were injected intravenously with AAV9 encoding luciferase. Representative mice are shown for mice on days 7, 14, and 20 mice after injection with luciferin and imaging using the Lago in vivo imaging system. Luciferase activity can be seen throughout the body of Control mice, while high levels of activity can only be seen in the abdomen of SELECTIV-KO-Alb mice. b, Specific transduction of SELECTIV-KO-Alb mouse livers by AAV-GFP. Control and SELECTIV-KO-Alb mice were transduced with AAV-PHP.eB encoding EGFP. 28-days post AAV transduction, hearts and livers were removed, and transduction was determined by microscopy (GFP; green). Hoechst nuclear staining in blue. Stitched pictures are shown for the inlays (dotted boxes) shown at higher magnification in Fig. 5c. Scale bar: 1 mm.
Extended Data Fig. 9
Extended Data Fig. 9. In vivo transduction of SELECTIV-KO-Chat mice.
a, Chat (choline acetyltransferase) RNA in the brain of a 56 day old male mouse (Allen Mouse Brain Atlas, https://mouse.brain-map.org/experiment/show?id=253). Scale bar: 1 mm. b, Outline of areas used to demonstrate AAVR overexpression and AAV transduction in Fig. 6d. Control and SELECTIV-KO-Chat mice were transduced with PHP.eB-GFP and low magnification confocal is shown of the entire brain. Outlines are shown for where higher-magnification imaging was performed in various areas of the brain: 1) Pons, 2) Medulla, 3) Cerebral Cortex, 4) Hippocampus, 5) Anterior Olfactory nucleus. Scale bar: 1 mm. c, Transduction in the liver of mice transduced with AAV-PHP.EB-GFP corresponding the mice in Fig. 6. Livers from the Control and SELECTIV-KO-Chat mice imaged in Fig. 6 were collected and sectioned for imaging by microscopy. Transduction was seen throughout the liver of Control mice, while no transduction was seen in the SELECTIV-KO-Chat mouse livers. Scale bar: 130 µm.

References

    1. Madisen L, et al. A toolbox of Cre-dependent optogenetic transgenic mice for light-induced activation and silencing. Nat. Neurosci. 2012;15:793–802. doi: 10.1038/nn.3078. - DOI - PMC - PubMed
    1. Zeng H, Madisen L. Mouse transgenic approaches in optogenetics. Prog. Brain Res. 2012;196:193–213. doi: 10.1016/B978-0-444-59426-6.00010-0. - DOI - PMC - PubMed
    1. Asrican B, et al. Next-generation transgenic mice for optogenetic analysis of neural circuits. Front. Neural Circuits. 2013;7:160. doi: 10.3389/fncir.2013.00160. - DOI - PMC - PubMed
    1. Perlman RL. Mouse models of human disease: an evolutionary perspective. Evol. Med. Public Health. 2016;2016:170–176. - PMC - PubMed
    1. Gurumurthy CB, Lloyd KCK. Generating mouse models for biomedical research: technological advances. Dis. Model. Mech. 2019;12:dmm029462. doi: 10.1242/dmm.029462. - DOI - PMC - PubMed

Publication types