. 2023 Jun;25(6):823-835.
doi: 10.1038/s41556-023-01154-4. Epub 2023 Jun 8.

Architecture and dynamics of a desmosome-endoplasmic reticulum complex

Affiliations

Architecture and dynamics of a desmosome-endoplasmic reticulum complex

Navaneetha Krishnan Bharathan et al. Nat Cell Biol. 2023 Jun.

Erratum in

  • Author Correction: Architecture and dynamics of a desmosome-endoplasmic reticulum complex.
    Bharathan NK, Giang W, Hoffman CL, Aaron JS, Khuon S, Chew TL, Preibisch S, Trautman ET, Heinrich L, Bogovic J, Bennett D, Ackerman D, Park W, Petruncio A, Weigel AV, Saalfeld S; COSEM Project Team; Wayne Vogl A, Stahley SN, Kowalczyk AP. Bharathan NK, et al. Nat Cell Biol. 2024 Apr;26(4):660. doi: 10.1038/s41556-024-01376-0. Nat Cell Biol. 2024. PMID: 38347183 No abstract available.

Abstract

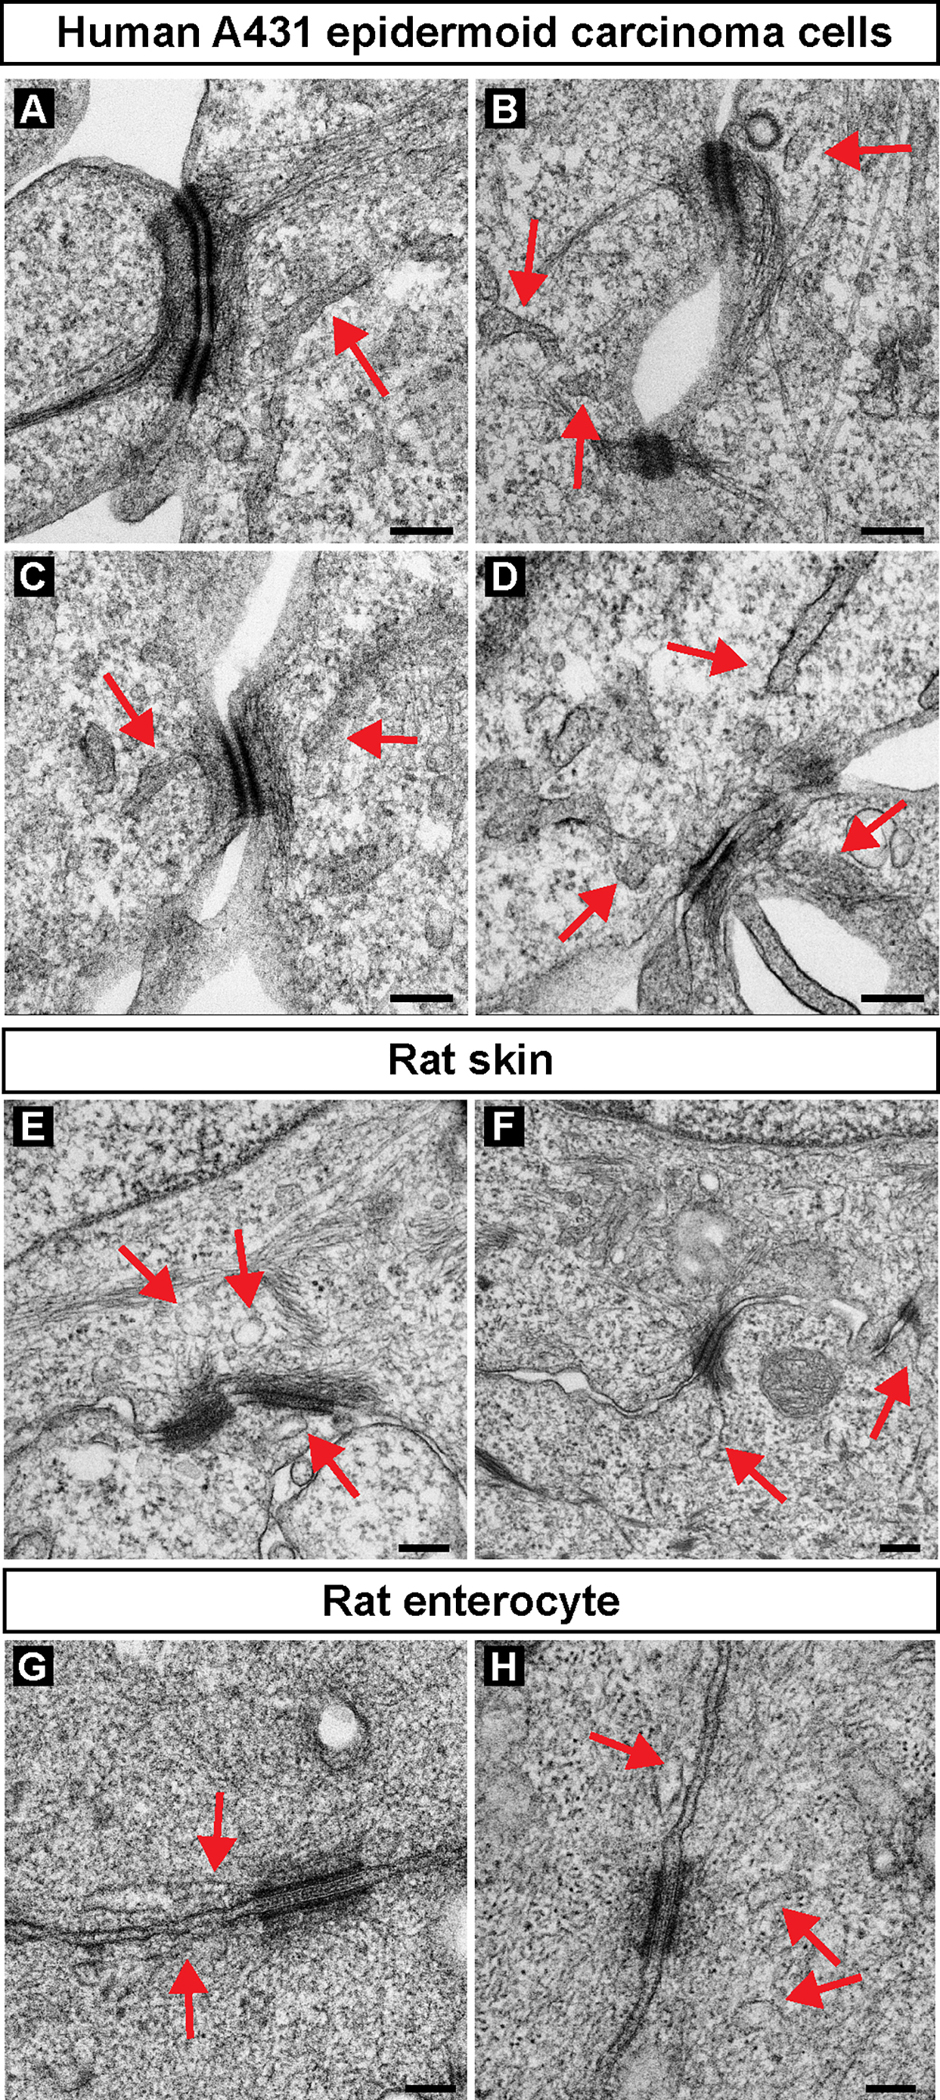
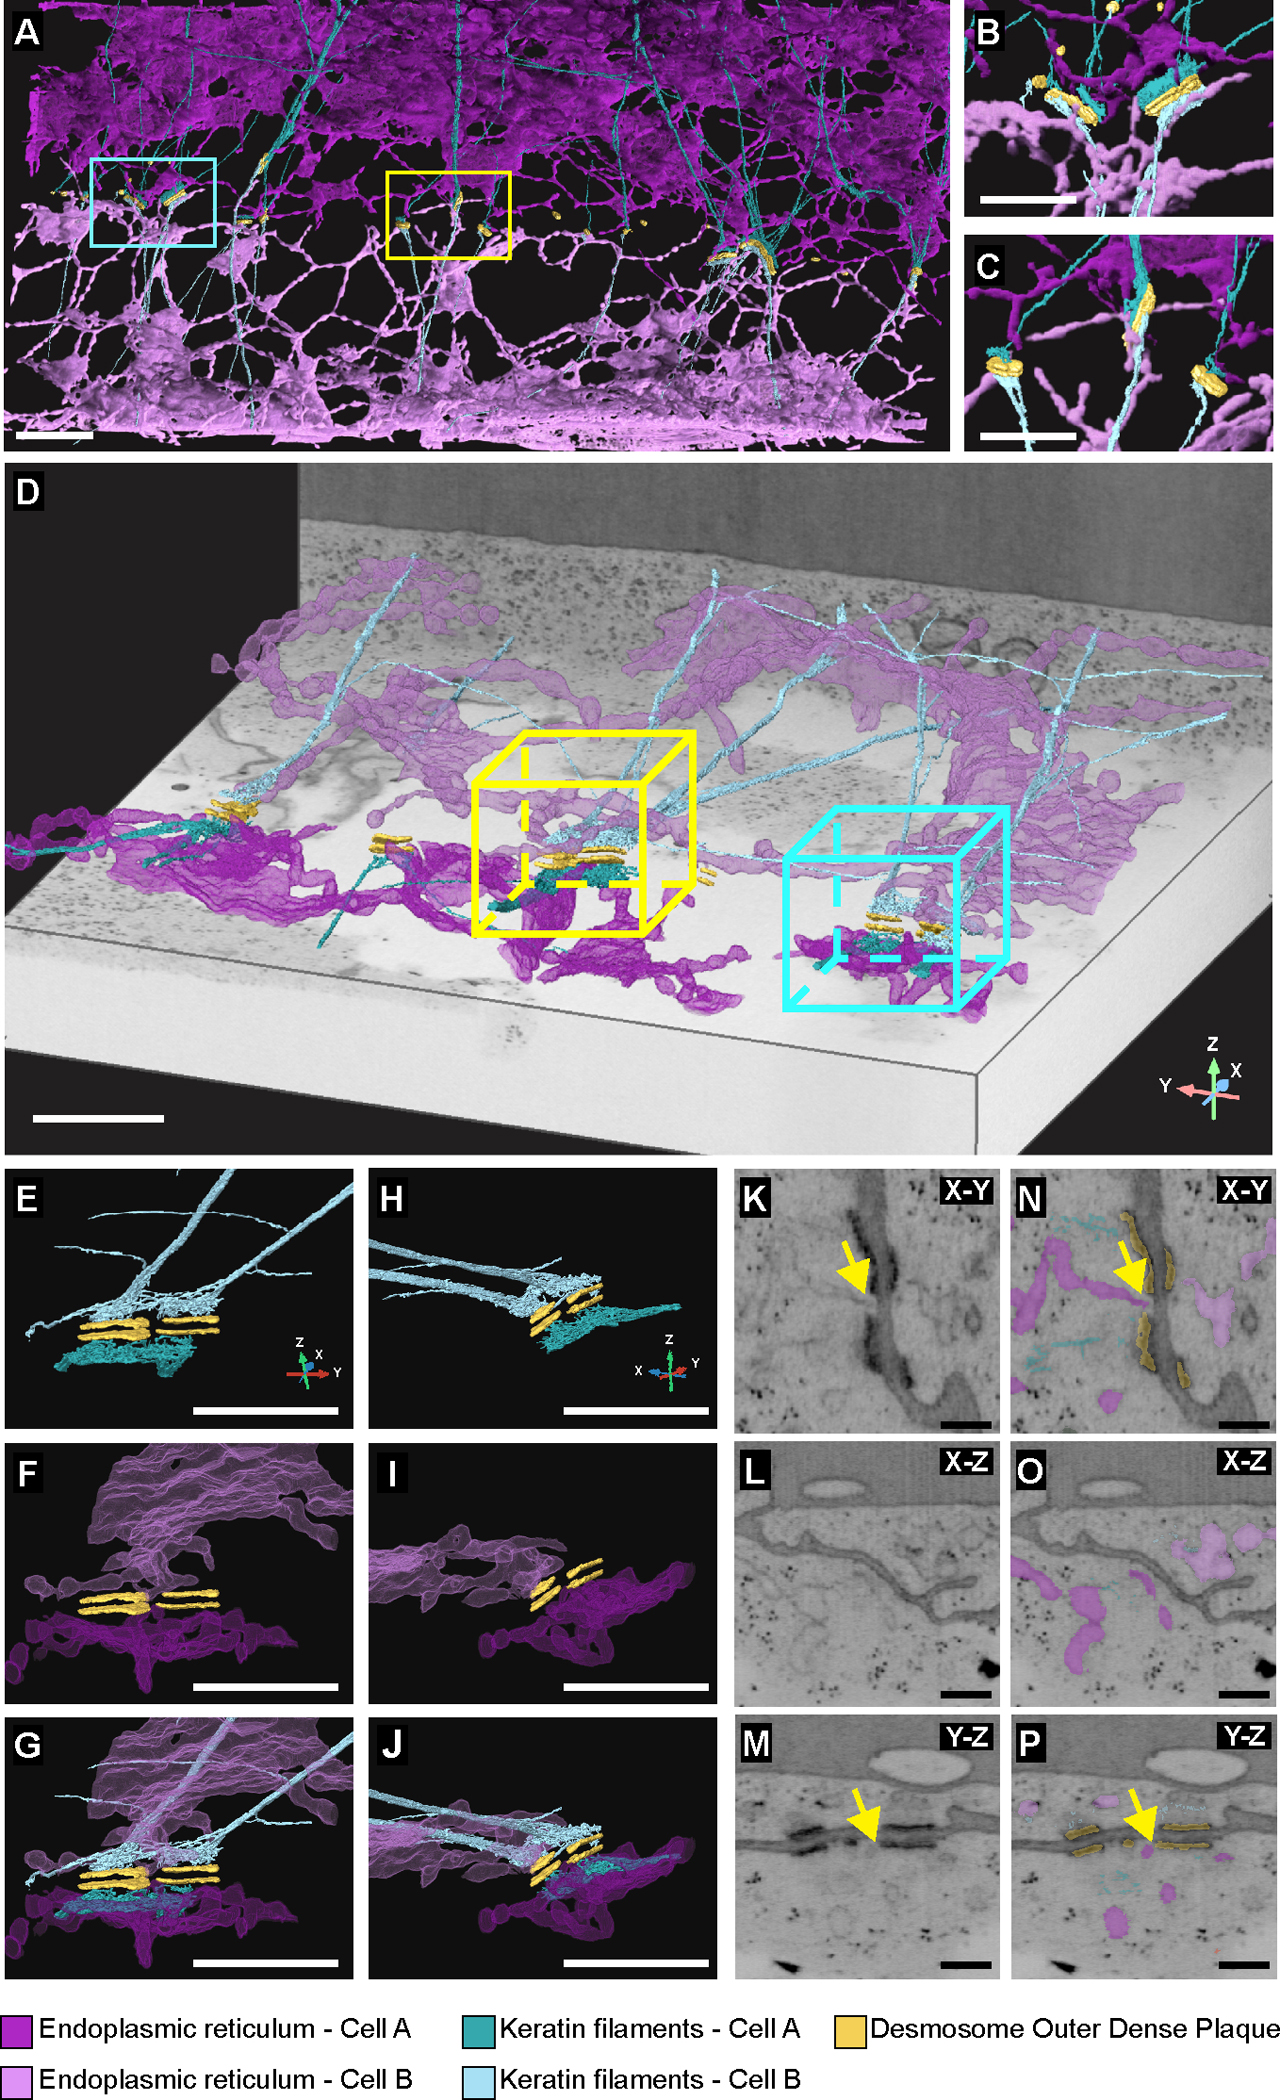
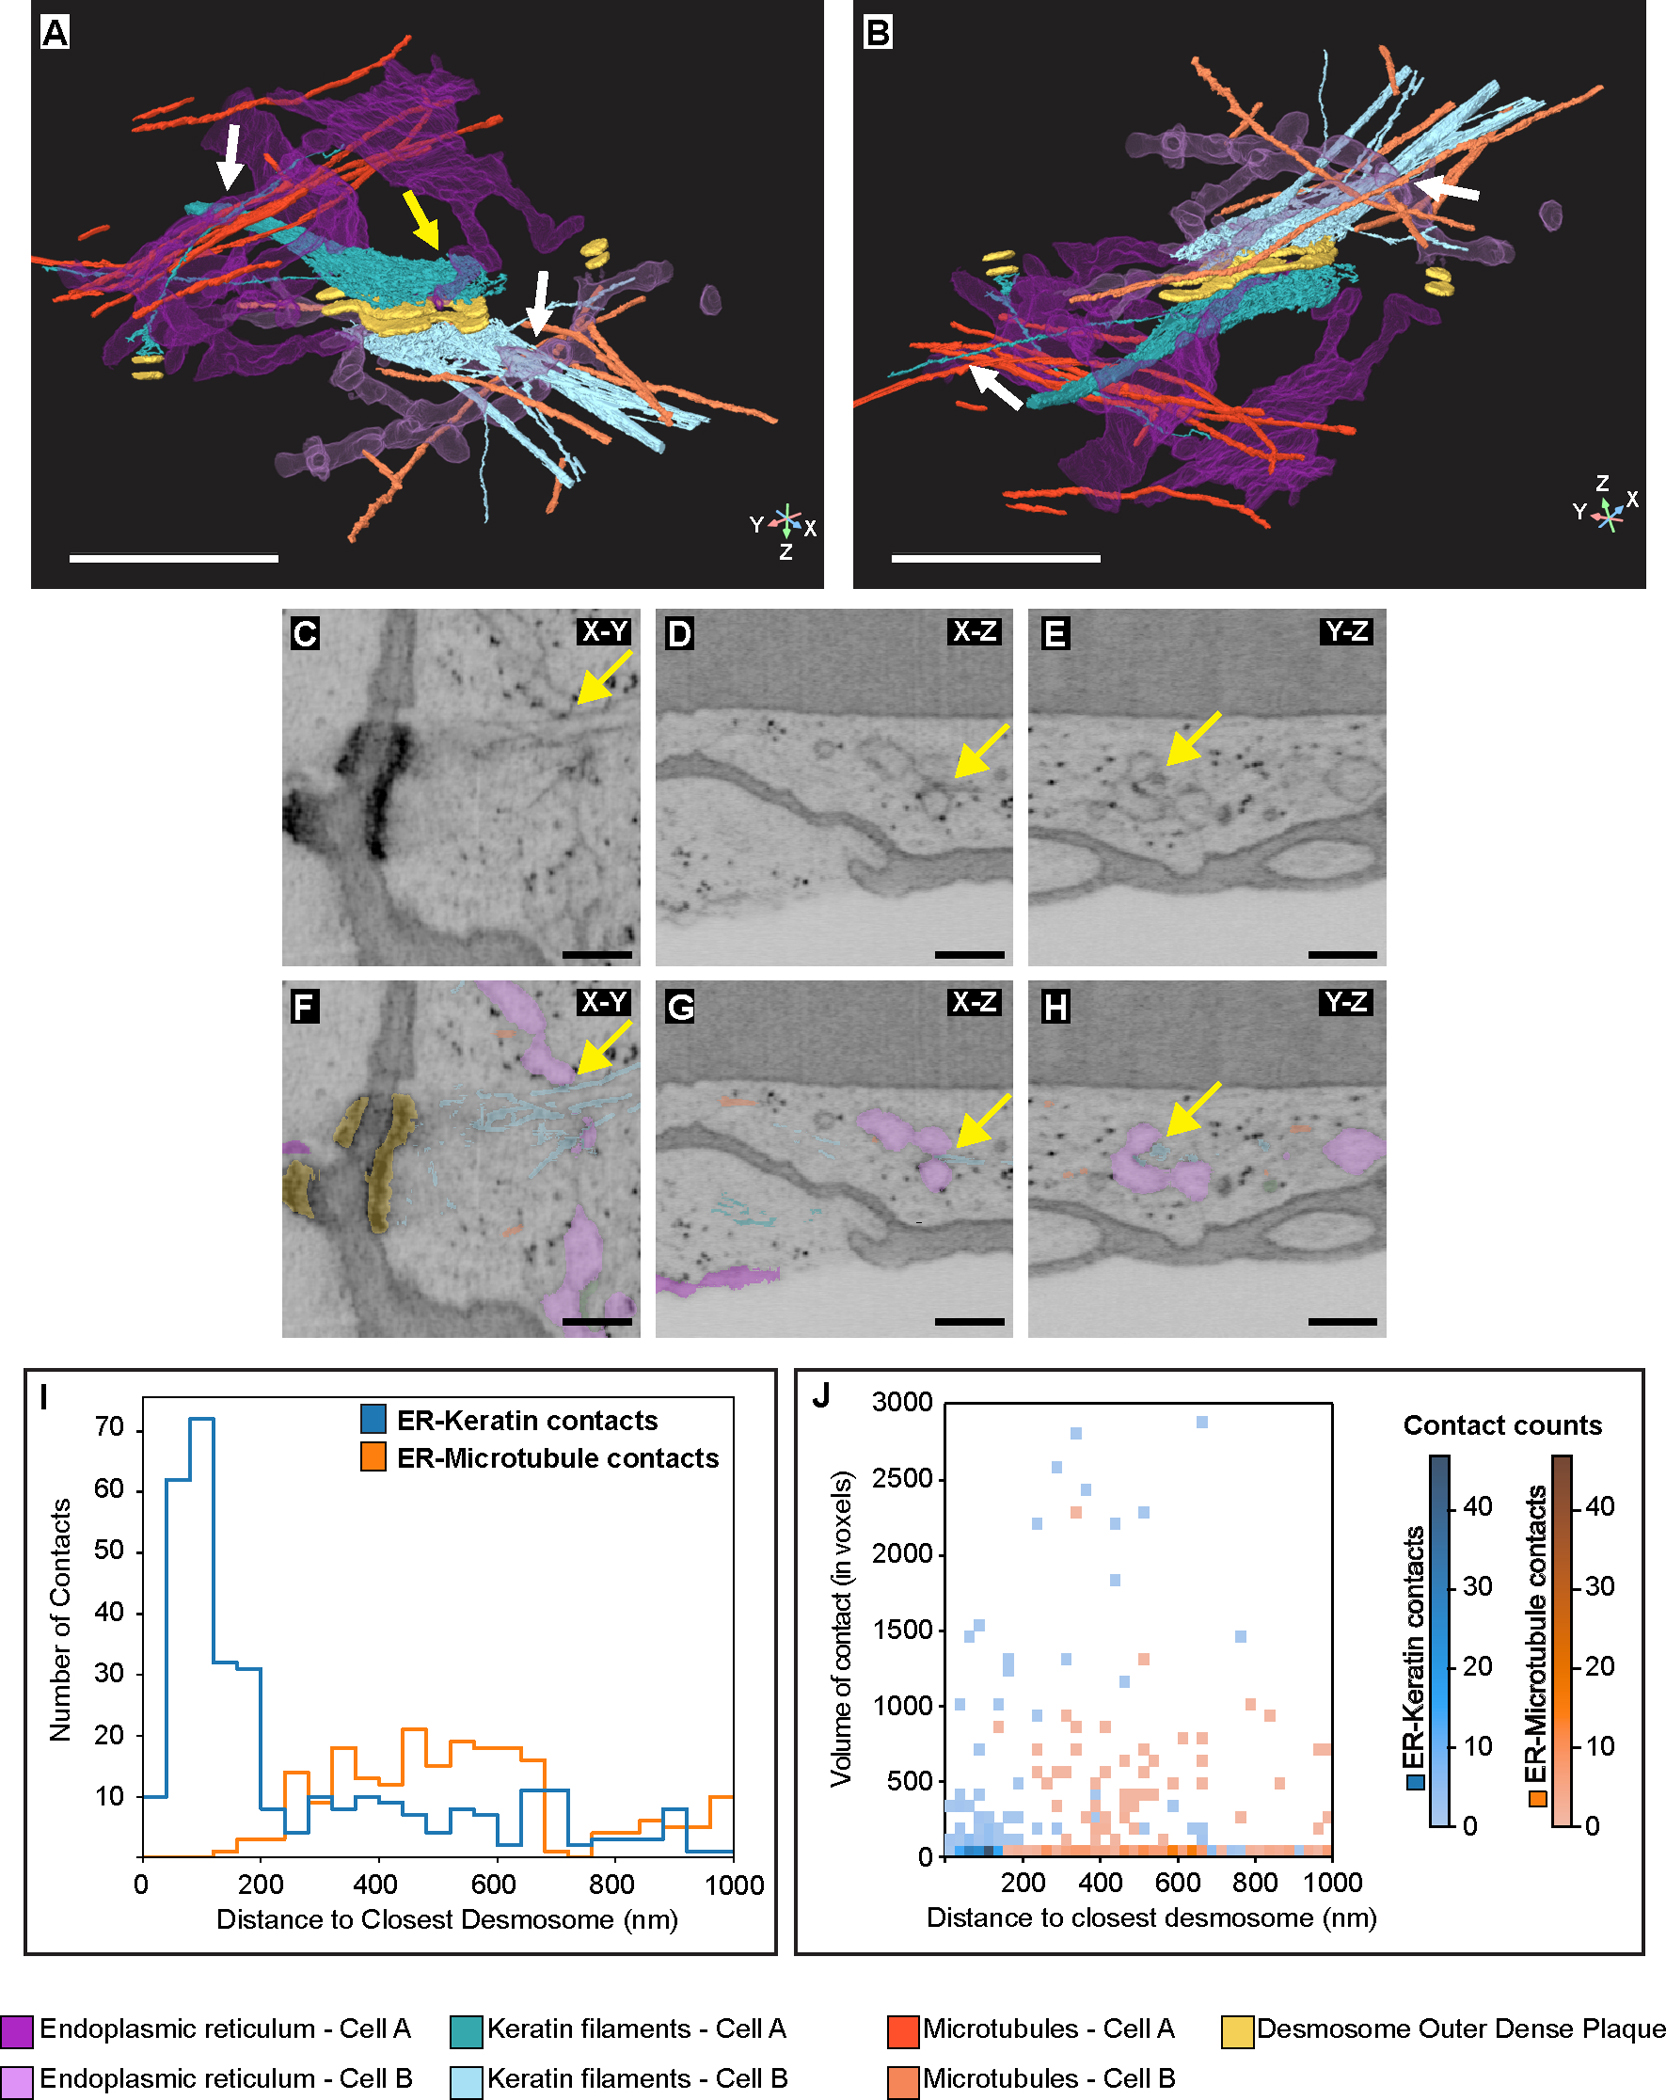
The endoplasmic reticulum (ER) forms a dynamic network that contacts other cellular membranes to regulate stress responses, calcium signalling and lipid transfer. Here, using high-resolution volume electron microscopy, we find that the ER forms a previously unknown association with keratin intermediate filaments and desmosomal cell-cell junctions. Peripheral ER assembles into mirror image-like arrangements at desmosomes and exhibits nanometre proximity to keratin filaments and the desmosome cytoplasmic plaque. ER tubules exhibit stable associations with desmosomes, and perturbation of desmosomes or keratin filaments alters ER organization, mobility and expression of ER stress transcripts. These findings indicate that desmosomes and the keratin cytoskeleton regulate the distribution, function and dynamics of the ER network. Overall, this study reveals a previously unknown subcellular architecture defined by the structural integration of ER tubules with an epithelial intercellular junction.


Conflict of interest statement

Competing interests:

The authors declare that they have no competing interests.

Figures

Extended Data Fig. 1
Extended Data Fig. 1. ER tubules are proximal to desmosomal junctions in various epithelial cell culture models.
(A-C) Representative light microscopy images of a pair of A431 cells (A), HaCaT immortalized keratinocytes (B), and primary Normal Human Epidermal Keratinocytes (C) expressing mCherry-VAPB (magenta, ER marker) showing ER tubule and desmosomal junction (orange) proximity (red or white arrowheads). Desmosomes are labelled with DP-EGFP in A and B, or with an AF488-conjugated anti-DSG3 mAb (AK23) in C. Images are representative of n=3 independent experiments (A, B) and 2 independent experiments (C). Scale bar = 2μm.
Extended Data Fig. 2
Extended Data Fig. 2. ER tubules are proximal to the desmosomal plaque in epithelial cell culture models and various tissues.
(A-H) Transmission electron micrographs of A431 epithelial cells (A-D), rat skin (E, F), and rat enterocytes (G, H) show ER tubules (red arrows) proximal to the electron-dense desmosomal plaque. Images are representative of n=1 replicate for each cell or tissue type. Scale bar = 200nm (A-F), 100nm (G, H).
Extended Data Fig. 3
Extended Data Fig. 3. FIB-SEM reveals ER tubules in physical contact with the desmosome outer dense plaque.
(A-C) Orthoslices in XY (A), XZ (B), and YZ (C) showing ER tubules making physical contact with desmosome outer dense plaque. (D-F) Same orthoslices as in A-C with ER, keratin, and desmosome segmentations. Yellow arrows point to physical contact between ER tubules and the desmosome outer dense plaque in all 3 views. Images are representative of n=1 cell-cell contact. Scale bar = 250nm.
Extended Data Fig. 4
Extended Data Fig. 4. Ribosomes are less prominent on desmosome-adjacent ER than planar ER.
(A-B) Rotated views showing that ER structures (magenta) have fewer bound ribosomes (white) at desmosome (yellow)-adjacent regions (white arrows) than at regions further away from the desmosome (blue arrows) in both top and bottom cells. Images are representative of n=1 cell-cell contact. Scale bar = 1μm. (C-E) Three-dimensional reconstructions of segmentations in 4×4×4nm3 FIB-SEM data reveal keratin filaments (teal) contacting and penetrating planar ER sheets (magenta). Microtubules (orange) are also present in the vicinity of planar ER, and ribosomes (white) decorate the surface of ER sheets. (F-H) Rotated views of the same region in C-E. Images are representative of n=1 cell. Scale bar = 500nm (C-H).
Extended Data Fig. 5
Extended Data Fig. 5. The ER makes more contacts with keratin filaments compared to microtubules proximal to the desmosome.
(A-B) FIB-SEM segmentations showing keratin filaments (teal), desmosomes (yellow), microtubules (orange), and ER (magenta) (A). Panel (B) displays ER-keratin (teal) and ER-microtubule (orange) contacts at a distance threshold of 16nm. Scale bar = 1μm. (C-F) Close-up of keratin filaments, microtubules, and ER adjacent to a desmosome (C-E) revealing larger and more numerous ER-keratin contacts (blue arrowheads) compared to ER-microtubule contacts (orange arrowheads) (F). Images in A-F are representative of n=1 cell-cell contact. Scale bar = 500nm. (G) Violin plots of ER-keratin (blue) and ER-microtubule (orange) contacts at x nm away from the closest desmosome. Individual contacts are represented by black vertical lines. Setting various contact site distance thresholds between 0nm to 16nm (y-axis) demonstrates that ER-keratin contacts preferentially occur proximal to desmosomes. Source numerical data are available in source data.
Extended Data Fig. 6
Extended Data Fig. 6. ER tubules closely associate with desmosomes in live cells.
(A-E) Snapshots of a live-cell time-course of desmoplakin (top row, orange in bottom row) and VAPB (middle row, magenta in bottom row) in A431 cells at the cell-cell contact over 2 minutes (Images are representative of n=3 independent experiments). Gamma correction was applied to grayscale images. Gamma (inverted) = 1.5 (VAPB). Scale bar = 2μm. (F-J) ilastik-rendered segmentations of DP (top row) and VAPB (middle row) channels in A-E. Bottom row indicates only overlapping pixels (white) between DP and VAPB channels. Overlap indicates that tips of ER tubules colocalize with DP puncta. Scale bar = 2μm.
Extended Data Fig. 7
Extended Data Fig. 7. ER retracts from cell-free edges only in cells where microtubules are depolymerized.
(A, B) Representative images of A431 cells treated with either DMSO or 30μM nocodazole reveal that ER (VAPB, magenta) tubules are converted to sheets with nocodazole treatment. The ER remains tethered to desmosomes (DP, orange) at cell-cell contacts under both treatment conditions. Images are representative of at least n=2 independent experiments. Scale bar = 2μm. (C, D) Representative images of A431 cells treated with either DMSO or 30μM nocodazole reveal that ER (VAPB, magenta) remains close to the periphery of a cell-free edge in DMSO-treated cells (C) but retracts in nocodazole-treated cells (D). Tubulin Tracker Deep Red labelling reveals a lack of microtubules in nocodazole-treated cells but not in DMSO-treated cells. Cell-free edge is depicted by a dashed red or white line. Images are representative of at least n=2 independent experiments. Scale bar = 2μm. Gamma correction was applied to some grayscale images. Gamma (inverted) = 1.75 (D, DP channel), 0.75 (A, Tubulin Tracker channel), 1.5 (C, Tubulin Tracker channel).
Extended Data Fig. 8
Extended Data Fig. 8. ER tubules associate with desmosomes during fusion events.
(A-F) Snapshots of a live-cell time-course of desmoplakin (top row, orange in bottom row) and VAPB (middle row, magenta in bottom row) in A431 cells during the fusion of DP puncta at the cell-cell contact (Images are representative of n=4 independent experiments). Three DP puncta (A) fuse to form two puncta (B). Eventually, these puncta fuse to form one DP puncta (F). Gamma correction was applied to grayscale images. Gamma = 0.7 (DP/ VAPB merge), Gamma (inverted) = 1.5 (VAPB). Scale bar = 1μm. (G-L) ilastik-rendered segmentations of DP (top row) and VAPB (middle row) channels in A-F. Bottom row indicates only overlapping pixels (white) between DP and VAPB channels. Overlap indicates that tips of ER tubules colocalize with DP puncta during fusion. Scale bar = 1μm.
Extended Data Fig. 9
Extended Data Fig. 9. ER tubules remain at the cell-cell border even when desmoplakin translocation to the border is inhibited.
(A-E) Representative time-lapse of A431 cells expressing DP-EGFP (orange) and mApple-VAPB (magenta) pre-treated with DMSO for 30 minutes, followed by a switch to high calcium media. ER tubules extend toward the cell periphery, sometimes forming paired structures across adjacent cells (red arrows, B). Desmosomes form at the exact position of ER paired structures (blue arrows in E). Images are representative of n=2 independent experiments. Scale bar = 2μm. (F-J) Representative time-lapse of A431 cells expressing DP-EGFP (orange) and mApple-VAPB (magenta) pre-treated with 1μM thapsigargin (TG) for 30 minutes, followed by a switch to high calcium media. ER tubules extend toward the cell periphery, sometimes forming paired structures across adjacent cells (red arrows, F, G). ER tubules eventually remain at the periphery in adjacent cells, but no desmosomes form (J). Timestamps indicate time after DMSO/ thapsigargin wash-out and switch to high calcium media. Images are representative of n=3 independent experiments. Scale bar = 2μm.
Extended Data Fig. 10
Extended Data Fig. 10. Keratin filaments and aggregates are stably tethered to ER membranes.
(A) Snapshot of an A431 cell expressing mNeonGreen-KRT14WT (blue) and mApple-VAPB (magenta) showing ER tubules along keratin filaments (Images are representative of n=3 independent experiments). Solid yellow line indicates position of kymograph in B-D. Scale bar = 1μm. (B-D) Kymograph of yellow line in A revealing stable ER-keratin interaction over a 2-minute time course. Scale bar = 500nm. (E) Snapshot of an A431 cell expressing mNeonGreen-KRT14R125C (blue) and mApple-VAPB (magenta) showing ER sheets surrounding KRT14R125C aggregates (Images are representative of n=3 independent experiments). Solid yellow line indicates position of kymograph in F-H. Scale bar = 1μm. (F-H) Kymograph of yellow line in E revealing stable ER-keratin interactions over a 2-minute time course. Scale bar = 500nm. (I) Graph depicting the fraction of KRT14R125C aggregates colocalizing with ER at each timepoint during a 25 timepoint/2-minute time course. Data are represented as mean ± s.d.; n indicates total number of KRT14R125C aggregates analyzed from three independent experiments. Source numerical data are available in source data.
Fig. 1.
Fig. 1.. FIB-SEM reveals ER-desmosome associations.
(A-C) FIB-SEM segmentations of a cell-cell contact in A431 cells acquired at 8nm isotropic voxel size showing desmosome outer dense plaques (yellow), keratin filaments (teal) and ER (magenta) (n=1 cell-cell contact at 8nm isotropic resolution). Different shades of teal and magenta distinguish keratin and ER in adjacent cells. Cyan and yellow boxes indicate regions with magnified views shown in insets B and C, respectively. Scale bar = 2μm (A), 1μm (B, C). (D) FIB-SEM segmentations of a cell-cell contact in A431 cells acquired at 4nm isotropic voxel size (n=1 cell-cell contact at 4nm isotropic resolution). Cyan box indicates region with magnified segmentations shown in E-J. Yellow box is magnified in Fig. 2. Scale bar = 1μm. (E-J) Rotated views of a desmosome outer dense plaque (yellow) showing mirror image-like organization of teal keratin filaments (E, H) and magenta ER (F, I). Panels G and J show rotated views of desmosome outer dense plaque, keratin filaments and ER. Scale bar = 1μm. (K-P) Orthoslices in XY (K, N), XZ (L, O), and YZ (M, P) without or with desmosome, ER, and keratin segmentations. Yellow arrows point to ER tubules proximal to desmosome outer dense plaque. Scale bar = 250nm.
Fig. 2.
Fig. 2.. FIB-SEM reveals ER-keratin filament associations in A431 cells.
(A-B) Rotated views of the yellow box in Fig. 1D showing ER tubules (magenta) making contact with keratin filaments (teal) (white arrows) and with the desmosome plaque (yellow arrows). Microtubules (orange) are also shown. Scale bar = 1μm. (C-E) Orthoslices showing ER tubules making contact with electron-dense keratin filaments (yellow arrows). Scale bar = 250nm. (F-H) Same orthoslices as in E-G with ER, keratin, and microtubules segmentations. Scale bar = 250nm. (I) Histogram depicting the frequency of ER-keratin (blue line) and ER-microtubule (orange line) contacts to the nearest desmosome using a contact distance threshold of 16nm. (J) Histogram depicting the voxel sizes of ER-keratin (blue) and ER-microtubule (orange) contacts at x nm away from the closest desmosome, using a contact distance threshold of 16nm. Data in I and J represent measurements from n=33 desmosomes at two cell-cell contacts. Colorbars on the right illustrate the number of contacts of a specific size and at a specific distance from the closest desmosome. Source numerical data are available in source data.
Fig. 3.
Fig. 3.. Analysis of FIB-SEM data reveals a symmetrical organization of ER and keratin filaments proximal to desmosomes.
(A-D) Rotated views of 3D reconstructions of the 4×4×4nm3 dataset with either microtubules (orange) or endosomes (green) in addition to desmosomes (yellow), ER (magenta), and keratin (teal). Scale bar = 1μm. (E) Scatterplots representing the 4×4×4nm3 dataset showing the distance from individual desmosomes to the closest organelles in each cell (n=6 desmosomes at one cell-cell contact). (F) Scatterplots representing the 8×8×8nm3 dataset showing the distance from individual desmosomes to the closest organelles in each cell (n=27 desmosomes at one cell-cell contact). The marker size is proportional to desmosome volume, with color and shape showing whether a desmosome has radial keratins on both cytoplasmic faces (gray triangles), radial keratin on only one face, (blue square), or no radial keratin on either face (green circles). Bottom row shows a magnification of the plots in the top row. Source numerical data are available in source data.
Fig. 4.
Fig. 4.. Desmosomes anchor ER tubules and stabilize ER membrane.
(A) Snapshot of a pair of A431 cells expressing Desmoplakin-EGFP (orange, desmosome marker) and mApple-VAPB (magenta, ER marker) showing ER tubules anchored on either side of desmoplakin puncta. Dashed white line indicates cell-cell border. Solid yellow line indicates position of kymograph in B (Images are representative of n=534 fields from three independent experiments). Scale bar = 1μm. (B) Kymograph of yellow line in A revealing stable ER-DP colocalization over a 2-minute time course. Scale bar = 500nm. (C) Histogram shows percentage of DP puncta that colocalize with ER for t timepoints over a 25 timepoint duration (n=154 puncta in 34 fields from three independent experiments). (D-E) Yellow boxes highlight representative regions analyzed by Membrane Displacement Analysis (MDA). Scale bar = 2μm. (D’-D’’’) ER (magenta), MDA-generated ER movement (green), ER at desmosomes (orange). White arrowheads in D’’ depict location of DP puncta. (E’-E’’) ER (magenta), MDA-generated ER movement (green) at non-desmosomal regions. Bright green pixels in D’’ and E’’ depict ER fraction that is mobile between time points. Note more bright green pixels in E’’ vs. D’’, indicating more mobile ER. Scale bar = 500nm (D, E). (F) Violin plot depicting fraction of mobile ER in desmosomal (n=229 ROIs in 34 fields) vs. non-desmosomal (cytoplasmic) (n=229 ROIs in 34 fields) regions. Exact P values are provided for each comparison (two-tailed Mann-Whitney test; n=3 independent experiments). Horizontal solid black lines in violin plots represent medians and dashed lines represent first (lower) and third (upper) quartiles. Dots are color-coded by replicate. Source numerical data are available in source data.
Fig. 5.
Fig. 5.. ER remains anchored to desmosomal junctions but retracts from cell-free edges when microtubules are depolymerized.
(A-E) Time course at cell-cell border of a pair of A431 cells expressing mApple-VAPB (ER marker, magenta) and DP-EGFP (desmosome marker, orange) treated with 30μM nocodazole (Images are representative of n=3 independent experiments). Microtubules are labelled with Tubulin Tracker Deep Red (white). Microtubules are seen near desmosomes and ER tubules (red arrows) (A). As microtubules depolymerize, peripheral tubular ER becomes more sheet-like and remains tethered to desmosomes (D, E, blue arrows), but retracts from desmosome-free regions (D, E, yellow arrows). Scale bar = 2μm. (F-J) Time course at cell-free edge of an A431 cell expressing mApple-VAPB and DP-EGFP treated with 30μM nocodazole (Images are representative of n=3 independent experiments; some time lapses of cell-free edges are in the same field of view as time lapses of cell-cell borders). Peripheral ER is extended towards the cell-free edge when microtubules are present (F). As microtubules depolymerize, ER sheets retract from the cell-free edge (H-J). Timestamps indicate duration after addition of nocodazole. Cell-free edge is depicted by a dashed red or white line in F-J. Gamma correction was applied to some grayscale images. Gamma (inverted) = 0.75 (A-E, VAPB channel), 1.75 (F-J, DP channel). Scale bar = 2μm.
Fig. 6.
Fig. 6.. ER tubules associate with desmosomes and keratin filaments during assembly.
(A-E) Snapshots of a live-cell time-course of desmoplakin (orange) and VAPB (magenta) in A431 cells as they form cell-cell contacts (Images are representative of n=12 pairs of contacting cells from a total of three independent experiments). ER tubules first extend in both cells (A, red arrow), followed by formation of an ER mirror image at the cell-cell contact (B, black arrow). Desmoplakin puncta appear at the exact position of an ER mirror image (C, D, blue arrows). Eventually, more desmoplakin puncta appear and ER mirror images form as contacts mature (E). Gamma correction was applied to grayscale images. Gamma (inverted) = 1.25 (DP), 1.5 (VAPB). Scale bar = 2μm. (F-J) Snapshots of a live-cell time-course of keratin filaments (blue) and VAPB (magenta) in A431 cells as they form cell-cell contacts (Images are representative of n=12 pairs of contacting cells from a total of five independent experiments). ER tubules sometimes extend alone (F, red arrowhead). ER tubules and keratin filaments extend toward cell-cell contacts simultaneously over several minutes (G, H, blue arrows). Keratin filaments and ER tubules form mirror images as contacts mature (I, J, black arrows). Scale bar = 2μm.
Fig. 7.
Fig. 7.. Desmosomes and keratin regulate peripheral ER organization and ER membrane stability.
(A) A431 WT cells (top row) or Desmoglein-2 knockout cells (bottom row) expressing mNeonGreen-KRT14 (first column, keratin marker) and mApple-VAPB (middle column, ER marker) (Images are representative of n=3 independent experiments). Wheat Germ Agglutinin (WGA) labels the plasma membrane (PM). Yellow arrows show radial keratin filaments and associated VAPB tubules orthogonal to the PM in WT cells. Red arrows show keratin filaments and ER tubules parallel to the PM in DSG2-null cells. Gamma correction was applied to grayscale images. Gamma (inverted) = 1.5 (KRT14 and VAPB channels). Scale bar = 4μm. (B) Representative light microscopy images of KRT14 (blue) and VAPB (magenta) in A431 WT and DSG2-null cells with regions analyzed by MDA in C (pink box), D (blue box), and E (yellow box) (Images are representative of n=3 independent experiments). Scale bar = 2μm. (C) ER (magenta), MDA-generated ER movement (green), ER at radial keratin filaments (merge) in WT cells. (D) ER (magenta), MDA-generated ER movement (green), ER at non-radial keratin filaments (merge) in WT cells. (E) ER (magenta), MDA-generated ER movement (green), ER at keratin filaments (merge) in DSG2-null cells. Bright green pixels depict ER fraction that is mobile between time points. Scale bar = 500nm (C-E). (F) Violin plot depicting fraction of mobile ER along radial keratin in WT cells (n=125 ROIs), non-radial keratin in WT cells (n=125 ROIs in 25 fields), and keratin filaments in DSG2-null cells (n=178 ROIs in 28 fields). Exact P values are provided for each comparison (two-tailed Mann-Whitney test; n=3 independent experiments). Horizontal solid black lines in violin plots represent medians and dashed lines represent first (lower) and third (upper) quartiles. Dots are color-coded by replicate. Source numerical data are available in source data.
Fig. 8.
Fig. 8.. Keratin aggregation perturbs ER membrane morphology and alterations in keratin or desmosome function cause ER stress.
(A-D) Light microscopy of KRT14WT, VAPB, and plasma membrane in A431 cells showing ER with tubular morphology (Images are representative of n=3 independent experiments). Scale bar = 4μm. (E-H) A431 expressing KRT14R125C aggregates showing ER with sheet-like morphology. PM is labelled with Wheat Germ Agglutinin (WGA) conjugated with a fluorescent dye (Images are representative of n=3 independent experiments). Scale bar = 4μm. (I-K) A431 cells expressing KRT14WT (top and left cells) or KRT14R125C (bottom right cell) showing tubular ER in KRT14WT-expressing cells and sheet-like ER membrane in KRT14R125C-expressing cells (Images are representative of n=3 independent experiments). Red dashed lines indicate PM. Gamma correction was applied to grayscale images. Gamma (inverted) = 1.5 (B, C, F, G, K). Scale bar = 4μm. (L) Fold change in mRNA expression levels of DDIT3, XBP1s, ATF3, and HSPA5 between A431 cells expressing KRT14WT or KRT14R125C. Data are presented as mean values ± s.e.m. Exact P values are provided for each comparison when statistically significant (two-tailed t-test; n=3 independent experiments). (M) Fold change in mRNA expression levels of DDIT3, XBP1s, ATF3, and HSPA5 between primary human keratinocytes treated with either Normal Human IgG or IgG isolated from two different pemphigus vulgaris (PV) patients to disrupt desmosomal adhesion. Data are presented as mean values ± s.e.m. Exact P values are provided for each comparison when statistically significant (two-tailed t-test; n=3 independent experiments). Source numerical data are available in source data.

Comment in

References

    1. Wu H, Carvalho P, Voeltz GK, Here, there, and everywhere: The importance of ER membrane contact sites. Science (1979) 361, eaan5835 (2018). - PMC - PubMed
    1. Schwarz DS, Blower MD, The endoplasmic reticulum: structure, function and response to cellular signaling. Cell Mol Life Sci 73, 79–94 (2016). - PMC - PubMed
    1. Prinz WA, Toulmay A, Balla T, The functional universe of membrane contact sites. Nat Rev Mol Cell Biol 21, 7–24 (2020). - PMC - PubMed
    1. Cohen S, Valm AM, Lippincott-Schwartz J, Interacting organelles. Curr Opin Cell Biol 53, 84–91 (2018). - PMC - PubMed
    1. Perkins HT, Allan V, Intertwined and Finely Balanced: Endoplasmic Reticulum Morphology, Dynamics, Function, and Diseases. Cells 10 (2021), doi:10.3390/cells10092341. - DOI - PMC - PubMed

Publication types

MeSH terms