. 2023 Jun 8;13(1):9298.
doi: 10.1038/s41598-023-36513-6.

Buckling critical pressures in collapsible tubes relevant for biomedical flows

Affiliations

Buckling critical pressures in collapsible tubes relevant for biomedical flows

Marco Laudato et al. Sci Rep. .

Abstract

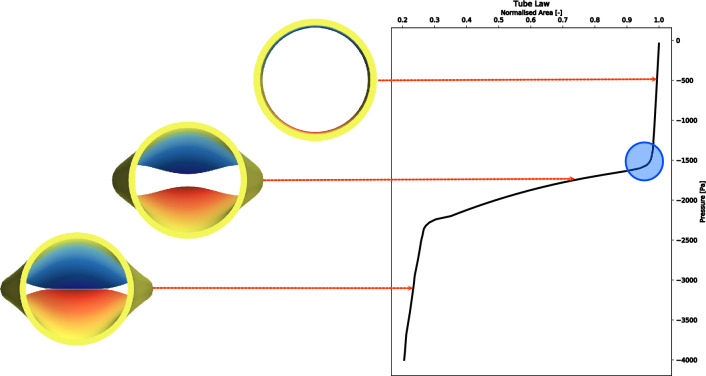
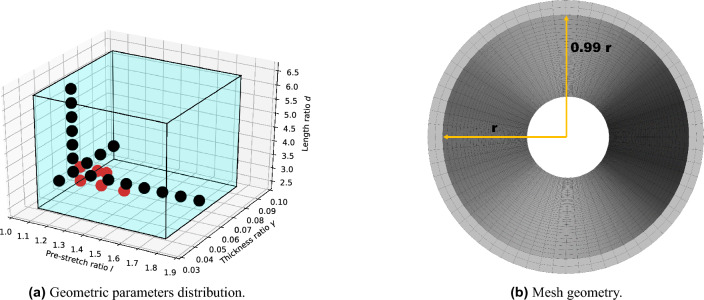
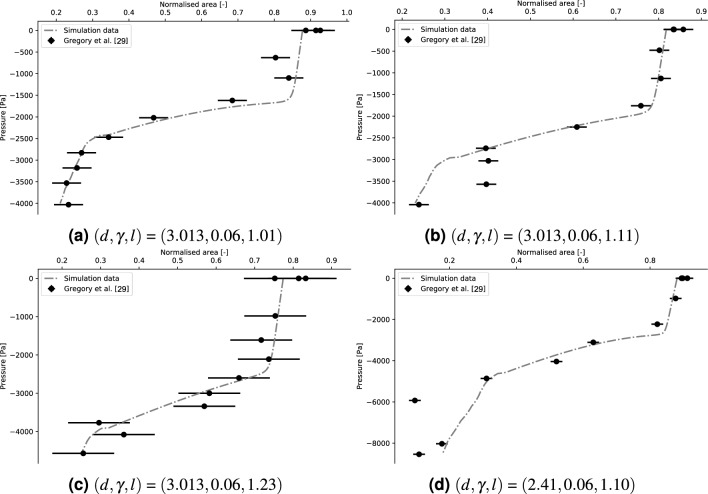
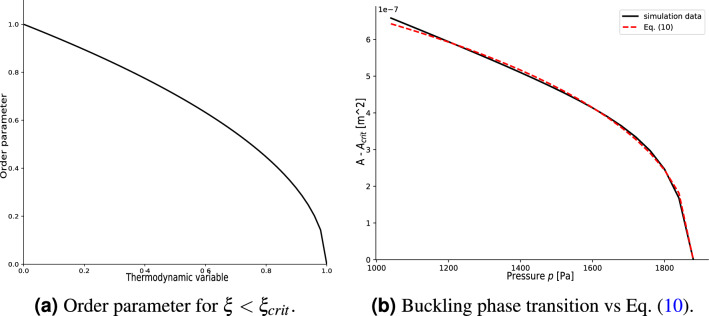
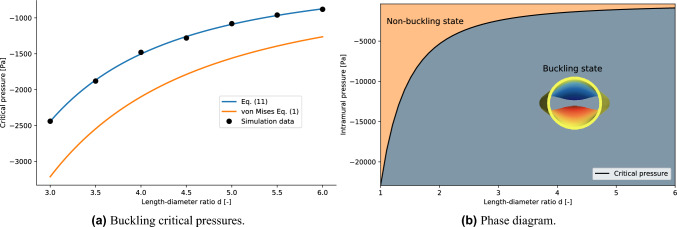
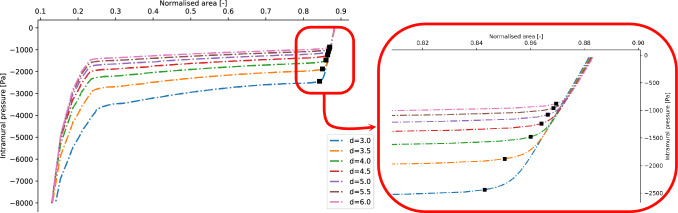
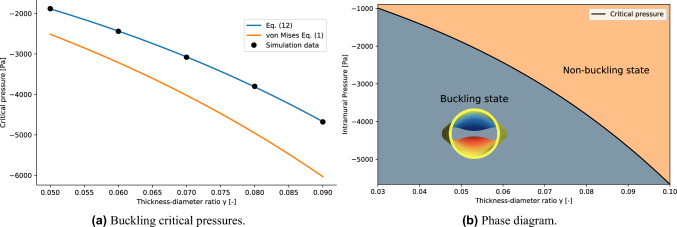
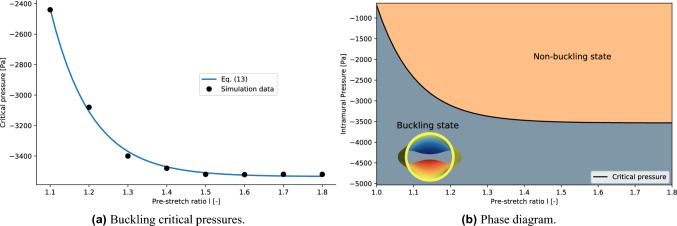
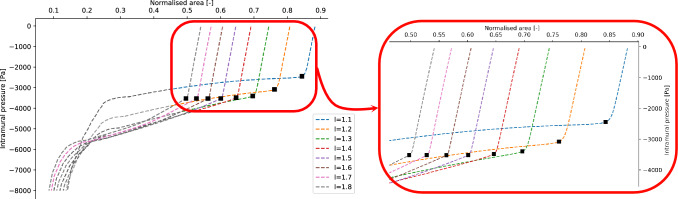
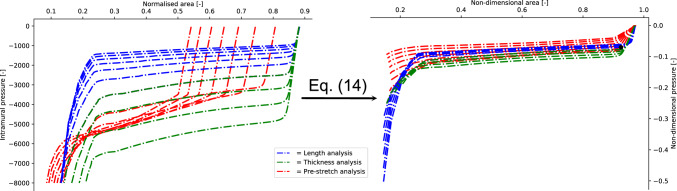
The behaviour of collapsed or stenotic vessels in the human body can be studied by means of simplified geometries like a collapsible tube. The objective of this work is to determine the value of the buckling critical pressure of a collapsible tube by employing Landau's theory of phase transition. The methodology is based on the implementation of an experimentally validated 3D numerical model of a collapsible tube. The buckling critical pressure is estimated for different values of geometric parameters of the system by treating the relation between the intramural pressure and the area of the central cross-section as the order parameter function of the system. The results show the dependence of the buckling critical pressures on the geometric parameters of a collapsible tube. General non-dimensional equations for the buckling critical pressures are derived. The advantage of this method is that it does not require any geometric assumption, but it is solely based on the observation that the buckling of a collapsible tube can be treated as a second-order phase transition. The investigated geometric and elastic parameters are sensible for biomedical application, with particular interest to the study of the bronchial tree under pathophysiological conditions like asthma.


Conflict of interest statement

The authors declare no competing interests.

Figures

Figure 1
Figure 1
An example of tube law (on the right). The blue circle indicates the region where the buckling transitions occurs. On the left, the cross-sections relative to the pre-buckling, post-buckling, and post-contact regime are presented. The area is normalised on the of the central cross-section corresponding to the rest configuration.
Figure 2
Figure 2
(Left panel) Distribution of the geometric parameters values investigated in this work. The black dots are relative to the simulations, while the red dots refers to the experimental data from Gregory et al.. The blue box represents the space of possible values admitted in the models by Horsfield and Hoppin. (Right panel) Sketch of the mesh employed in the numerical simulations. To control the direction of the buckling, the radial cross section of the tube is an ellipse with minor axis aligned with the vertical direction and long 0.99r.
Figure 3
Figure 3
Mesh sensitivity analysis of the numerical model.
Figure 4
Figure 4
(Left panel) Analysis of the dependence of the model on the external pressure ramp. (Right panel) Comparison of the tube laws obtained by employing linear elasticity and Neo-Hookean elasticity model.
Figure 5
Figure 5
Validation of the numerical model by comparison with experimental data, . To estimate the error bars, the initial area is measured 3 times. The length of the error bars is equal to the absolute difference between the corresponding maximum and minimum values.
Figure 6
Figure 6
(Left panel) Plot of Eq. (9) for ξcrit=1 and ξ<ξcrit. (Right panel) Detail of the pre-processed buckling transition region in the tube law fit with Eq. (10). The analogy between the two plots endorses the validity of the hypothesis.
Figure 7
Figure 7
(Left panel) Comparison between the simulation data fit with Eq. (11) and the von Mises equation. (Right panel) Phase diagram for the buckling phase transition in terms of the length-diameter ratio d.
Figure 8
Figure 8
Tube laws obtained by spanning the value of the length-diameter ratio d. The black dots represent the value of the buckling critical pressures and the corresponding areas estimated for the different tube laws.
Figure 9
Figure 9
(Left panel) Comparison between the simulation data fit with Eq. (12) and the von Mises equation. (Right panel) Phase diagram for the buckling phase transition in terms of the thickness-diameter ratio γ.
Figure 10
Figure 10
Tube laws obtained by spanning the value of the thickness-diameter ratio γ. The black dots represent the value of the buckling critical pressures and the corresponding areas estimated for the different tube laws.
Figure 11
Figure 11
(Left panel) Comparison between the simulation data and Eq. (13). (Right panel) Phase diagram for the buckling phase transition in terms of the pre-stretch ratio l.
Figure 12
Figure 12
Tube laws obtained by spanning the value of the pre-stretch ratio l. The black dots represent the value of the buckling critical pressures and the corresponding areas estimated for the different tube laws.
Figure 13
Figure 13
(Left panel) The set of tube laws analysed in this work. (Right panel) The corresponding non-dimensional tube laws obtained by the transformation in Eq. (14). The plots almost collapse in a single line. The black dot indicates the average values of the non-dimensional buckling critical pressure and the corresponding area as in Eq. (16).

References

    1. Candreva A, et al. Current and future applications of computational fluid dynamics in coronary artery disease. Rev. Cardiovasc. Med. 2022;23:377. doi: 10.31083/j.rcm2311377. - DOI - PMC - PubMed
    1. Mylavarapu G, et al. Validation of computational fluid dynamics methodology used for human upper airway flow simulations. J. Biomech. 2009;42:1553–1559. doi: 10.1016/j.jbiomech.2009.03.035. - DOI - PubMed
    1. Mihaescu M, et al. Modeling flow in a compromised pediatric airway breathing air and heliox. Laryngoscope. 2008;118:2205–2211. doi: 10.1097/MLG.0b013e3181856051. - DOI - PubMed
    1. Schickhofer L, Malinen J, Mihaescu M. Compressible flow simulations of voiced speech using rigid vocal tract geometries acquired by MRI. J. Acoust. Soc. Am. 2019;145:2049–2061. doi: 10.1121/1.5095250. - DOI - PubMed
    1. Achey R, Thiyagarajah N, Rashidi K, Rashidi M, Moore NZ. Computational fluid–structure interactions in the human cerebrovascular system: Part 2—A review of current applications of computational fluid dynamics and structural mechanics in cerebrovascular pathophysiology. J. Eng. Sci. Med. Diagn. Ther. 2022;5:030802.

Publication types