. 2023 Jul;26(7):1196-1207.
doi: 10.1038/s41593-023-01355-y. Epub 2023 Jun 8.

Identification of a protective microglial state mediated by miR-155 and interferon-γ signaling in a mouse model of Alzheimer's disease

Affiliations

Identification of a protective microglial state mediated by miR-155 and interferon-γ signaling in a mouse model of Alzheimer's disease

Zhuoran Yin et al. Nat Neurosci. 2023 Jul.

Abstract

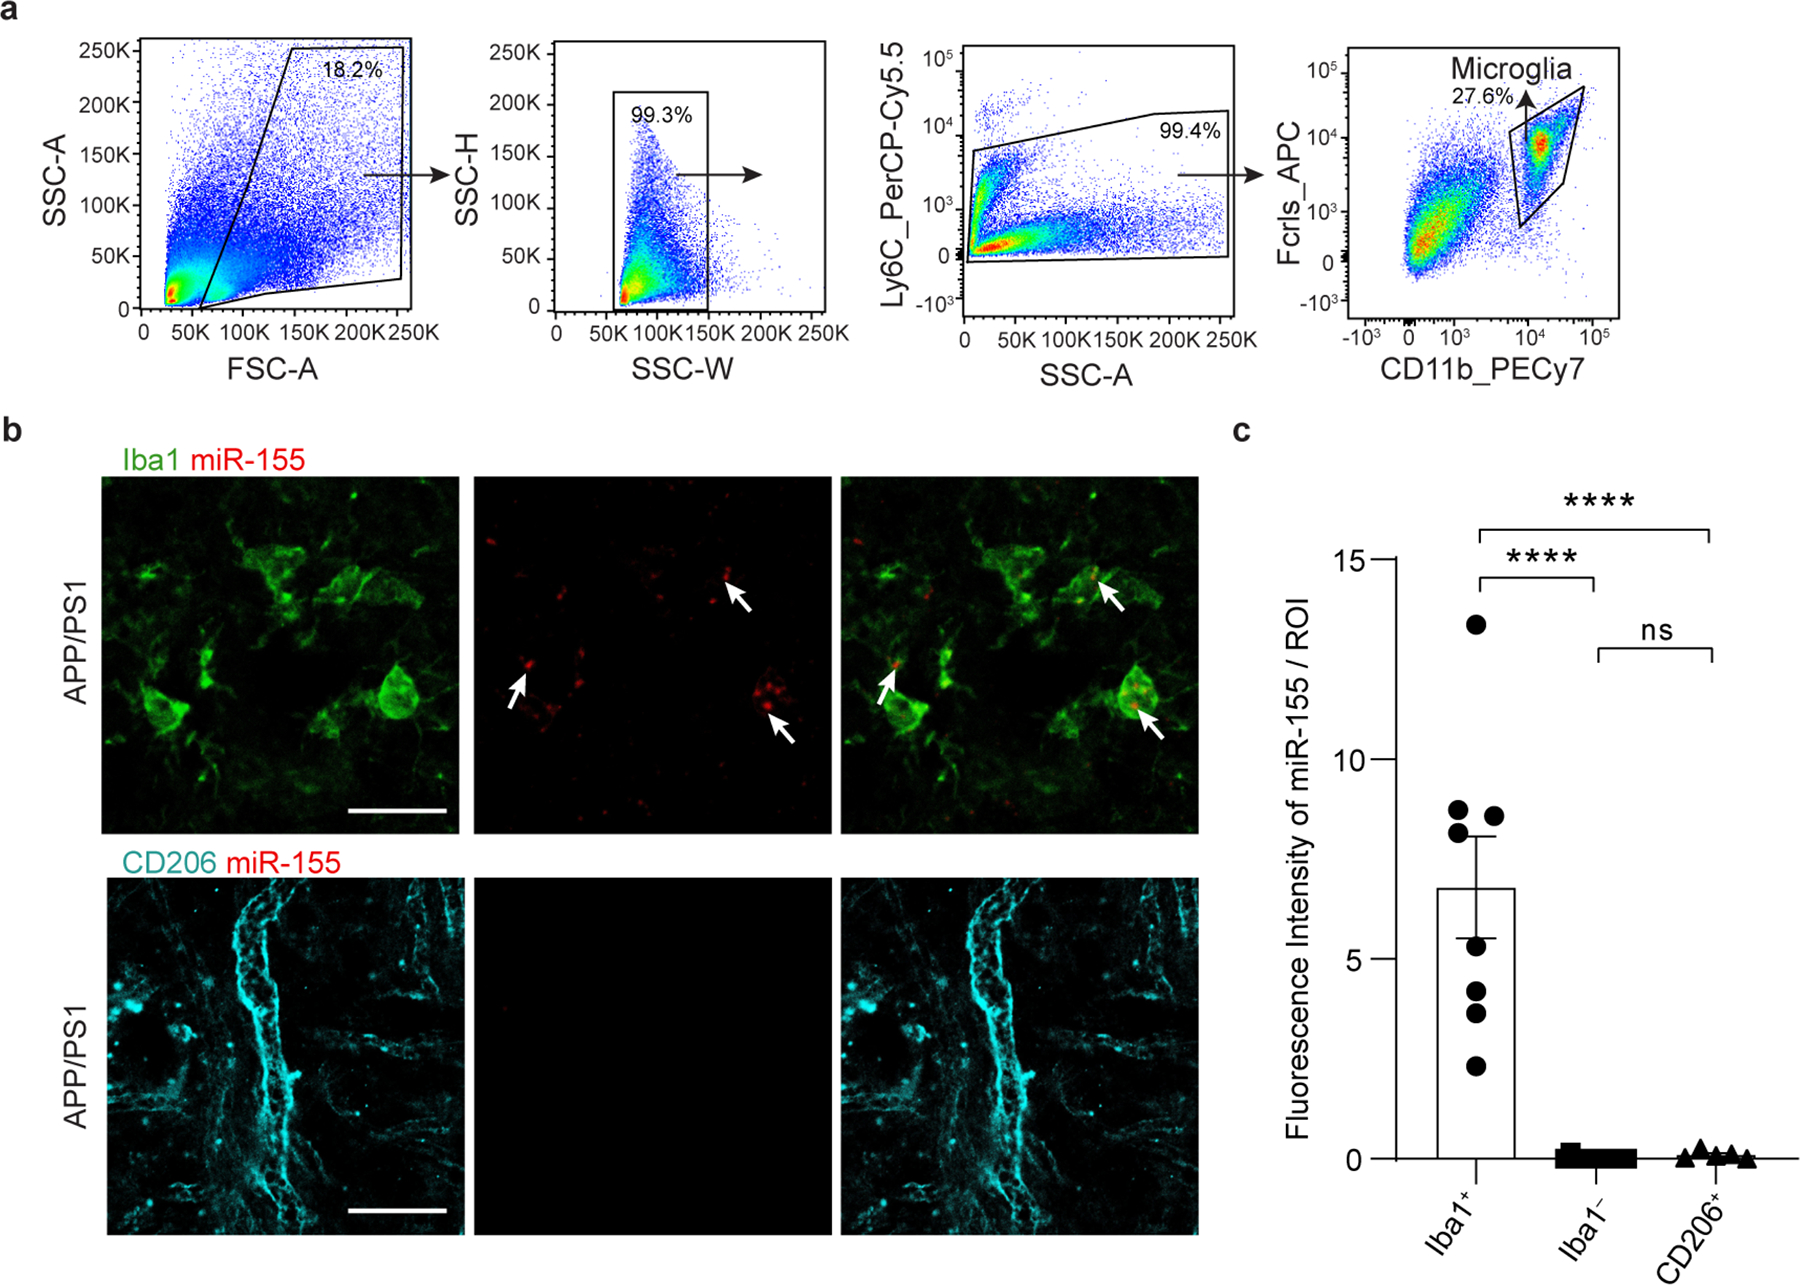
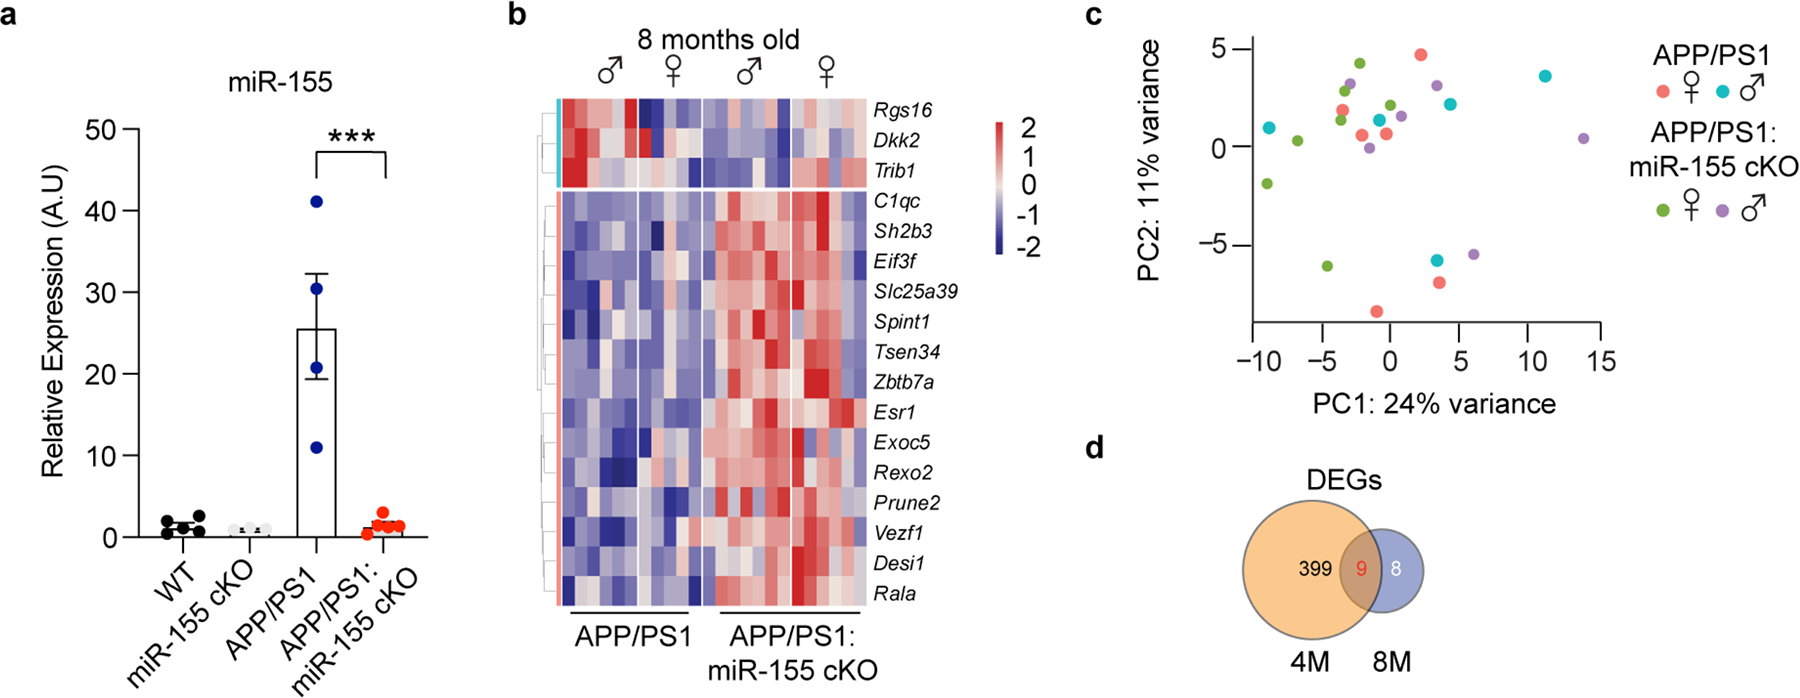
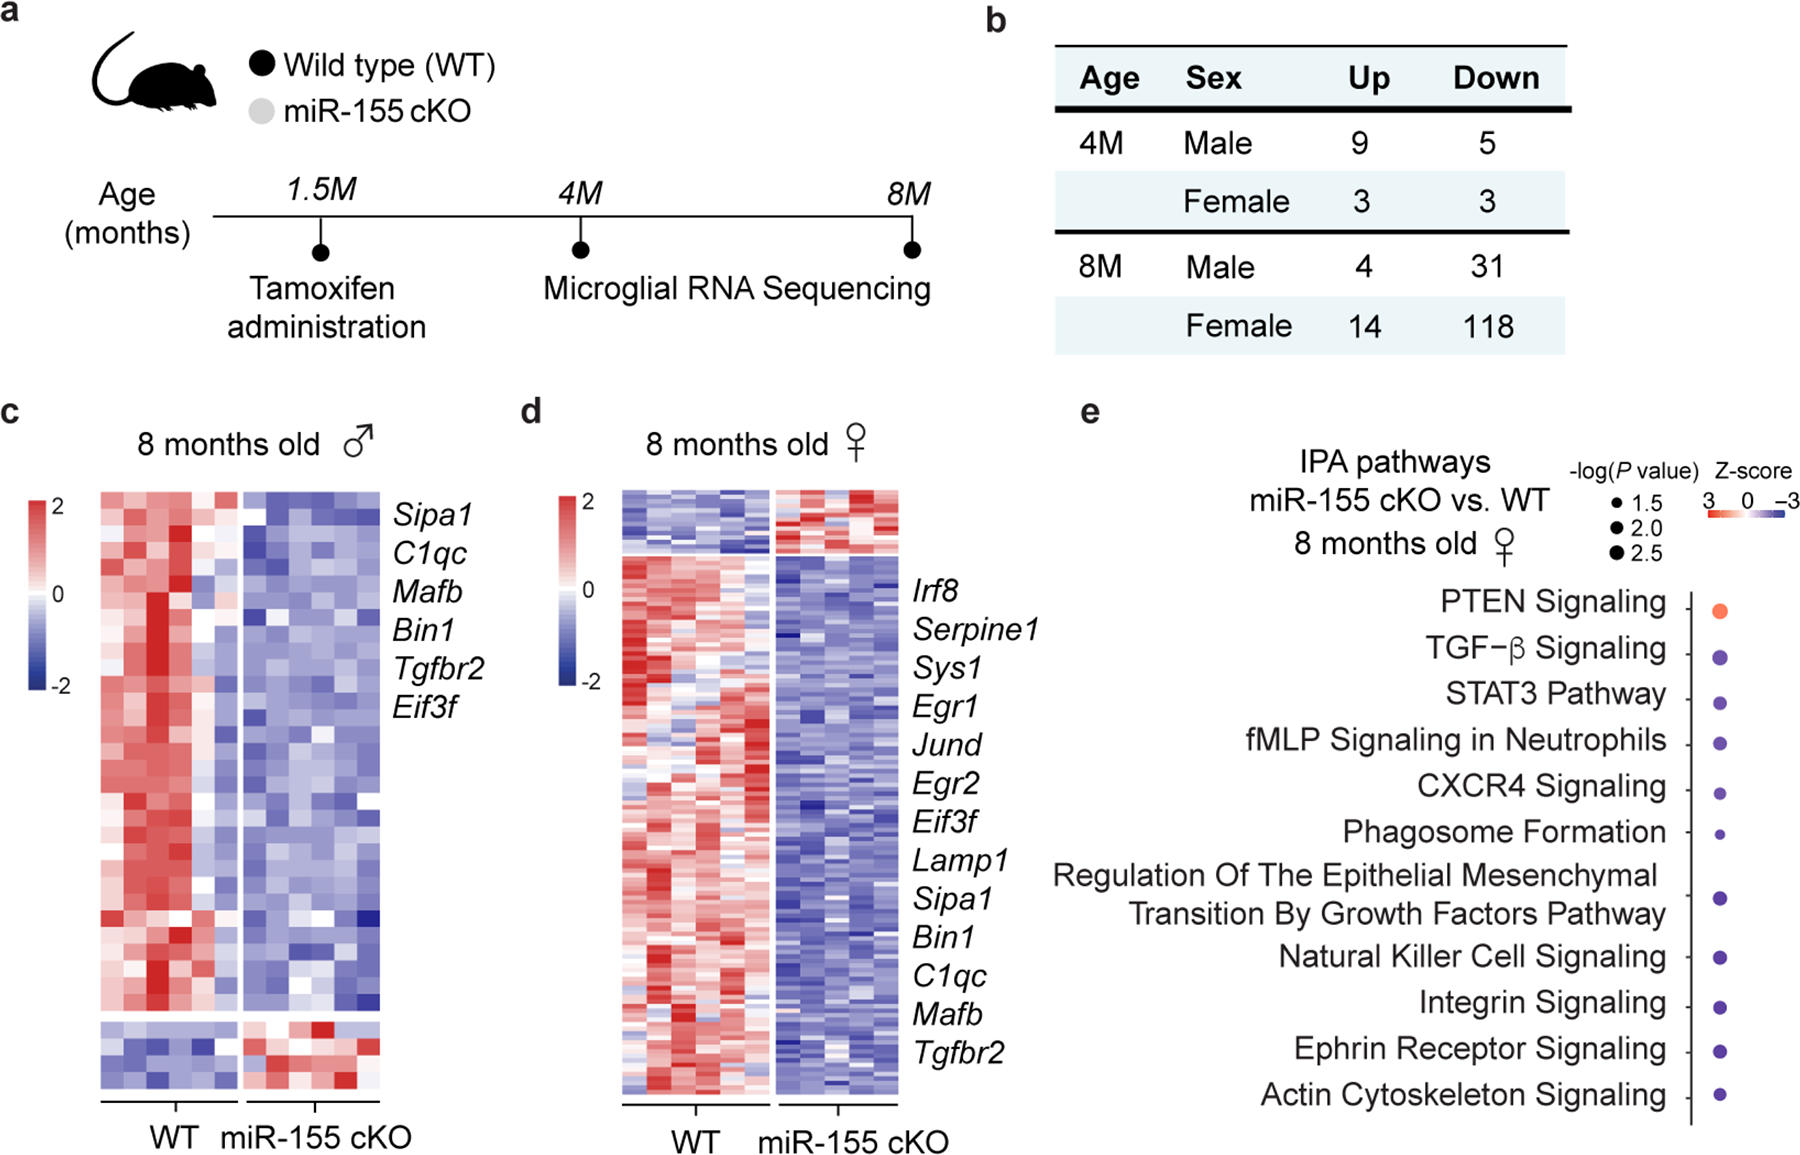
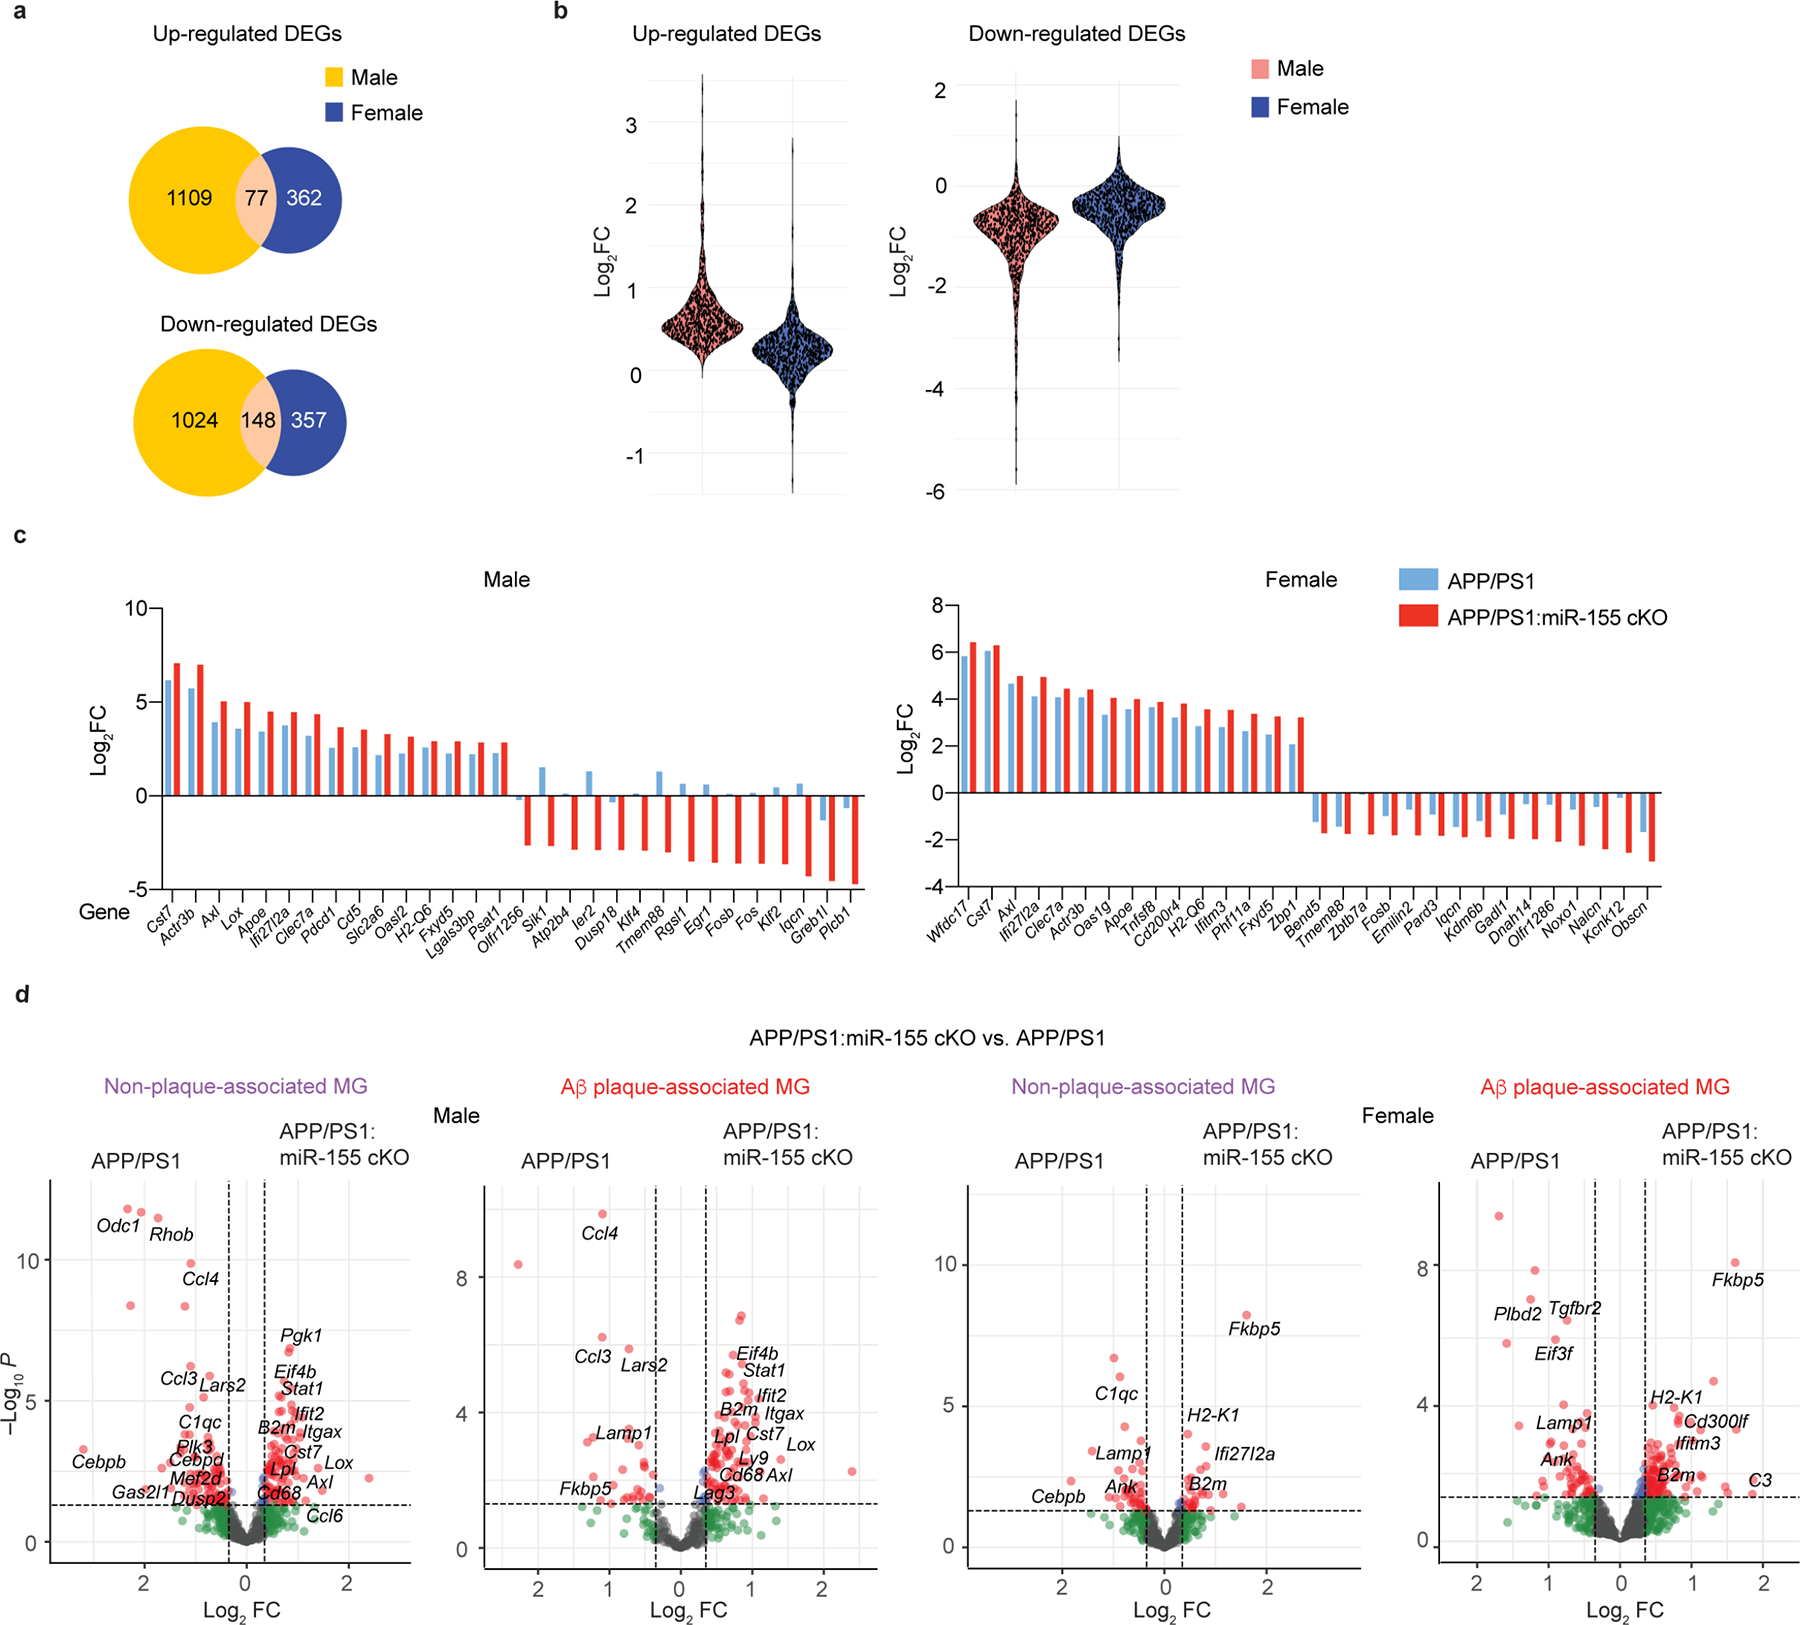
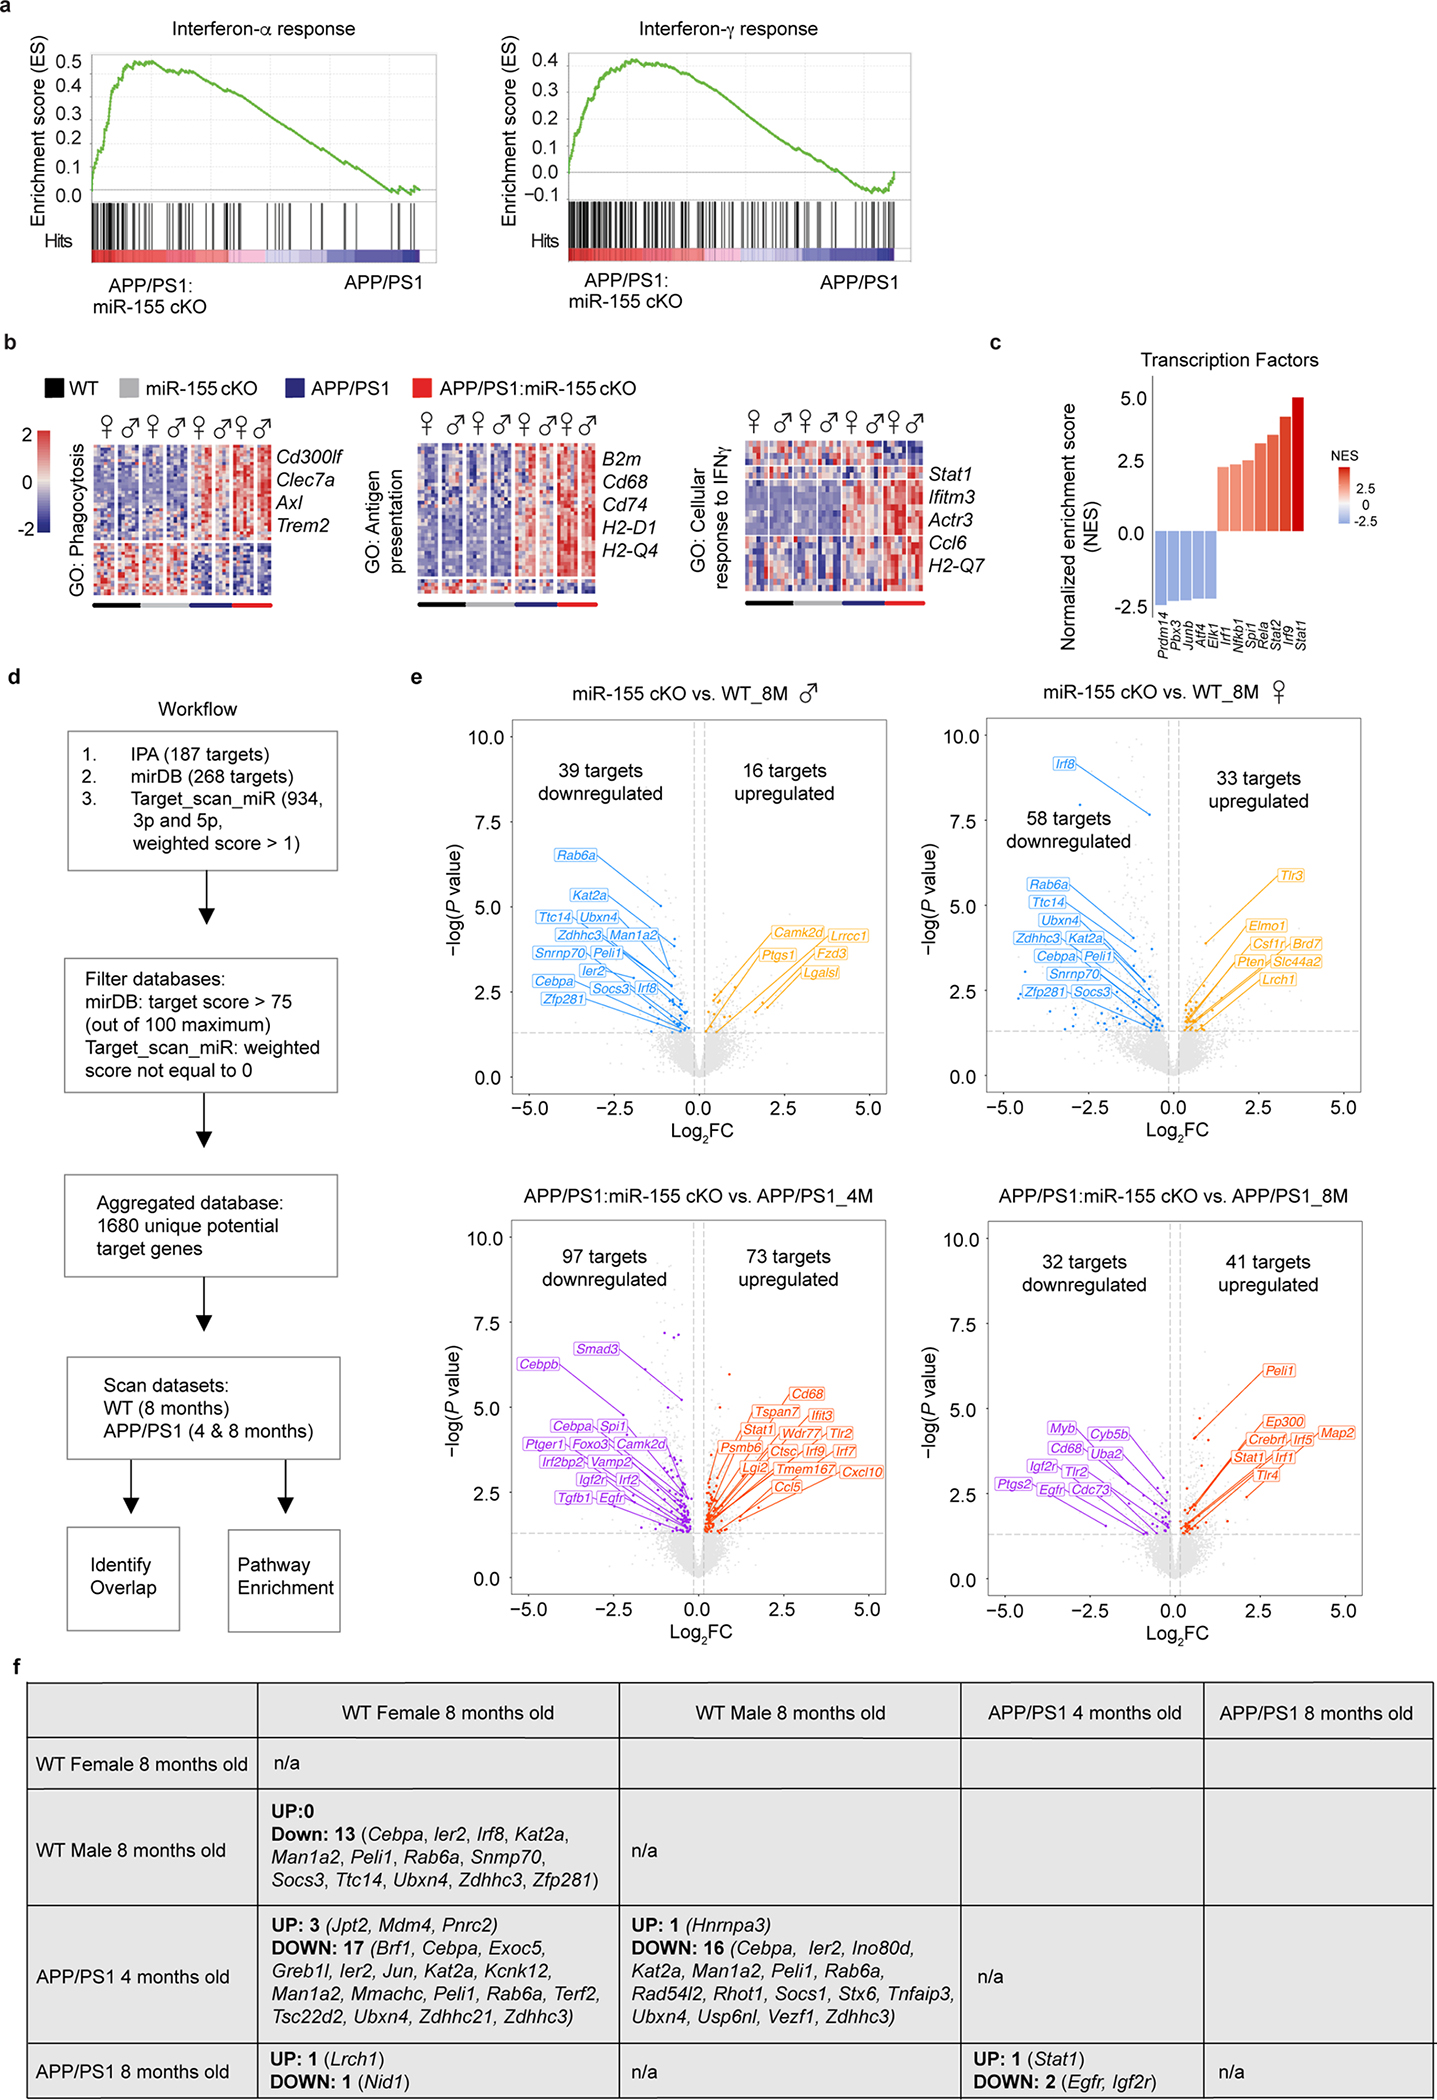
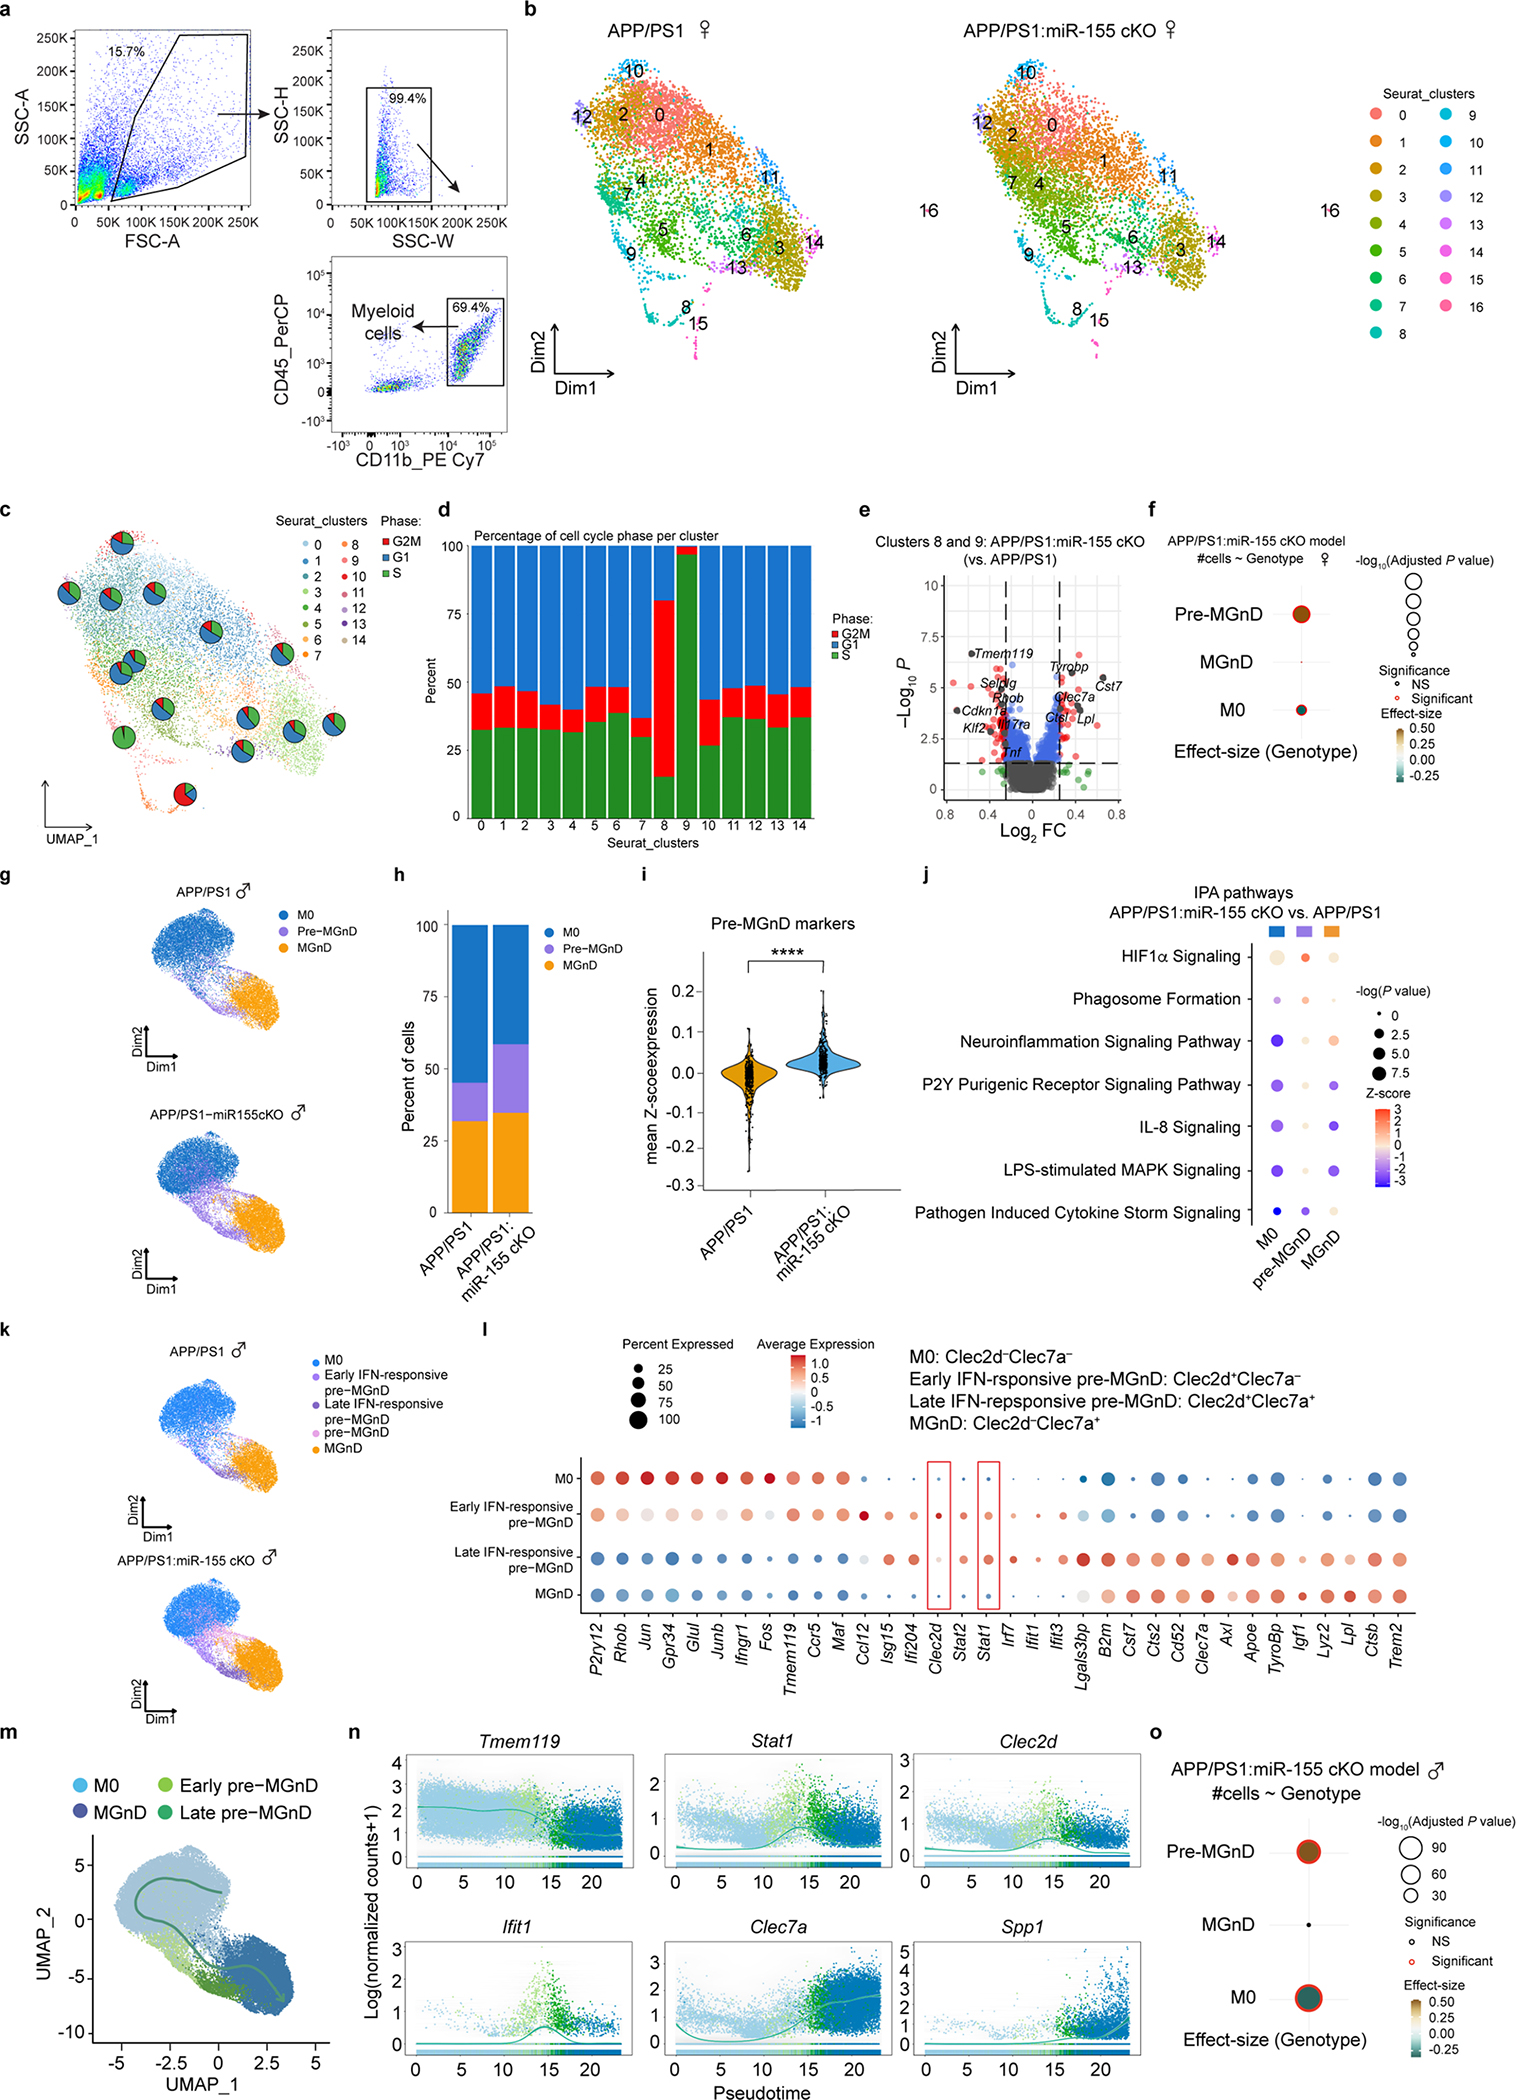
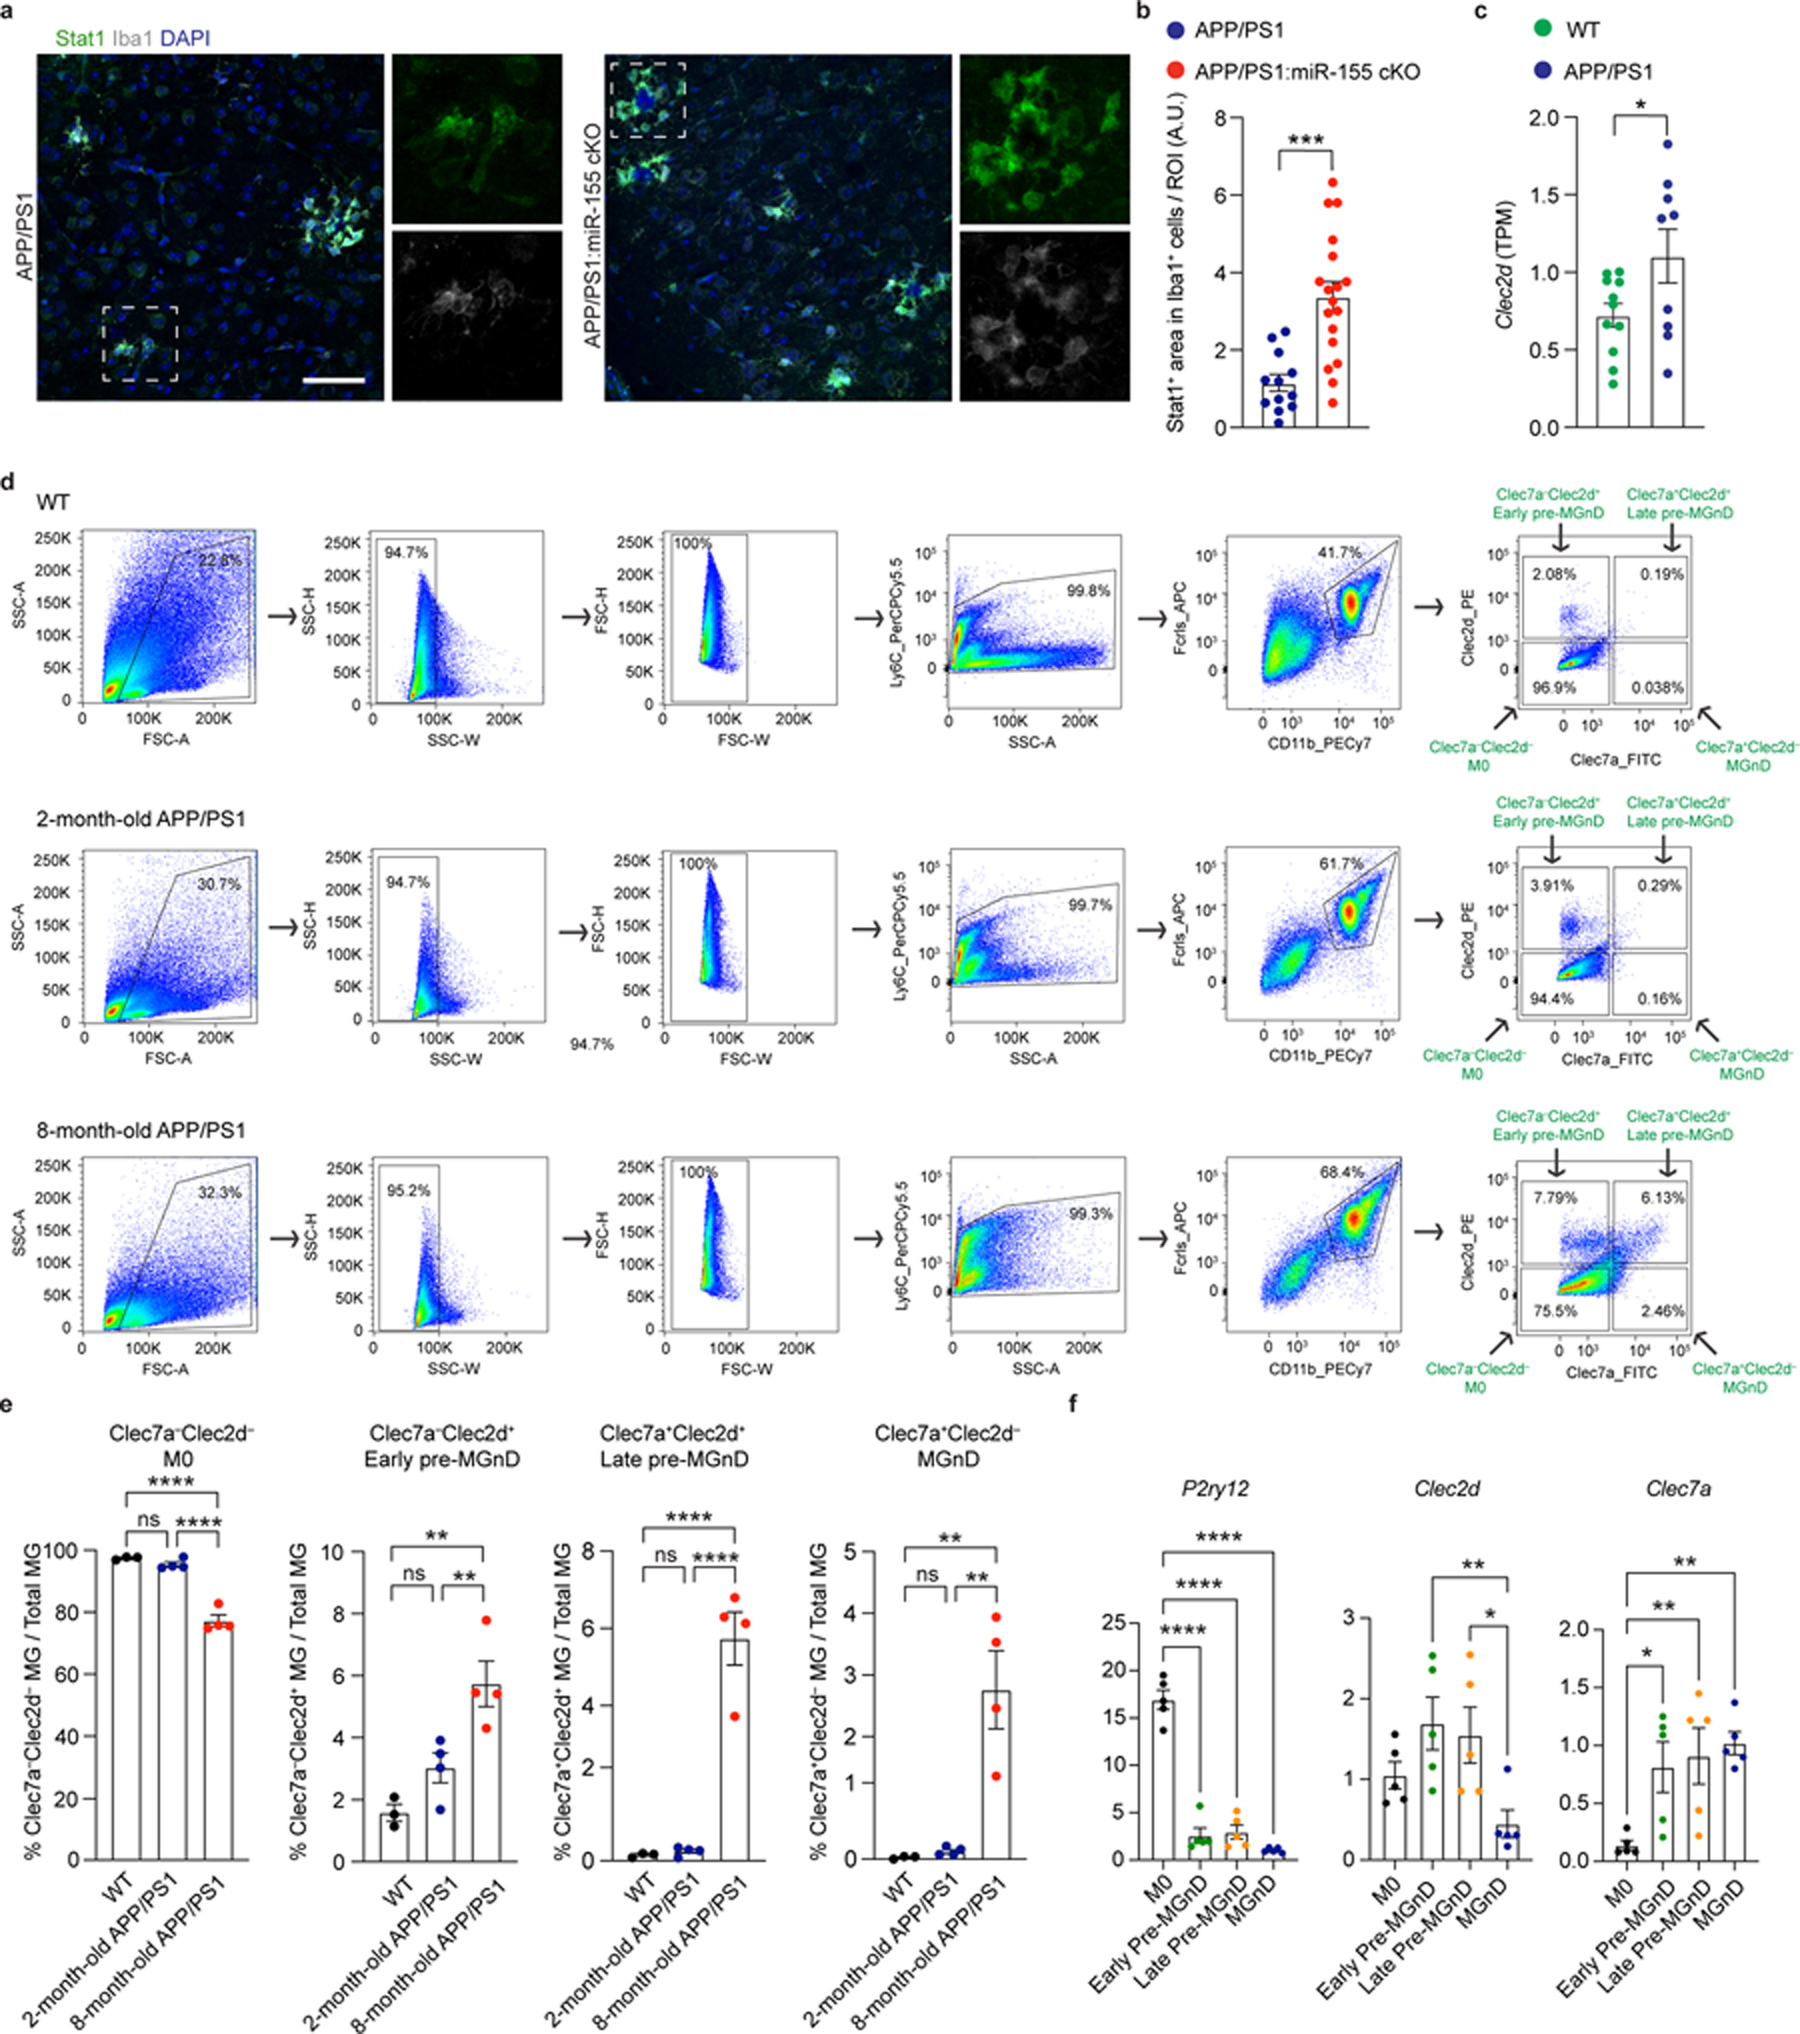
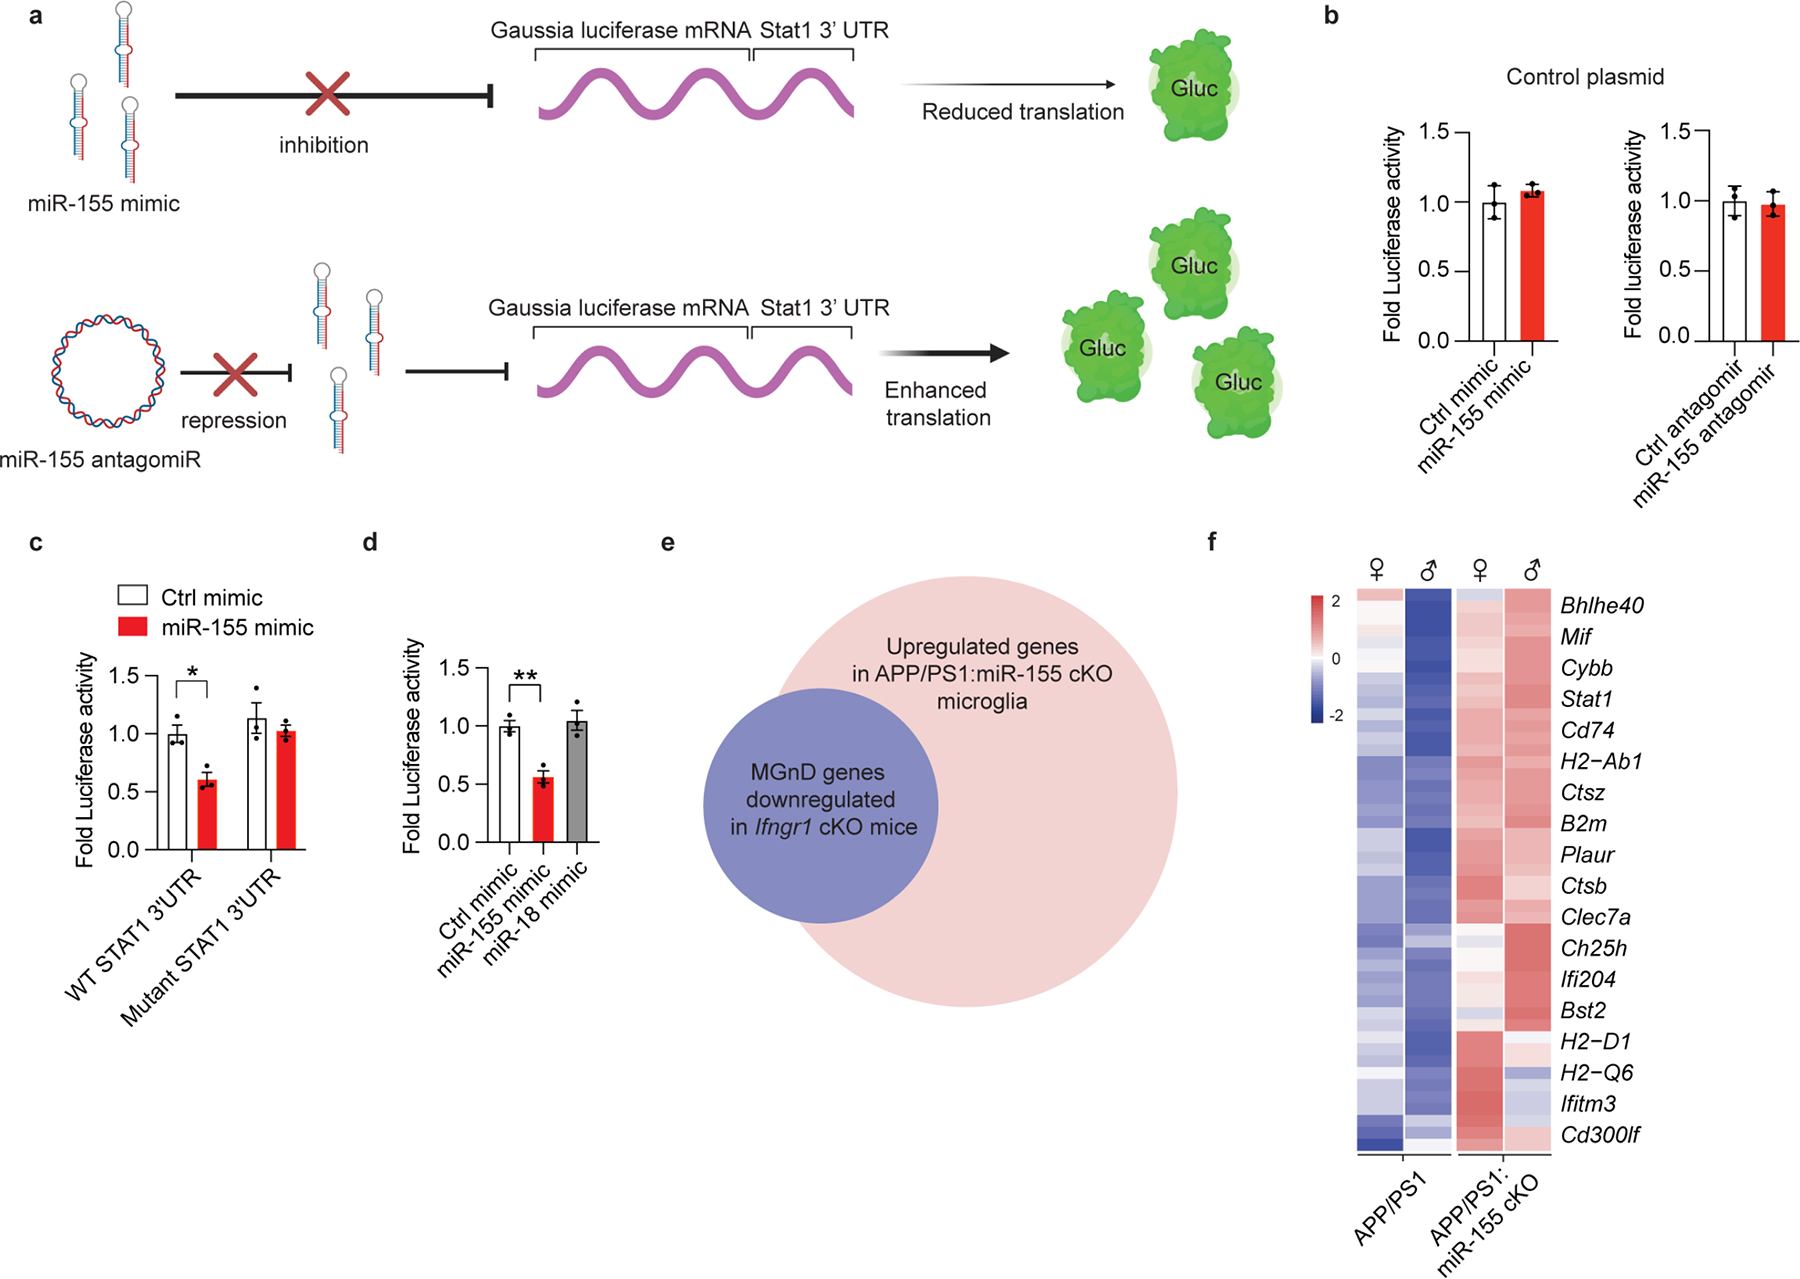
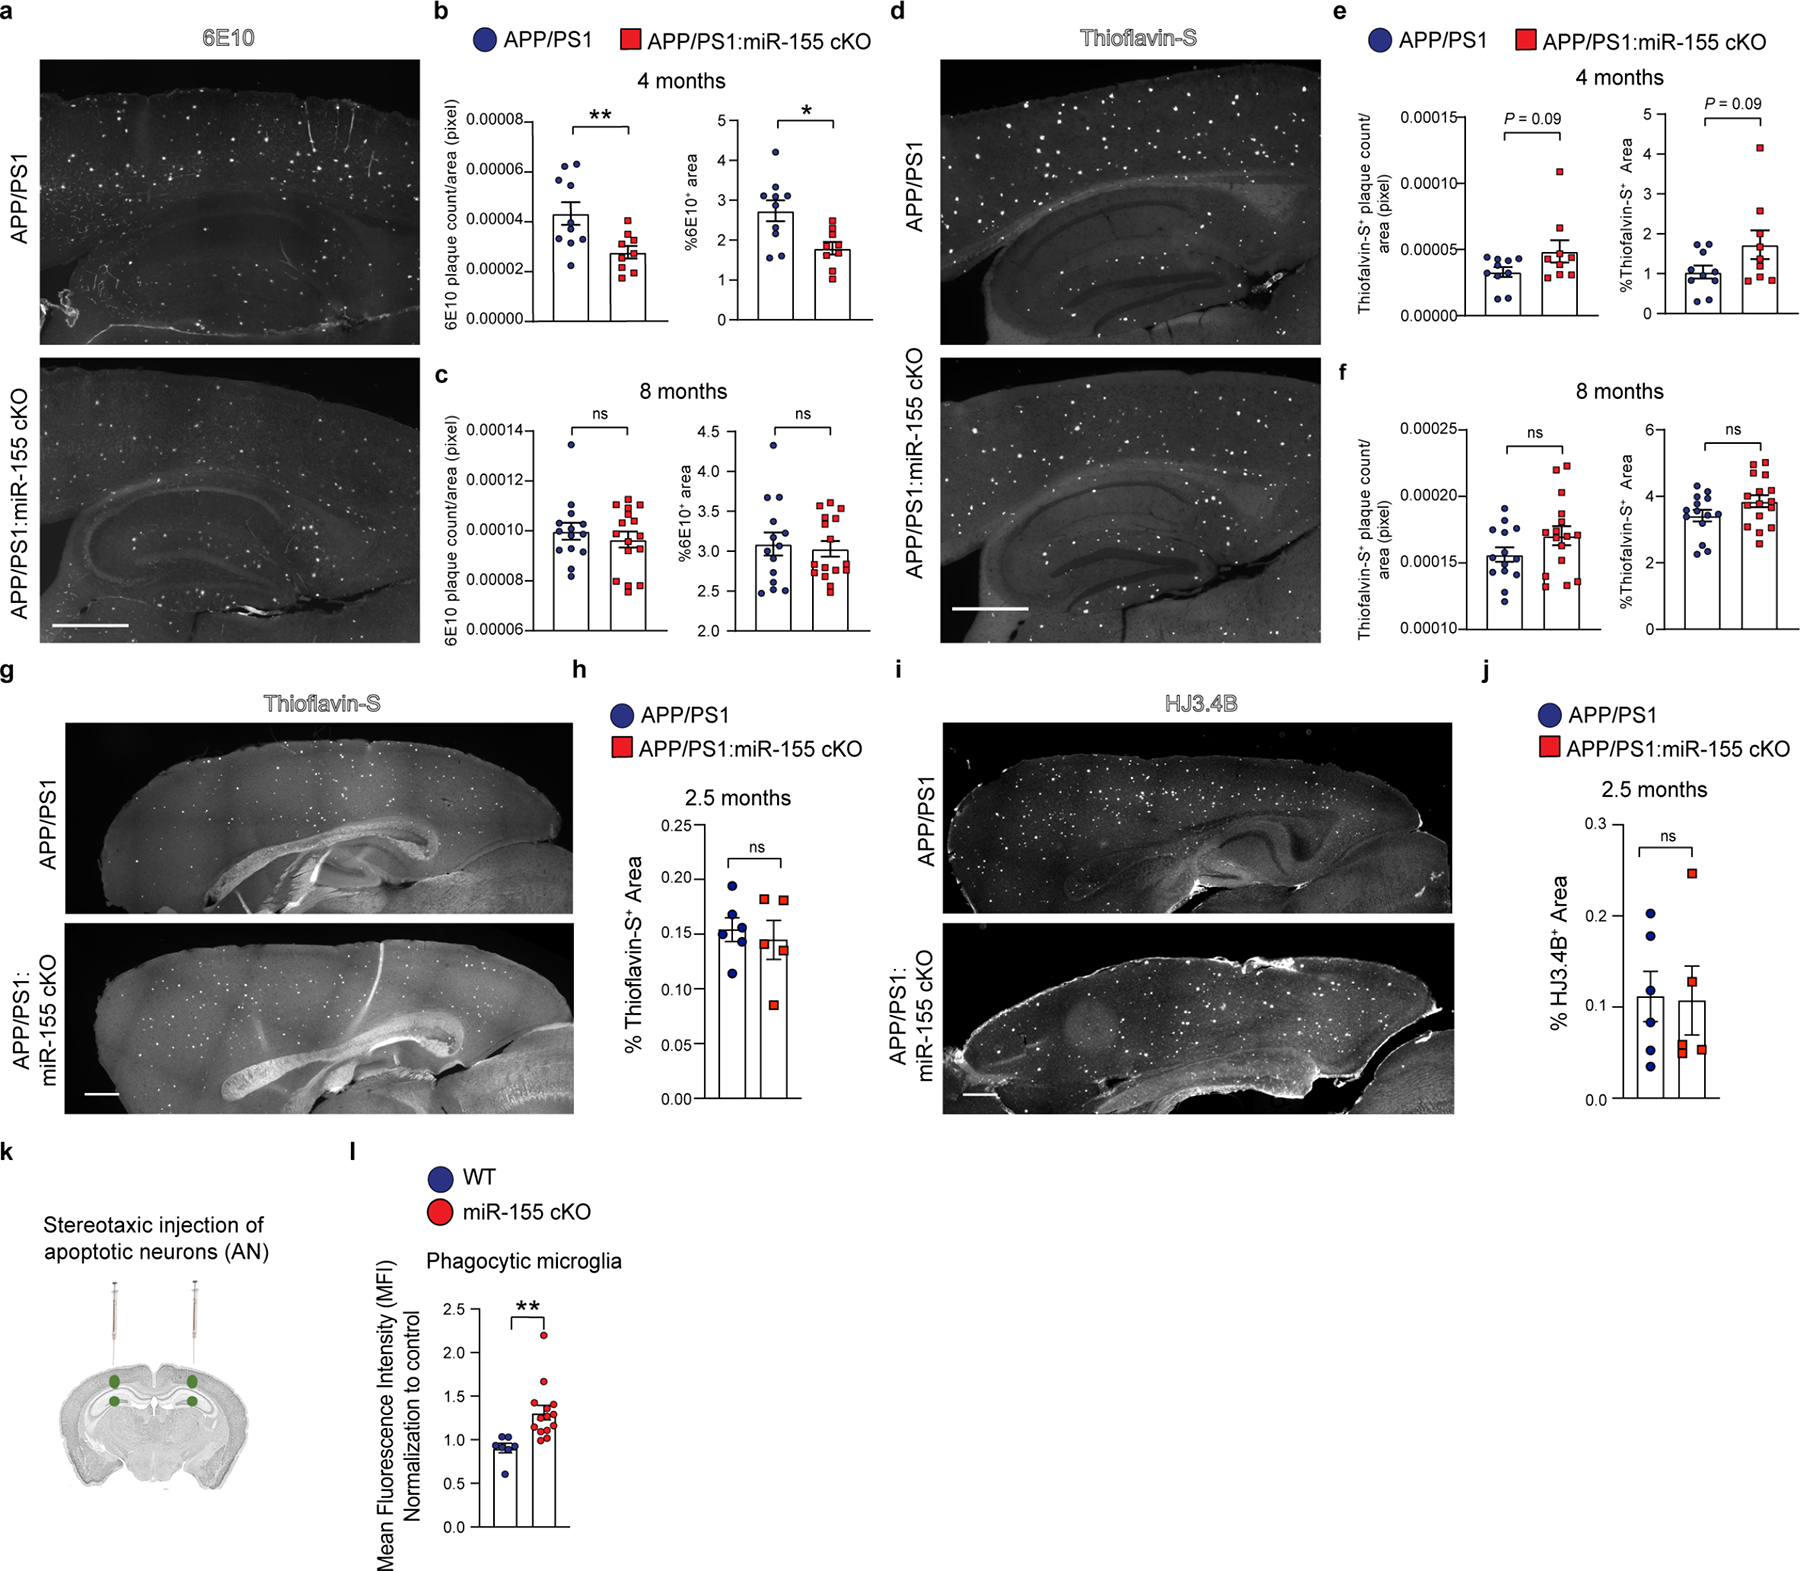
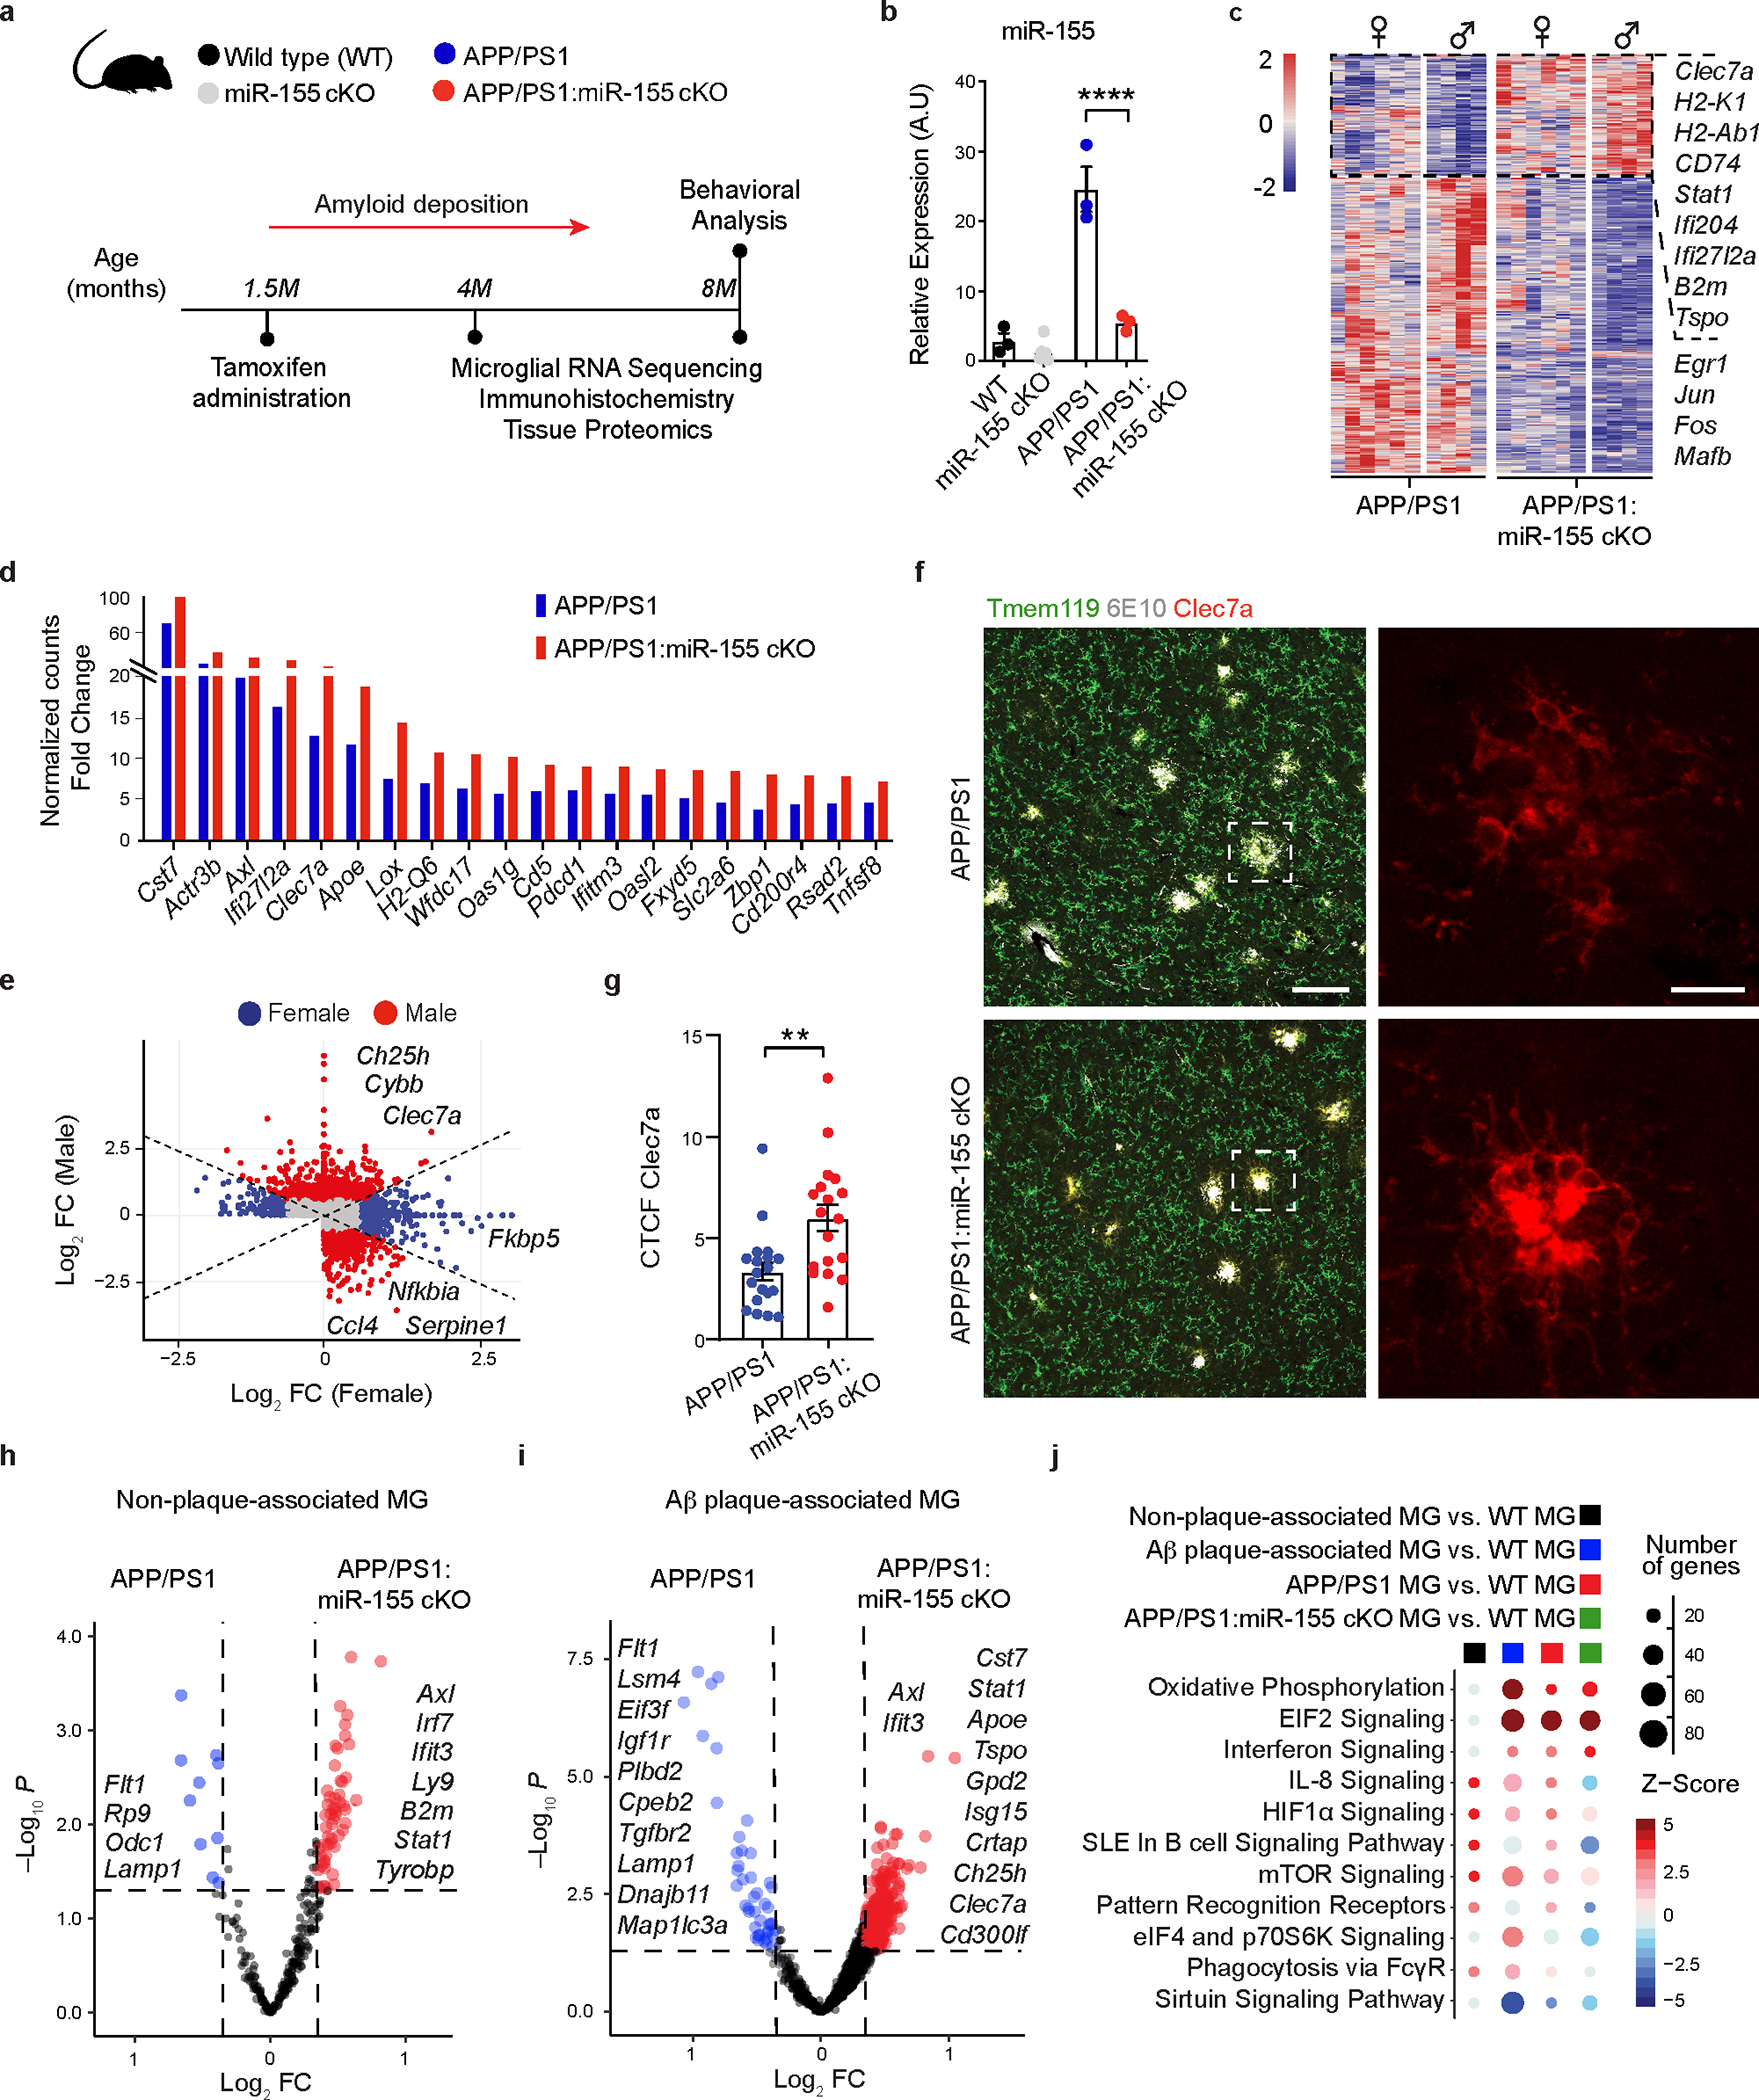
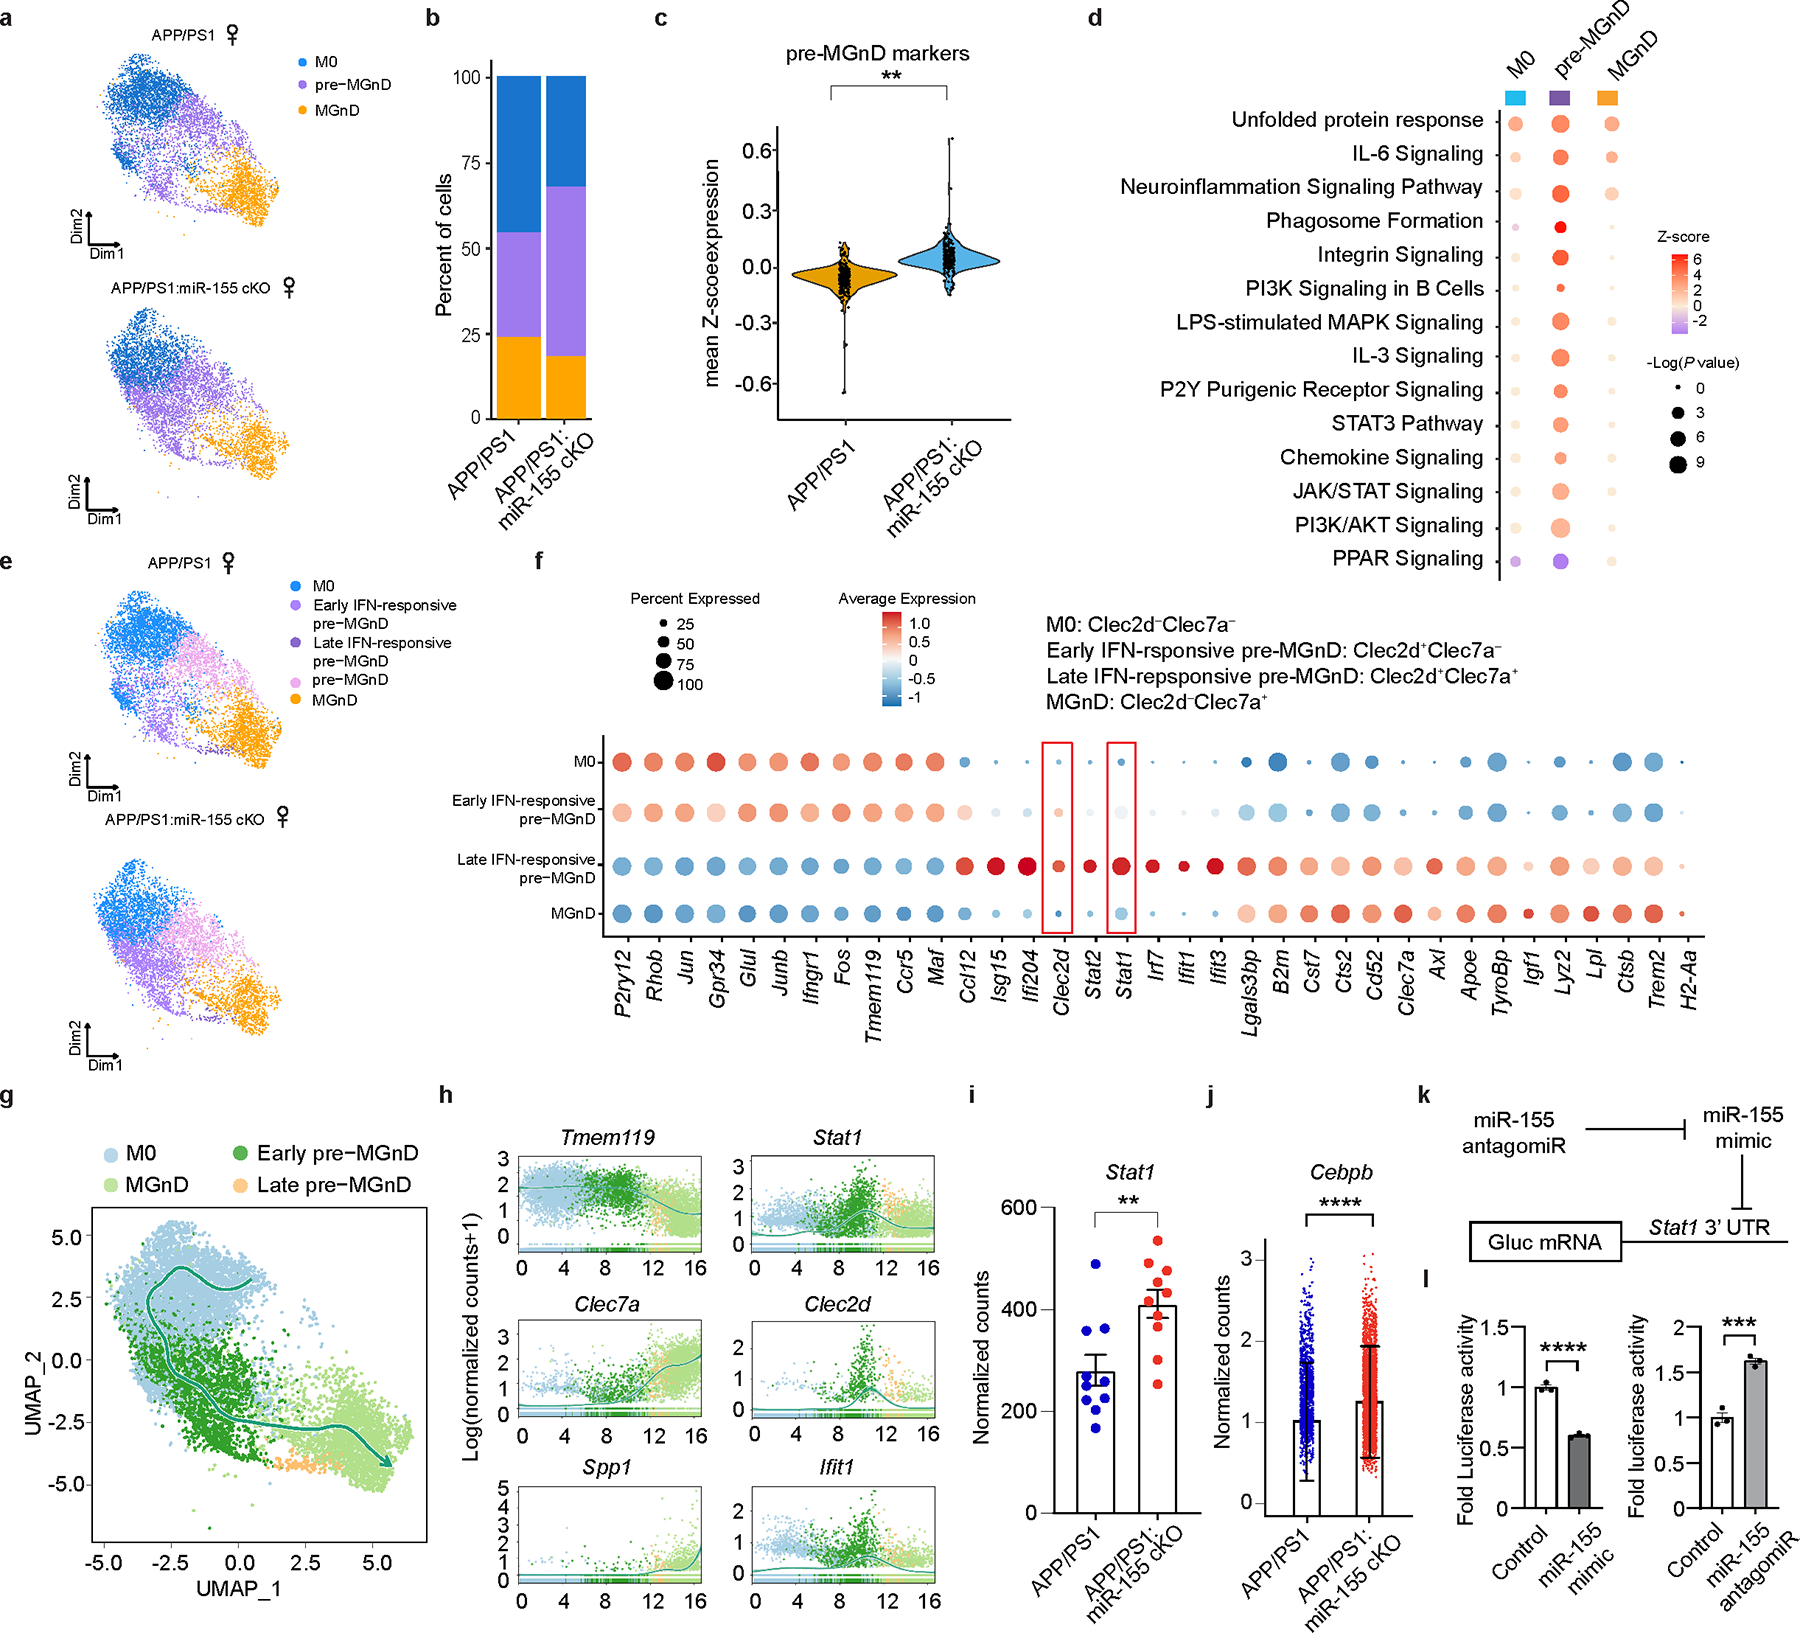
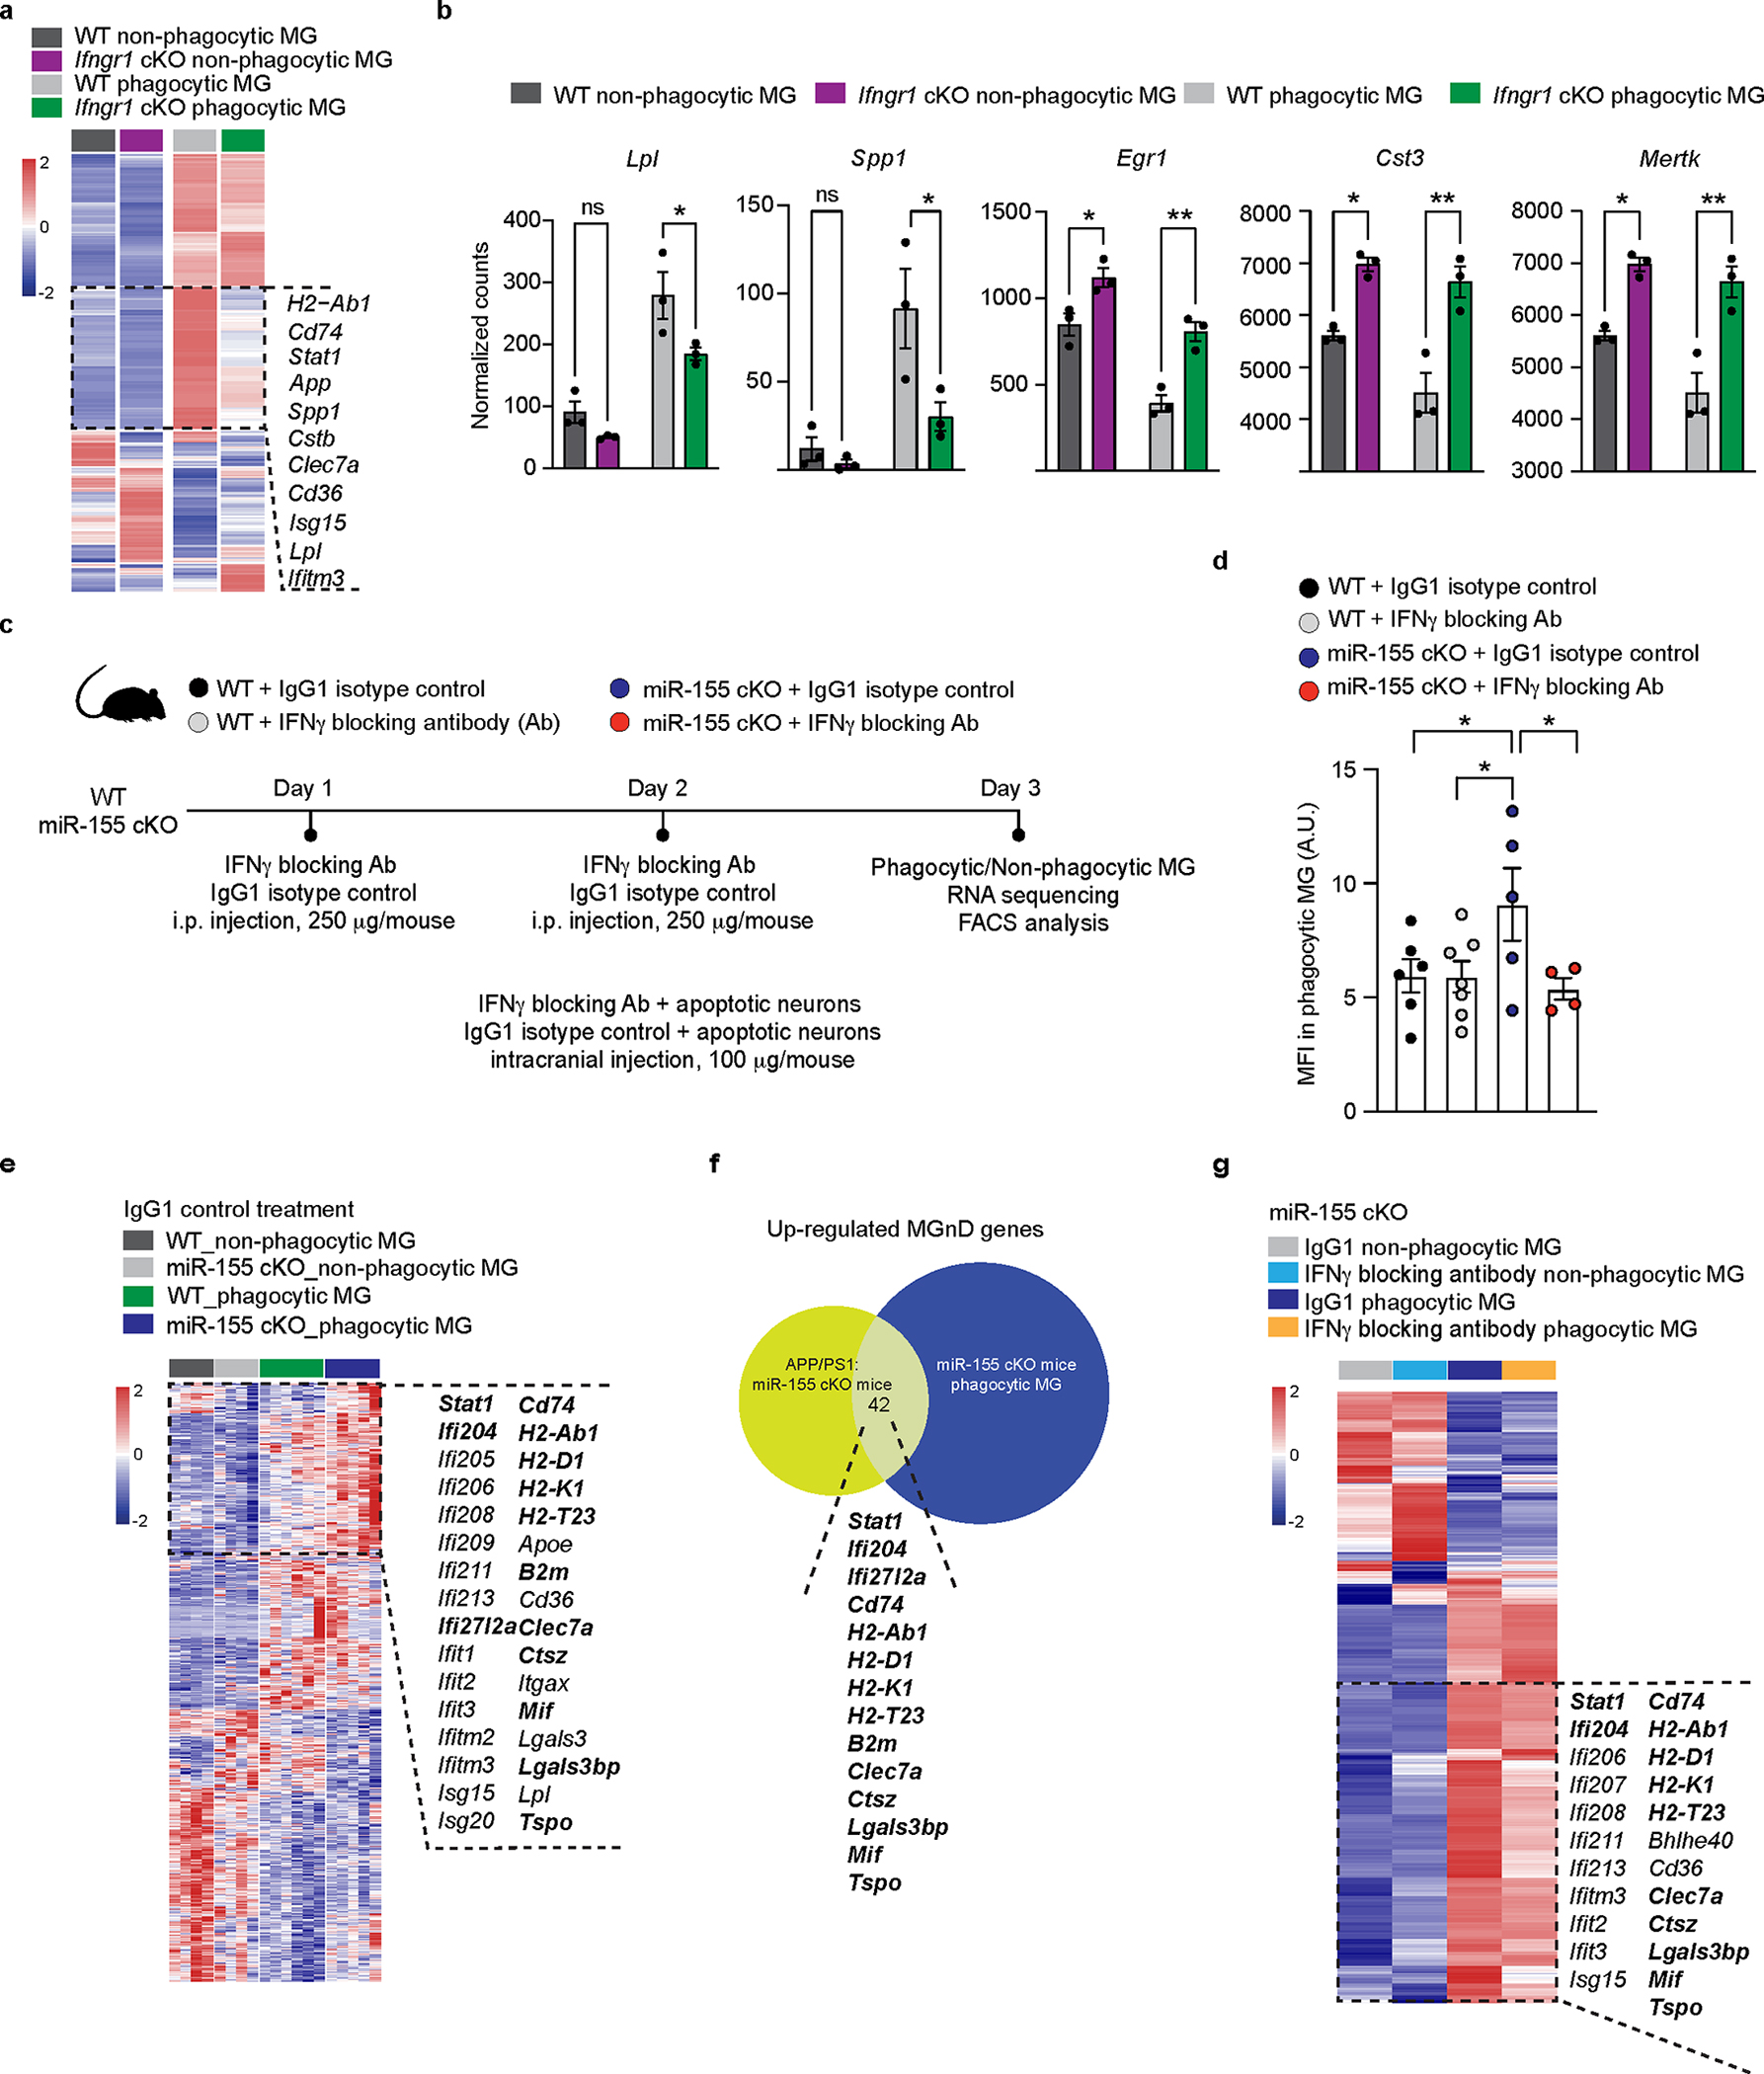
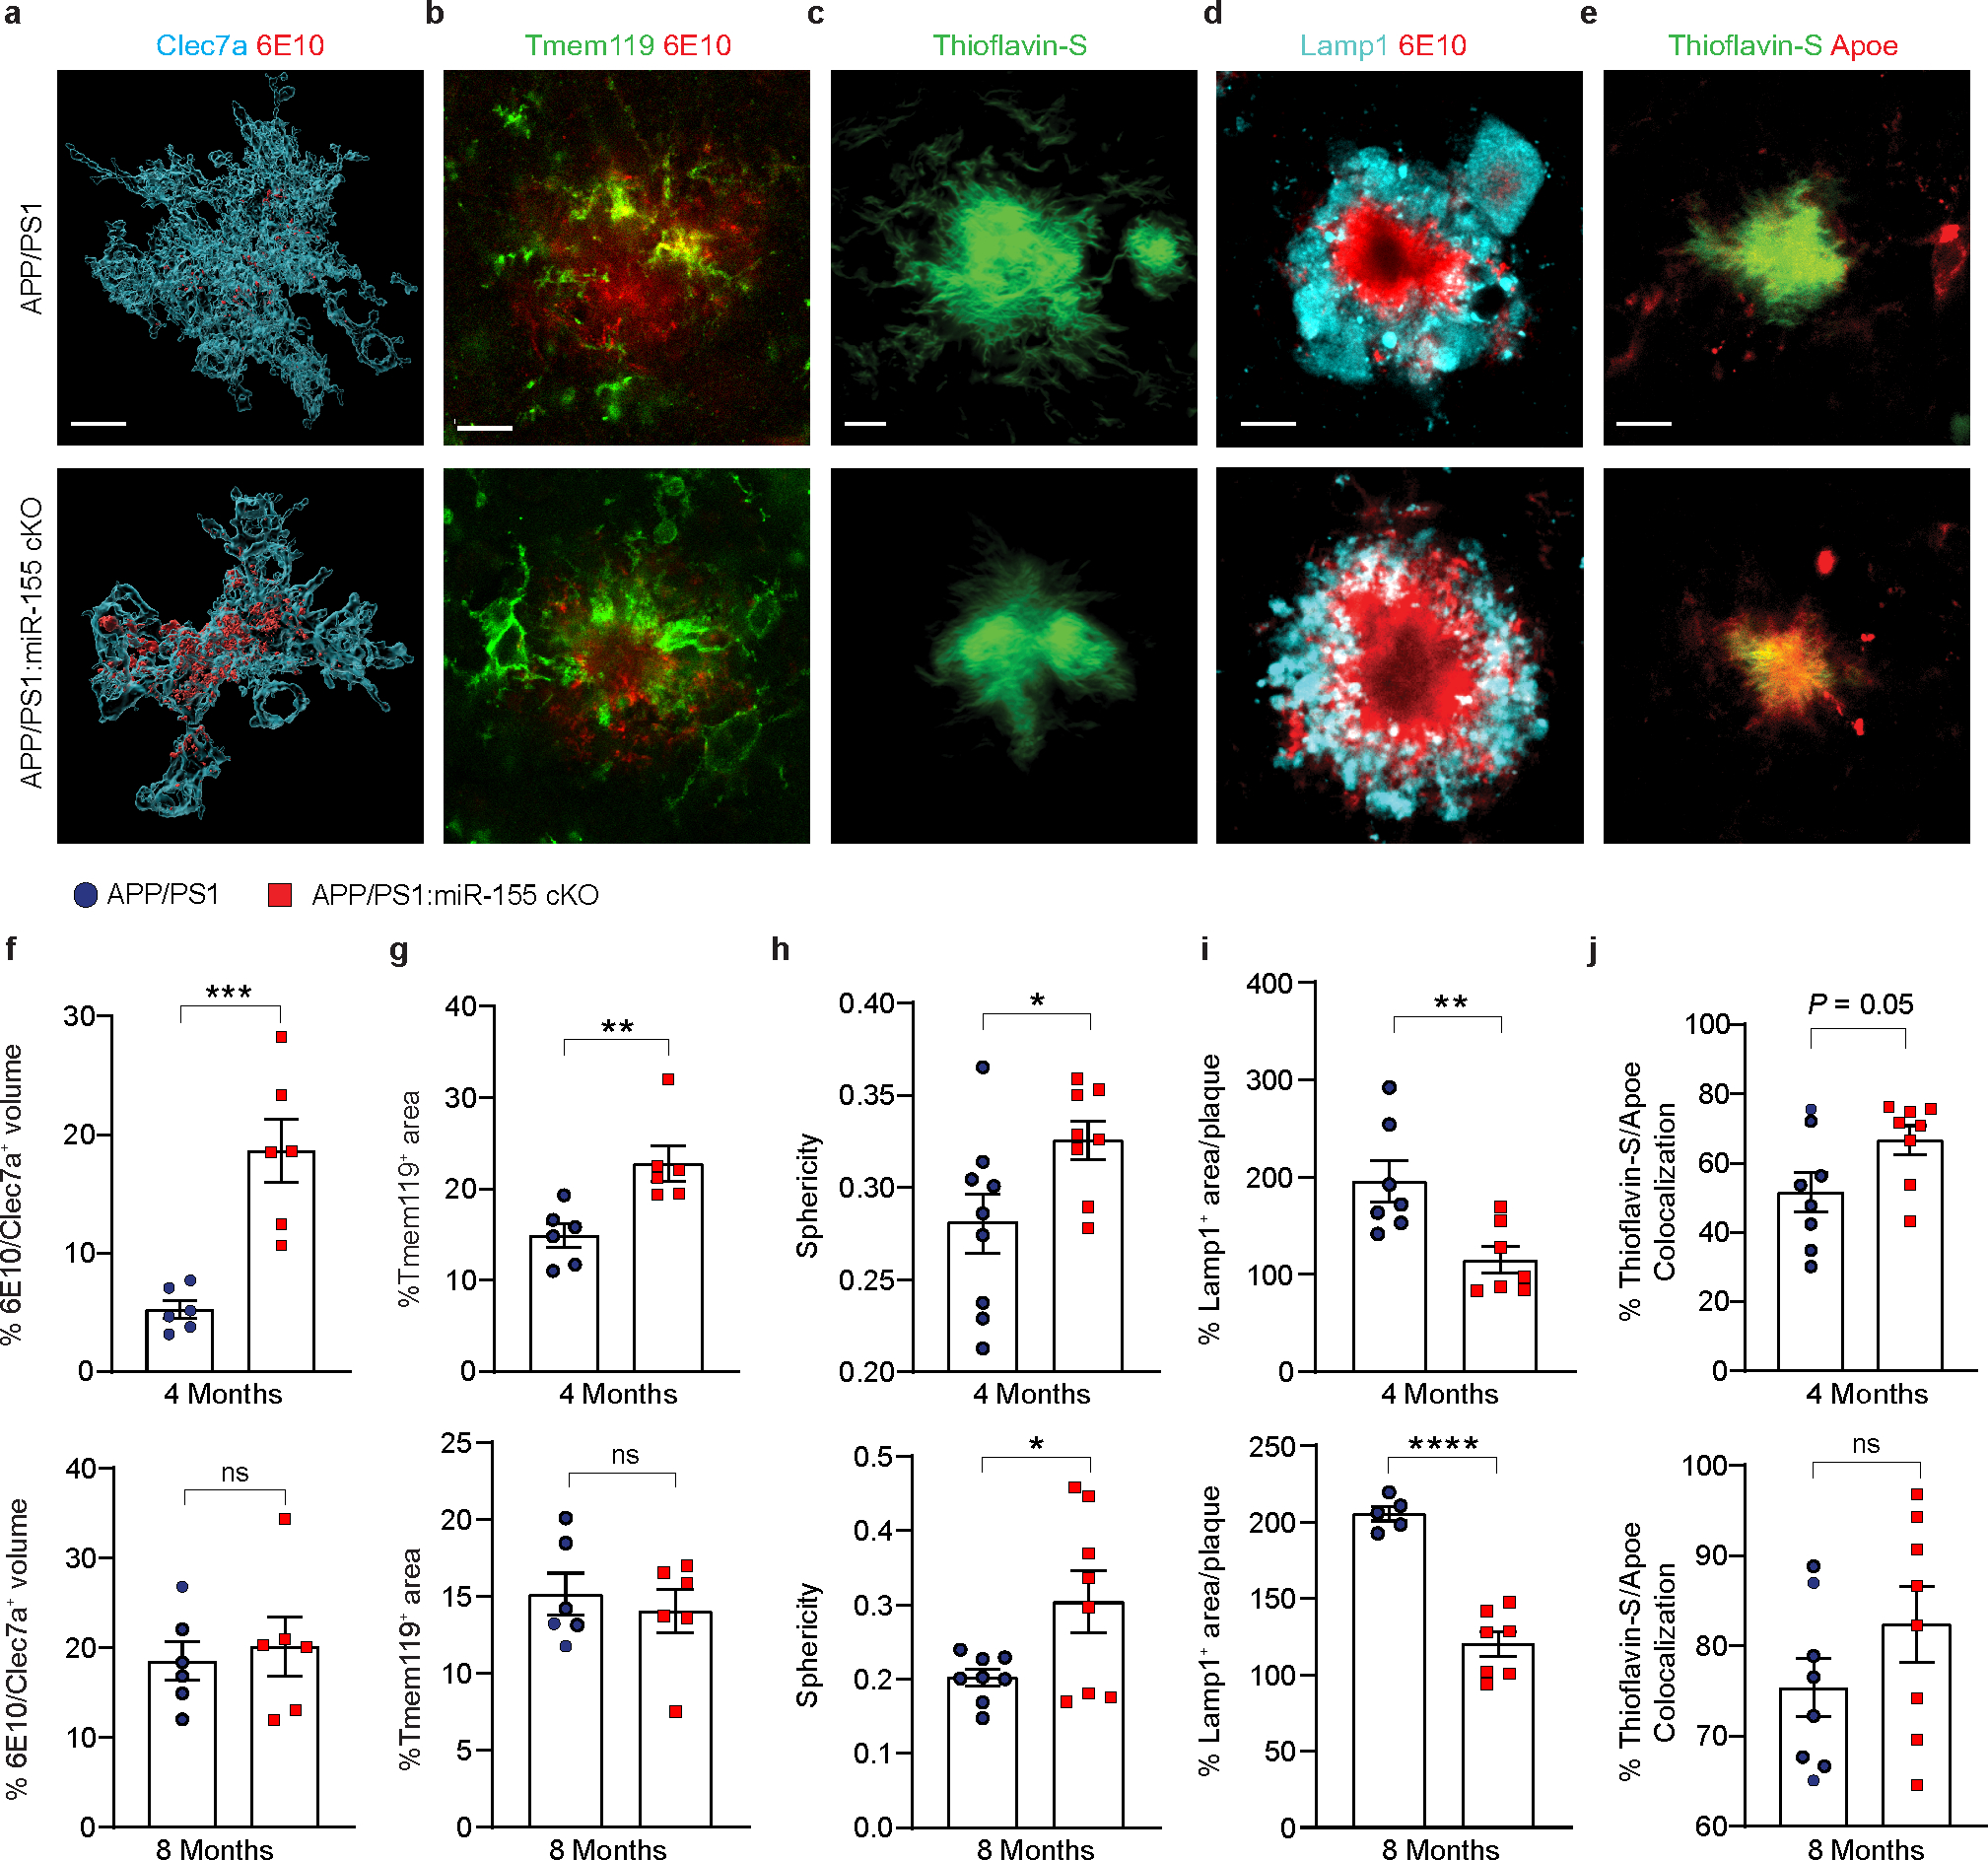
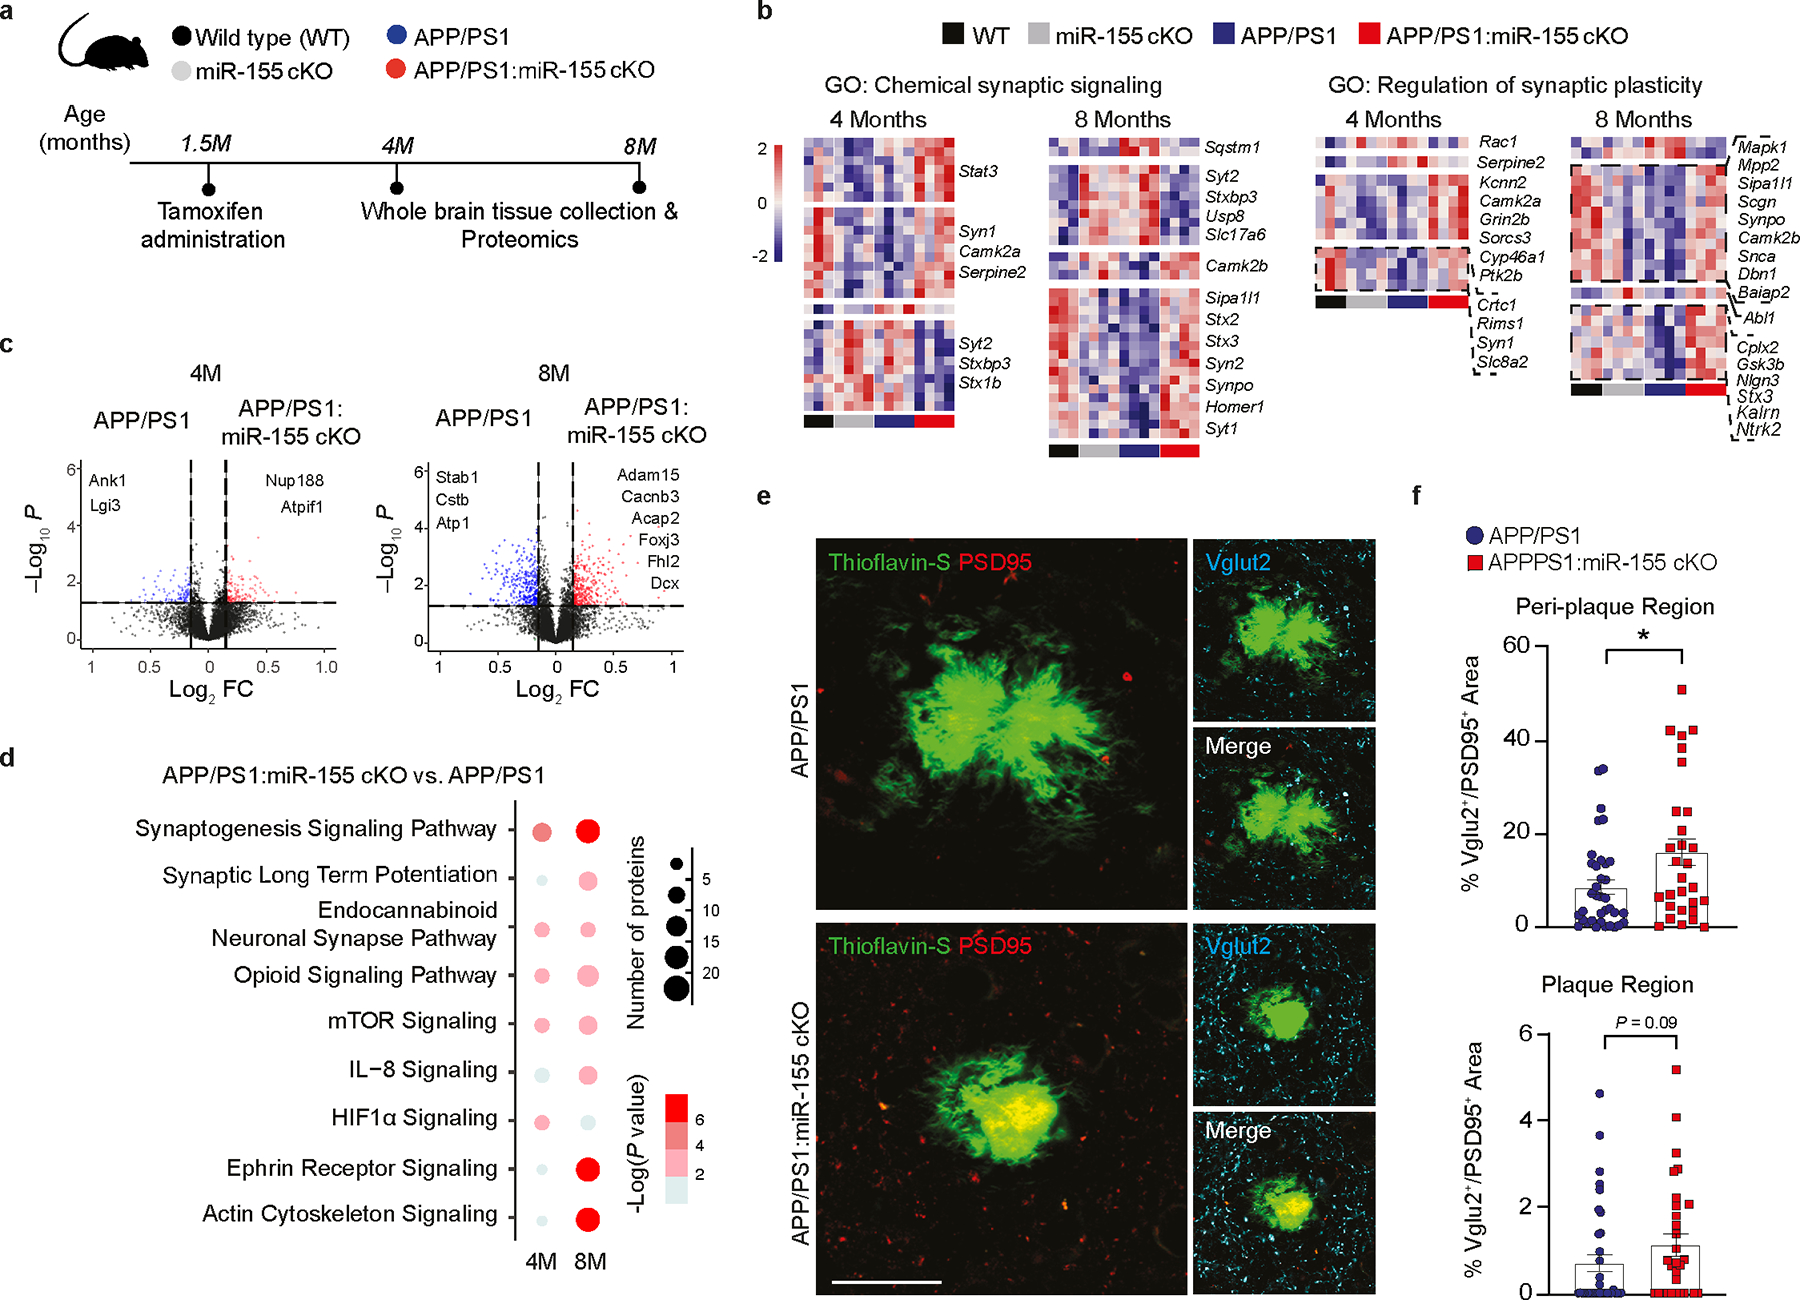
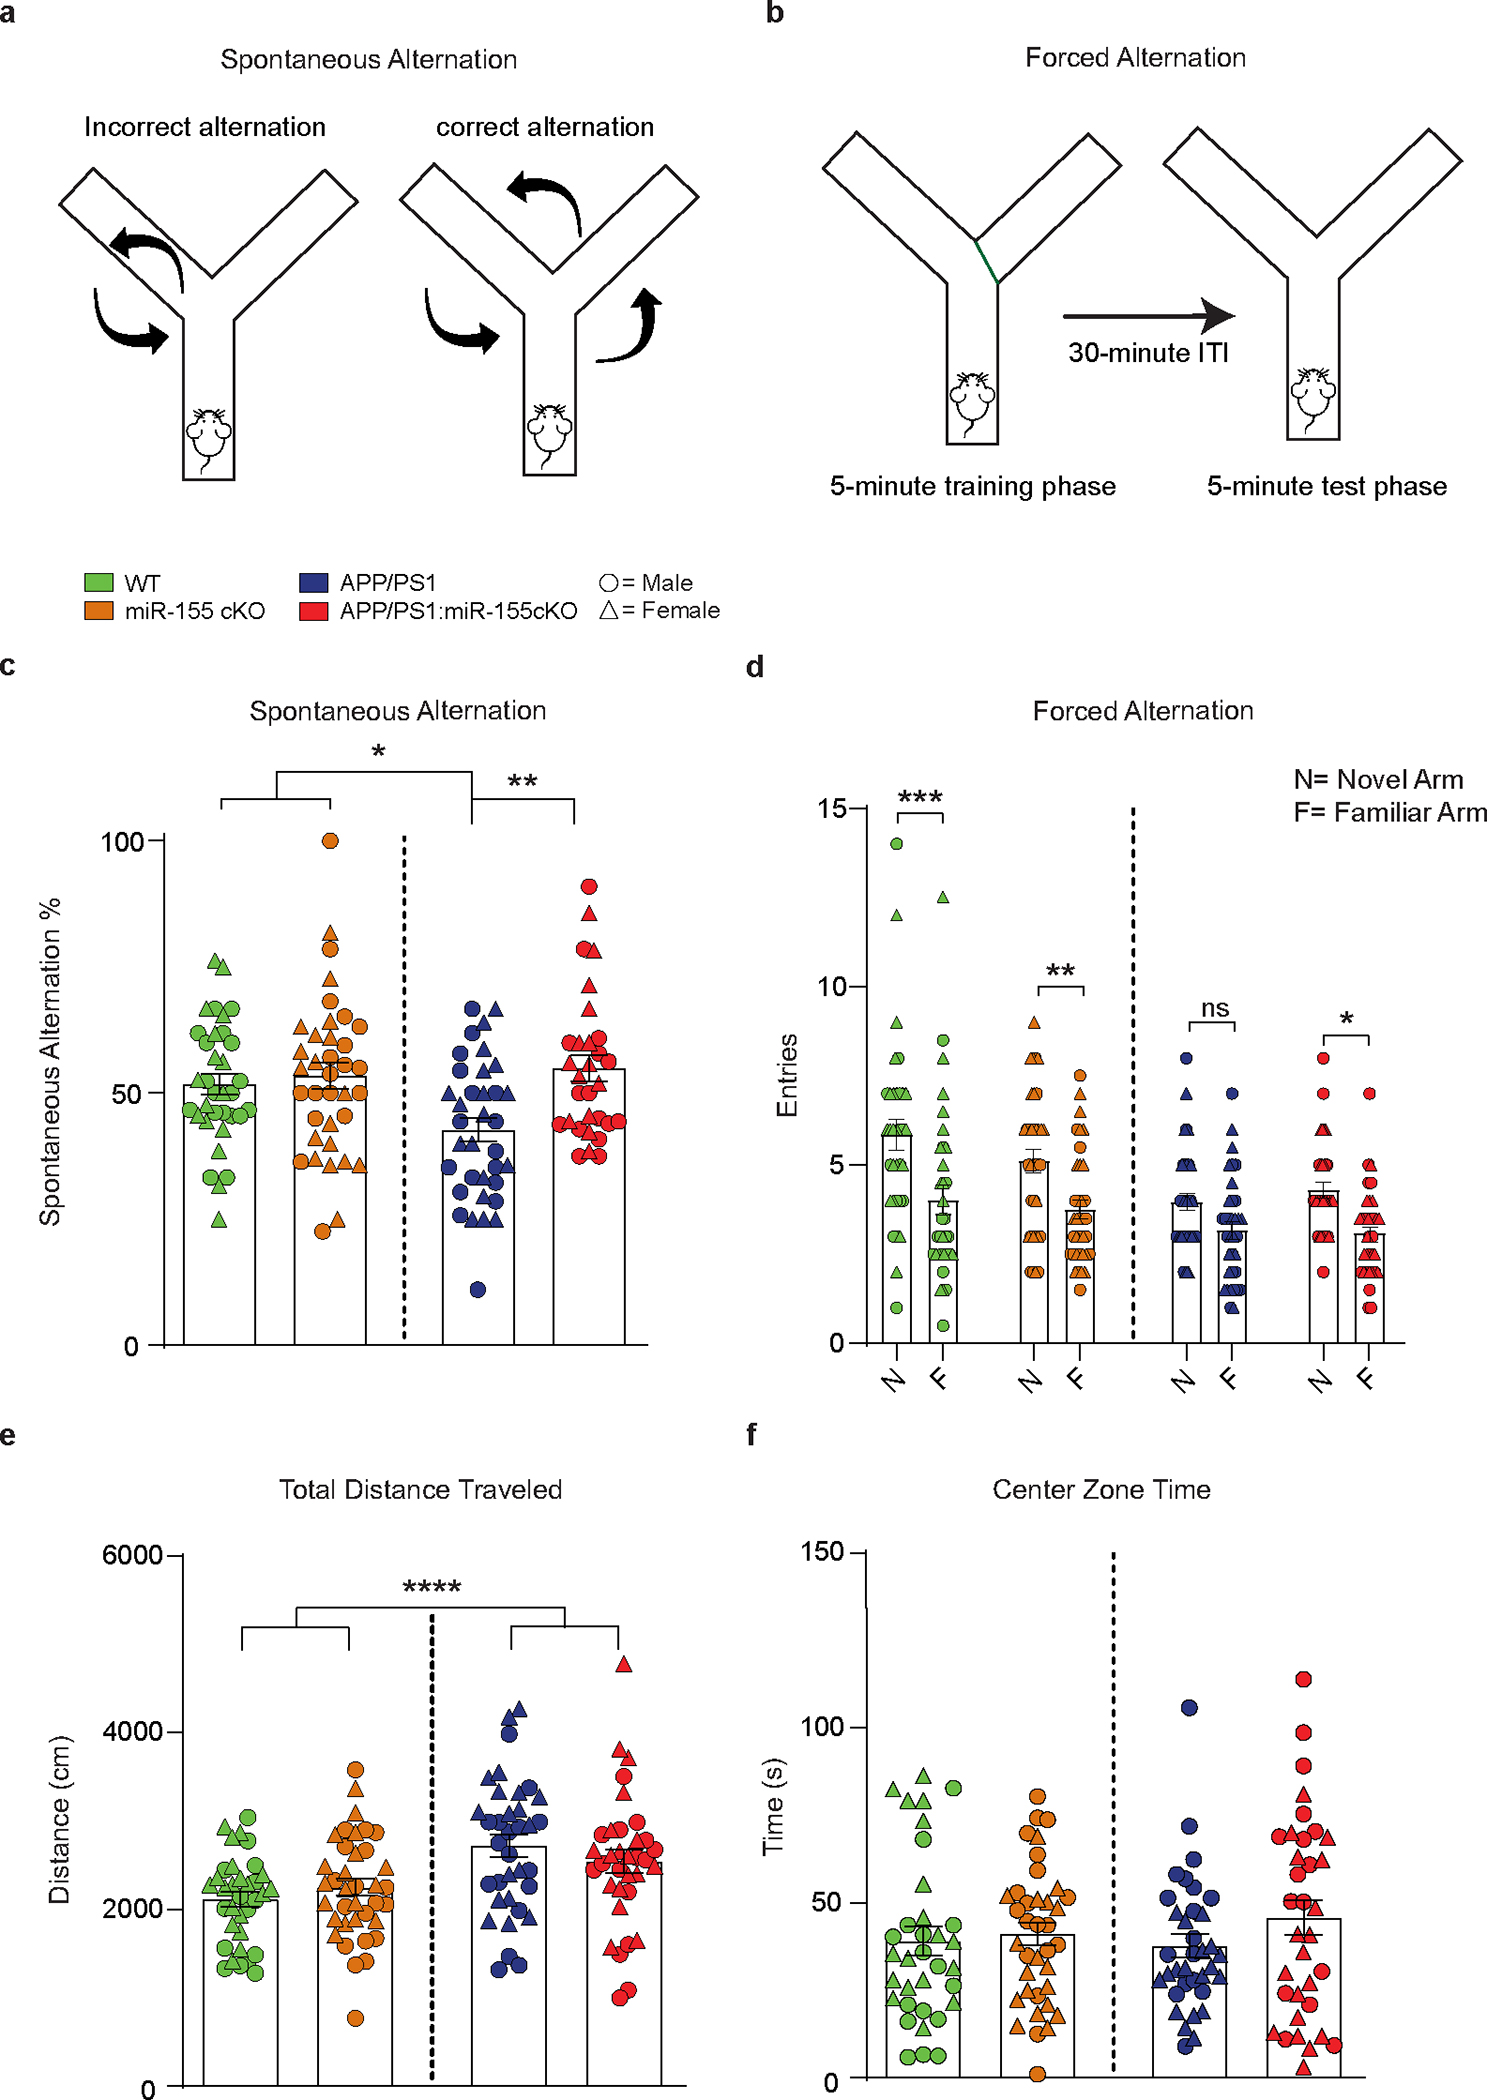
Microglia play a critical role in brain homeostasis and disease progression. In neurodegenerative conditions, microglia acquire the neurodegenerative phenotype (MGnD), whose function is poorly understood. MicroRNA-155 (miR-155), enriched in immune cells, critically regulates MGnD. However, its role in Alzheimer's disease (AD) pathogenesis remains unclear. Here, we report that microglial deletion of miR-155 induces a pre-MGnD activation state via interferon-γ (IFN-γ) signaling, and blocking IFN-γ signaling attenuates MGnD induction and microglial phagocytosis. Single-cell RNA-sequencing analysis of microglia from an AD mouse model identifies Stat1 and Clec2d as pre-MGnD markers. This phenotypic transition enhances amyloid plaque compaction, reduces dystrophic neurites, attenuates plaque-associated synaptic degradation and improves cognition. Our study demonstrates a miR-155-mediated regulatory mechanism of MGnD and the beneficial role of IFN-γ-responsive pre-MGnD in restricting neurodegenerative pathology and preserving cognitive function in an AD mouse model, highlighting miR-155 and IFN-γ as potential therapeutic targets for AD.


Conflict of interest statement

Competing Interests

O.B. is an inventor of a patent for use of miR-155 inhibitors for treatment of neurodegenerative diseases. O.B.: collaboration with GSK, Regulus Therapeutics; research funding from Sanofi, GSK, honoraria for lectures, consultancy: Camp4, Ono Pharma USA. T.I. consults Takeda. The remaining authors declare no competing interests.

Figures

Extended Data Fig. 1.
Extended Data Fig. 1.. miR-155 is specifically detected in Iba1+ cells in the brain of APP/PS1 mice.
a, Gating strategy for sorting Ly6C–CD11b+Fcrls+ microglia. b, Confocal microscopy images of Iba1 or CD206 immunoreactivity and detection of miR-155 gene expression using miRNAscope in 8-month-old APP/PS1 mice, scale bar: 50 μm. c, Quantification of fluorescence intensity of miR-155 in Iba1+ cells, Iba1 cells, and CD206+ cells per ROI using one-way ANOVA with Tukey’s post hoc analysis, P < 0.0001 (n = 8 ROI for Iba1+ group, n = 12 ROI for Iba1 group, n = 5 ROI for CD206+ group). Data were presented as mean values ± s.e.m.
Extended Data Fig. 2.
Extended Data Fig. 2.. Targeting microglial miR-155 causes subtle changes in APP/PS1 mice at 8 months old.
a, qPCR of miR-155 expression in microglia from 8-month-old mice showing the efficiency of tamoxifen treatment, P = 0.0003 using one-way ANOVA with Tukey’s post hoc test (n = 5 mice for WT and APP/PS1:miR-155 cKO group, n = 3 mice for miR-155 cKO group, n = 4 mice for APP/PS1 group). b, Heatmap of DEGs identified in microglia of APP/PS1:miR-155 cKO group at 8 months of age, compared to APP/PS1 group using DESeq2 analysis (Two-sided LRT, FDR-corrected P < 0.05, n = 5–6 per sex/group). c, PCA analysis showing no significant separation among all the groups at 8 months old. d, Venn diagram showing the difference of DEGs between 4- and 8- month groups. Data were presented as mean values ± s.e.m See also Supplementry Table 1.
Extended Data Fig. 3.
Extended Data Fig. 3.. Targeting microglial miR-155 suppresses homeostatic signature in WT mice.
a, Experimental design. b, Number of DEGs comparing miR-155 cKO vs. WT at 4- and 8 months old (n = 5–6 mice per sex/group). Heatmap of DEGs identified in miR-155 cKO microglia, compared to WT microglia for male (c) and female (d) groups using DESeq2 analysis, two-sided Wald test, FDR-corrected P < 0.05 (n = 5–6 mice per sex group). e, Top-affected pathways based on the comparison of female miR-155 cKO microglia vs WT microglia at 8 months of age using IPA (DEGs were identified with two-sided Wald test, FDR-corrected P < 0.05). See also Supplementry Table 1.
Extended Data Fig. 4.
Extended Data Fig. 4.. Male APP/PS1 mice show more robust changes after targeting microglial miR-155.
Venn diagram (a) and violin plot (b) showing the difference of up-regulated DEGs or down-regulated DEGs by comparing APP/PS1:miR-155 cKO vs. APP/PS1 (P < 0.05) between male and female samples at 4 months of age. c, Sex-specific top-15 upregulated and downregulated DEGs with the Log2 fold changes (FC) between APP/PS1 vs. WT group and APP/PS1:miR-155 cKO vs. WT group. DEGs were identified using DESeq2 analysis with FDR-corrected P < 0.05. d, Volcano plots using common DEGs of sex-specific APP/PS1:miR-155 cKO microglia vs. APP/PS1 microglia and non-plaque-associated microglia or plaque-associated microglia, compared to WT microglia (Two-sided LRT, P < 0.05). See also Supplementary Table 1.
Extended Data Fig. 5.
Extended Data Fig. 5.. miR-155 ablation induces interferon signaling in microglia.
a, GSEA analysis of interferon alpha response and interferon gamma response made using bulk RNA sequencing data from isolated microglia. b, DEG Heatmaps of genes involved in gene ontology terms for phagocytosis, antigen presentation and cellular response to IFNγ derived from bulk RNAseq data (Two-sided LRT, FDR-corrected P < 0.05, n = 4–6 mice per sex/group). c, Transcription factor functional enrichment analysis in microglia comparing APP/PS1:miR-155 cKO vs. APP/PS1 mice at 4 months old (R_Dorothea, FDR-corrected P < 0.05). d, Workflow of generating miR-155 targetome. e, Volcano plots showing common genes (highlighted) between miR-155 targetome and DEGs from four different comparisons: male and female miR-155 cKO vs. WT at the age of 8 months, APP/PS1:miR-155 cKO vs. APP/PS1 at the age of 4 and 8 months (Two-sided Wald test, P < 0.05, n = 5–13 mice per group). f, Table of common miR-155 targeted genes among four different comparisons in e. See also Supplementary Table 1.
Extended Data Fig. 6.
Extended Data Fig. 6.. miR-155 ablation sensitizes microglial transition to the pre-MGnD cluster through IFNγ signaling.
a, Gating strategy for sorting CD11b+CD45+ myeloid cells. b, Unbiased UMAP plots analysis of female APP/PS1 and APP/PS1:miR-155 cKO microglia from single cell sequencing. Initial clustering generated 17 sub-clusters (n = 2 mice per group, 15,429 cells). c, Cell cycle phase analysis for each cluster (clusters 15 and 16 removed). d, Percentage of cell cycle phase within each sub-cluster. e, Volcano plots of DEGs in the proliferating microglia clusters 8 and 9 comparing APP/PS1:miR-155 cKO microglia and APP/PS1 microglia (Two-sided Wald test, P < 0.05). f, Effect-size of differences in the proportion of microglia clusters between genotypes in female APP/PS1:miR-155 cKO mice determined by Poisson regression. The color bar indicates the P value, while the size of the points indicates the effect size. g, UMAP plots analysis of three major microglia clusters identified in male APP/PS1 and APP/PS1:miR-155 cKO microglia from scRNA sequencing (n = 3 mice per group, 43,667 cells). h, Bar charts showing relative percentage of each major microglia cluster in APP/PS1 and APP/PS1:miR-155 cKO mice. i, Violin plots showing the mean Z-score of pre-MGnD markers in APP/PS1 and APP/PS1:miR-155 cKO male mice. P = 3.54507e-91 by Kruska-Wallis test, FDR corrected using Benjamini Hochberg. j, Top-affected pathways from IPA analysis of all three clusters based on the comparison of APP/PS1:miR-155 cKO microglia vs. APP/PS1 microglia at 4 months of age (DEGs were identified with two-sided Wilcox FDR-corrected P < 0.05). k, UMAP plots analysis of microglia clusters identified in male APP/PS1 and APP/PS1:miR-155 cKO microglia including subclusters of pre-MGnD. l, Dot plot showing top markers for four microglia clusters (M0, early IFN-responsive pre-MGnD, late IFN-responsive pre-MGnD and MGnD). m, Trajectory analysis showing the transition from M0 to MGnD via IFN-responsive pre-MGnD clusters. n, Dynamic plots showing the expression of selected genes in all four major microglia clusters. o, Effect-size of differences in the proportion of microglia clusters between genotypes in male APP/PS1:miR-155 cKO mice determined by Poisson regression. The color bar indicates the P value, while the size of the points indicates the effect size. Standard error bars were shown. See also Supplementary Table 2.
Extended Data Fig. 7.
Extended Data Fig. 7.. Validation of Stat1 and Clec2d pre-MGnD markers.
a, Confocal microscopy images of Stat1+ and Iba1+ cells in the brain of APP/PS1 and APP/PS1:miR-155 cKO mice at 4 months of age. Scale bar: 50 μm. b, Quantification of Stat1positive are in Iba1+ cells per ROI, P = 0.0001 by two-tailed Student’s unpaired t-test (n = 12 ROIs from 3 mice for APP/PS1 group, n = 18 ROIs from 6 mice for APP/PS1:miR-155 cKO group). c, Comparison of transcript per million (TPM) level of Clec2d between WT and APP/PS1 mice, P = 0.0458 by two-tailed Student’s unpaired t-test (n = 11 APP/PS1, n = 9 APP/PS1:miR-155 cKO). d, FACS plots showing four clusters in WT, 2- and 8-month-old APP/PS1 mice, which are Clec7aClec2d (M0), Clec7aClec2d+ (early pre-MGnD), Clec7a+Clec2d+ (late pre-MGnD), and Clec7a+Clec2d (MGnD). e, Quantification of percentage of four clusters mentioned in d from WT, 2- and 8-month-old APP/PS1 mice, P < 0.0001 for M0 and late pre-MGnD, P = 0.0011 (WT vs. 8-month-old APP/PS1) and P = 0.0084 (2-month-old APP/PS1 vs. 8-month-old APP/PS1) for early pre-MGnD, P = 0.0017 (WT vs. 8-month-old APP/PS1) and P = 0.0014 (2-month-old APP/PS1 vs. 8-month-old APP/PS1) for MGnD as determined by one-way ANOVA (n = 3 WT, n = 4 APP/PS1). f, qPCR Quantification of gene expression of P2ry12, Clec2d, and Clec7a in M0, early pre-MGnD, late pre-MGnD, and MGnD clusters, P < 0.0001 for P2ry12, P = 0.0046 (early pre-MGnD vs. MGnD) and P = 0.0103 (late pre-MGnD vs. MGnD) for Clec2d, P = 0.0136 (M0 vs. early pre-MGnD), P = 0.0060 (M0 vs. late pre-MGnD), and P = 0.0023 (M0 vs. MGnD) for Clec7a as determined by one-way ANOVA (n = 5 mice/group). Data were presented as mean values ± s.e.m.
Extended Data Fig. 8.
Extended Data Fig. 8.. miR-155 targets Stat1 and regulates interferon signaling pathway.
a, Illustration of 3’UTR of Stat1 Gaussia luciferase assay co-transfected with miR-155 mimic or miR-155 antagomir into N9 microglial cells; Created with Biorender.com. b, Control plasmid activity in miR-155 mimic and miR-155 antagomir transfected cells. Fold changes were calculated as compared to control mimic or antagomir using two-tailed Student’s unpaired t-test (n = 3). c, Fold changes of luciferase activity after co-transfection of mutant STAT1 3’UTR and control mimic or miR-155 mimic to check the specific binding of miR-155 to Stat1, P = 0.0234 by two-way ANOVA with Holm-Sidak post hoc analysis (n = 3). d, Fold changes of luciferase activity after non-mutated Stat1 3’UTR co-transfected with the non-relevant miRNA mimic (miR-18), P = 0.0072 by one-way ANOVA with post hoc Tukey’s test (n = 3). Data are representative of 2 independent experiments and show biologically independent replicates (b-d). e, Venn diagram depicting overlap of Ifngr1 cKO downregulated genes and APP/PS1:miR-155 cKO upregulated genes. f, Heatmap showing expression of genes which were downregulated by Ifngr1 cKO phagocytic microglia and upregulated in APP/PS1:miR-155 cKO microglia. Data were presented as mean values ± s.e.m. See also Supplementary Tables 1, 3.
Extended Data Fig. 9.
Extended Data Fig. 9.. Decreased 6E10+ amyloid plaque burden and enhanced phagocytosis function in APP/PS1:miR-155 cKO mice.
a, Representative images of 6E10 staining in APP/PS1 and APP/PS1:miR-155 cKO brains at the age of 4 months. Scale bar: 500 μm. b, 6E10 plaque counts normalized to area and percent area 6E10 positivity in 4-month-old mice. P values were determined using two-tailed Student’s unpaired t-test, P = 0.0084 and P = 0.0104, respectively (n = 10 APP/PS1, n = 9 APP/PS1:miR-155 cKO). c, 6E10 plaque counts normalized to area and percent area 6E10 positivity in 8-month-old mice (n = 14 APP/PS1, n = 16 APP/PS1:miR-155 cKO). P values were determined using two-tailed Student’s unpaired t-test. d, Representative images of Thioflavin-S in the cortex and hippocampus of APP/PS1 and APP/PS1:miR-155 cKO mice at 4 months old. Scale bar: 500 μm. P values were determined using two-tailed Student’s unpaired t-test. e, Thioflavin-S plaque counts normalized to area and percent area Thioflavin-S positivity in 4-month-old mice. P values were determined using two-tailed Student’s unpaired t-test (n = 10 APP/PS1, n = 9 APP/PS1:miR-155 cKO, P = 0.09). f, Thioflavin-S plaque counts normalized to area and percent area Thioflavin-S positivity in 8-month-old mice (n = 14 APP/PS1, n = 16 APP/PS1:miR-155 cKO). P values were determined using two-tailed Student’s unpaired t-test. g, Representative images of Thioflavin-S in the cortex and hippocampus of APP/PS1 and APP/PS1:miR-155 cKO mice at 2.5 months of age. Scale bar: 500 μm. h, Quantification of Thioflavin-S+ plaque area in the cortical region at 2.5 months of age using two-tailed Student’s unpaired t-test (n = 6 APP/PS1, n = 5 APP/PS1:miR-155 cKO). i, Representative images of HJ3.4B staining in APP/PS1 and APP/PS1:miR-155 cKO brains. Scale bar: 500 μm. j, Quantification of HJ3.4B+ plaque area normalized to cortical area at 2.5 months of age using two-tailed Student’s unpaired t-test (n = 6 APP/PS1, n = 5 APP/PS1:miR-155 cKO). k, Apoptotic neuron injection scheme. l, Mean fluorescence intensity (MFI) of phagocytic microglia sorted from WT and miR-155 cKO mice following apoptotic neuron injection, P = 0.0042 using two-tailed Student’s unpaired t-test (n = 7 WT, n = 14 miR-155 cKO). Data were combined from two independent experiments and normalized to control group (l). Data were presented as mean values ± s.e.m.
Extended Data Fig. 10.
Extended Data Fig. 10.. Proteomic analysis of whole-brain tissue showed enhanced synaptic functions in APP/PS1:miR-155 cKO mice at 4 and 8 months of age.
a, Heatmaps of significantly changed proteins between male APP/PS1:miR-155 cKO and APP/PS1 whole brain tissue at 4 and 8 months of age (one-way ANOVA with Student’s t-test between APP/PS1 and APP/PS1:miR-155 cKO mice, P < 0.05, n = 3–4 male mice per group). See also Supplementary Table 4.
Fig. 1.
Fig. 1.. Targeting microglial miR-155 enhances MGnD signature in APP/PS1 mice.
a, Experimental design. b, qPCR of miR-155 expression of 4-month-old mice showing the efficiency of tamoxifen treatment using one-way ANOVA, P < 0.0001 by one-way ANOVA with Tukey’s post hoc test (n = 6 mice for miR-155 cKO group; n = 3 mice for the other three groups). c, Heatmap of DEGs identified in APP/PS1:miR-155 cKO microglia, compared to APP/PS1 microglia using DESeq2 analysis. FDR-corrected P < 0.05, sex-specific DEGs removed (n = 4–6 mice per sex/group). d, Top-20 upregulated genes with the fold changes (FC) between APP/PS1 vs. WT group and APP/PS1:miR-155 cKO vs. WT group. e, Scatter plot showing DEGs of male and female samples from APP/PS1:miR-155 cKO group, compared to APP/PS1 mice (DEGs with Log2FC higher than the absolute value as 0.58 were labeled depending on preferential change in one sex). f, Representative confocal images of Clec7a+ MGnD and Aβ (6E10) in the brain of APP/PS1:miR-155 cKO (n = 6) and APP/PS1 (n = 6) mice. Data were obtained from one independent experiment. Scale bars: 50 μm, 15 μm. g, Quantification of the expression of Clec7a+ MGnD surrounding 6E10+ Aβ plaques by corrected total cell fluorescence (CTCF) using two-tailed unpaired Student’s t-test, P = 0.002, 19 plaques from APP/PS1 (n = 6) mice and 18 plaques from APP/PS1:miR-155 cKO (n = 6) mice. h, Volcano plots using common DEGs of APP/PS1:miR-155 cKO microglia and non-plaque-associated microglia (two-tailed P < 0.05, Wald test) or (i) plaque-associated microglia datasets, compared to WT microglia (two-tailed P < 0.05, Wald test). j, Top-affected pathways from IPA analysis based on four different comparisons: non-plaque-associated microglia (MG) vs. WT MG, Aβ plaque-associated MG vs. WT MG, APP/PS1 MG vs. WT MG, and APP/PS1:miR-155 cKO vs. WT MG (Z-Score absolute ≥ 2). Data were presented as mean values ± s.e.m. See also Extended Data Figs. 1–5, and Supplementary Table 1.
Fig. 2.
Fig. 2.. miR-155 ablation primes microglial transition to the pre-MGnD cluster through IFN-γ signaling.
a, UMAP plots of major microglia clusters identified in female APP/PS1 and APP/PS1:miR-155 cKO mice (n = 2 mice per group). b, Bar charts showing relative amounts of each cluster in the experimental and control groups. c, Violin plots showing the mean Z-score of pre-MGnD markers in all the cells from APP/PS1 and APP/PS1:miR-155 cKO mice; P = 6.829469e-12 by Kruskal-Wallis test, FDR corrected using Benjamini Hochberg. d, Top-affected pathways from IPA analysis of all three clusters based on the comparison of APP/PS1:miR-155 cKO microglia vs. APP/PS1 microglia at 4 months of age, Z-Score absolute ⩾ 2 (DEGs were identified with FDR-corrected P < 0.05, Wilcox test). e, UMAP plots analysis of microglia clusters identified in female APP/PS1 and APP/PS1:miR-155 cKO microglia including subclusters of pre-MGnD. f, Dot plot showing top markers for major microglia clusters (M0, early IFN-responsive pre-MGnD, late IFN-responsive pre-MGnD, MGnD). g, Trajectory analysis showing the transition from M0 to MGnD via IFN-responsive pre-MGnD clusters. h, Dynamic plots showing the expression of selected genes in all four major microglia clusters. i, Stat1 normalized counts from bulk microglia RNA sequencing; P = 0.0012 by two-sided Wald test, FDR corrected using Benjamini Hochberg (n = 10 mice per group). j, Comparison of Cebpb expression within the pre-MGnD cluster between APP/PS1 and APP/PS1:miR-155 cKO mice; P = 2.858552e-39 by Kruska-Wallis test, FDR corrected using Benjamini Hochberg (n = 2 mice per group). k, Scheme depicting relationship between miR-155 antagomir, mimic and Gaussia luciferase mRNA with Stat1 3’UTR. l, STAT1 3’ UTR luciferase activity in miR-155 mimic and antagomir transfected cells. Fold changes were calculated as compared to control mimic or antagomir using Student’s unpaired t-test; P < 0.0001 for control vs. miR-155 mimic; P = 0.0006 for control vs. miR-155 antagomiR (n = 3). Data are representative of 2 independent experiments and show biologically independent replicates (l). Data were presented as mean values ± s.e.m. See also Extended Data Figs. 6,7, and Supplementary Table 2.
Fig. 3.
Fig. 3.. Targeting IFNγ signaling abolishes the beneficial effect of miR-155 deletion in response to phagocytic stress.
a, Heatmap of DEG in phagocytic and non-phagocytic microglia isolated from WT and Ifngr1 cKO mice using DESeq2 analysis. Two-sided LRT statistical test with an FDR-corrected P < 0.05, n = 3 mice per group. b, Bar graphs depicting expression levels of select genes from (a) using two-way ANOVA with Holm-Sidak post hoc analysis, P = 0.042 for Lpl, P = 0.0331 for Spp1, P = 0.0031 for Egr1, P = 0.0018 for Cst3 and Mertk (n = 3 mice). c, Experimental design. d, FACS analysis showing decreased MFI of phagocytic microglia in the IFNγ blocker group as compared to IgG group in miR-155 cKO mice using One-way ANOVA; P = 0.0235 using One-way ANOVA (n = 6 mice for WT + IgG1 group; n = 7 mice for WT + IFNγ Ab group; n = 5 mice for miR-155 cKO + IgG1 group; n = 4 mice for miR-155 cKO + IFNγ Ab group). e, Heatmap showing enhanced response to apoptotic neurons after the deletion of miR-155. DEGs were identified using DESeq2 analysis with FDR-corrected P < 0.05 (n = 4–6 mice per group). f, Common genes between DEGs from top cluster shown in e and upregulated DEGs from APP/PS1:miR-155 cKO vs. APP/PS1 mice (Fig. 1c). g, Heatmap of decreased genes caused by IFNγ blocker overlapping with the genes shown in f using DESeq2 analysis with two-sided LRT, FDR-corrected P < 0.05 (n = 4–7 mice per group). The common gene among e, f and g were labeled in bold. Data were presented as mean values ± s.e.m. See also Extended Data Fig. 8, and Supplementary Table 3.
Fig. 4.
Fig. 4.. miR-155 deficient microglia restrict Aβ pathology.
a, Imaris 3D renderings of Clec7a positive microglia and 6E10 at 4 months of age. Scale bar: 20 μm. b, IHC of Tmem119 and 6E10 showing microglial migration to plaque lesions. Scale bar: 10 μm. c, High-resolution image of Thioflavin-S+ plaques in 4-month-old APP/PS1 and APP/PS1:miR-155 cKO mice. Scale bar: 15 μm. d, Representative images of 6E10/Lamp1 co-staining in APP/PS1 and APP/PS1:miR-155 cKO mice. Scale bar: 20 μm. e, Representative images of Thioflavin-S and ApoE co-staining. Scale bar: 15 μm. f, Quantification of % 6E10/Celc7a volume at 4 (P = 0.0007 by two-tailed Students unpaired t-test test) and 8 months of age (P = 0.6876 by two-tailed Student’s unpaired t-test), n = 6 mice per group. g, Quantification of Tmem119 positive area/plaque in 4-month-old (P = 0.0063 by two-tailed Student’s unpaired t-test) and 8-month-old mice (P = 0.5687 by two-tailed Student’s unpaired t-test), n = 6 mice per group. h, Quantification of sphericity in 4-month-old (P = 0.0360 by two-tailed Student’s unpaired t-test) and 8-month-old mice (P = 0.0342 by two-tailed Student’s unpaired t-test) APP/PS1 and APP/PS1:miR-155 cKO mice. n = 9 APP/PS1, n = 8 APP/PS1:miR-155 cKO at 4 months old; n = 8 mice per group at 8 months old. i, Quantification of 6E10-associated Lamp1 in 4-month-old (P = 0.0079 by two-tailed Student’s unpaired t-test) and 8-month-old (P < 0.0001 by two-tailed Student’s unpaired t-test) groups. n = 7 mice per group at 4 months old; n = 5 mice for APP/PS1 group; n = 7 mice for APP/PS1:miR-155 cKO group at 8 months old. j, Quantification of plaque associated ApoE at 4 and 8 months of age using two-tailed Mann-Whitney test (n = 8 mice per group). Data were presented as mean values ± s.e.m. See also Extended Data Fig. 9.
Fig. 5.
Fig. 5.. Deletion of microglial miR-155 enhanced synaptic functions in the brain milieu of APP/PS1 mice at 4 and 8 months of age.
a, Proteomic analysis of whole-brain tissue experimental design. b, Heatmaps of DEPs from GO terms using one-way ANOVA (n = 3–4 male mice per group). c, Volcano plots of DEPs between APP/PS1:miR-155 cKO and APP/PS1 whole brain tissue, P < 0.05 using two-sided Wald test. d, Selected pathways from IPA analysis on DEPs between APP/PS1:miR-155 and APP/PS1 whole-brain tissue (Z-Score absolute ≥ 2). e, Representative images of synaptic proteins PSD95, Vglut2, and Thioflavin-S in cortex plaques of 8-month-old APP/PS1:miR-155 cKO and APP/PS1 mice. Scale bar: 20 μm. f, Quantification of the percentage of colocalized area of Vglut2/Psd95 in the plaque and peri-plaque regions of 8-month-old mice compared using two-tailed Mann-Whitney test, P = 0.0275, 36 plaques from APP/PS1 (n = 6) mice and 29 plaques from APP/PS1:miR-155 cKO (n = 5) mice. Data were presented as mean values ± s.e.m. See also Extended Data Fig. 10 and Supplementary Table 4.
Fig. 6.
Fig. 6.. Microglia specific miR-155 ablation rescues cognitive function in APP/PS1 mice.
a, Illustration for spontaneous alternation test. b, Illustration for forced alternation test. ITI: inter trial interval. c, Quantification of % correct spontaneous alternations in the Y-maze SA for 8-month-old WT and APP/PS1 mice with and without microglia specific miR-155 ablation. Two-way ANOVA with Tukey’s post hoc test, APP/PS1 vs. APP/PS1:miR-155 cKO, P = 0.004 (n = 34 WT, n = 36 miR-155 cKO, n = 35 APP/PS1 and n = 30 APP/PS1:miR-155 cKO mice). d, FA task was used to assess recognition memory in WT and APP/PS1 mice. The number of entries into the novel arm versus the average number of entries into the familiar arms was compared for each mouse by repeated measure three-way ANOVA with Bonferoni’s post hoc test, WT P = 0.0002, miR-155 cKO P= 0.0064, APP/PS1 P = 0.2361, APP/PS1:miR-155 cKO P = 0.0212 (n = 34 WT, n = 36 miR-155 cKO, n = 35 APP/PS1 and n = 30 APP/PS1:miR-155 cKO mice). e, Total distance traveled over time in the open field locomotor activity task. Main effect of APP transgene by two-way ANOVA, WT vs. APP/PS1, P < 0.0001; APP/PS1 and APP/PS1:miR-155 cKO are not statistically different by two-way ANOVA with Bonferoni’s post hoc test (n = 34 WT, n = 37 miR-155 cKO, n = 35 APP/PS1 and n = 29 APP/PS1:miR-155 cKO mice). f, Center zone time for WT and APP/PS1 mice. There were no statistically significant differences between any groups by two-way ANOVA with Bonferoni’s post hoc test (n = 34 WT, n = 37 miR-155 cKO, n = 35 APP/PS1 and n = 29 APP/PS1:miR-155 cKO mice). Data were presented as mean values ± s.e.m.

Similar articles

Cited by

References

    1. Efthymiou AG & Goate AM Late onset Alzheimer’s disease genetics implicates microglial pathways in disease risk. Mol Neurodegener 12, 43 (2017). - PMC - PubMed
    1. Lambert JC, et al. Meta-analysis of 74,046 individuals identifies 11 new susceptibility loci for Alzheimer’s disease. Nat Genet 45, 1452–1458 (2013). - PMC - PubMed
    1. Kunkle BW, et al. Genetic meta-analysis of diagnosed Alzheimer’s disease identifies new risk loci and implicates Abeta, tau, immunity and lipid processing. Nat Genet 51, 414–430 (2019). - PMC - PubMed
    1. Colonna M & Butovsky O Microglia Function in the Central Nervous System During Health and Neurodegeneration. Annu Rev Immunol 35, 441–468 (2017). - PMC - PubMed
    1. Heneka MT, et al. Neuroinflammation in Alzheimer’s disease. Lancet Neurol 14, 388–405 (2015). - PMC - PubMed

Publication types