. 2023 Jul;9(7):1116-1129.
doi: 10.1038/s41477-023-01435-8. Epub 2023 Jun 8.

The structure of Arabidopsis phytochrome A reveals topological and functional diversification among the plant photoreceptor isoforms

Affiliations

The structure of Arabidopsis phytochrome A reveals topological and functional diversification among the plant photoreceptor isoforms

E Sethe Burgie et al. Nat Plants. 2023 Jul.

Abstract

Plants employ a divergent cohort of phytochrome (Phy) photoreceptors to govern many aspects of morphogenesis through reversible photointerconversion between inactive Pr and active Pfr conformers. The two most influential are PhyA whose retention of Pfr enables sensation of dim light, while the relative instability of Pfr for PhyB makes it better suited for detecting full sun and temperature. To better understand these contrasts, we solved, by cryo-electron microscopy, the three-dimensional structure of full-length PhyA as Pr. Like PhyB, PhyA dimerizes through head-to-head assembly of its C-terminal histidine kinase-related domains (HKRDs), while the remainder assembles as a head-to-tail light-responsive platform. Whereas the platform and HKRDs associate asymmetrically in PhyB dimers, these lopsided connections are absent in PhyA. Analysis of truncation and site-directed mutants revealed that this decoupling and altered platform assembly have functional consequences for Pfr stability of PhyA and highlights how plant Phy structural diversification has extended light and temperature perception.


Conflict of interest statement

Competing Interests

The authors declare no competing interests.

Figures
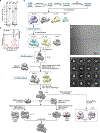
Extended Data Fig. 1:
Extended Data Fig. 1:. Characterizations of the Arabidopsis PhyA preparations and the workflow used for processing its cryo-EM images.
a, SDS-PAGE analysis of the recombinant full-length PhyA. Gels were either stained for protein with Coomassie blue (left) or assayed for bound PΦB by zinc-induced fluorescence (right). MM, molecular mass standards. Samples were indistinguishable to those described by Burgie et al. b, UV-vis absorbance spectra of PhyA. The spectra were collected from dark-adapted samples (Pr) or after saturating irradiation with 630-nm red light (RL, mostly Pfr). Absorption maxima were determined from the difference spectrum shown at 70% amplitude. The SCR at 664/723 nm is indicated in parenthesis. Spectra were the average of three technical replicates. c, Workflow used for data processing of the cryo-EM images of PhyA. In the first refined overall map at 3.5-Å resolution based on 421,969 particles, almost all PhyA domains were well seen except for the regions encompassing the PAS1 domains, which were poorly resolved. Focused refinements, excluding the PAS1 domains and using signal subtraction for the PSM, PAS2 and HKRD regions, generated a 3.2-Å map with some ambiguity in the HKRDs. Subsequent use of separate masks for the HKRDs and the platform led to improved 3.1-Å and 3.4-Å EM maps for the platform and HKRDs, respectively, which were combined to generate the final composite map of the dimer. 3DVA of particle images down-sampled to 4.14 Å per pixel resolved one of the flexible PAS1 domains (purple) at ~15-Å resolution. d, A representative cryo-EM micrograph after motion correction is shown. In total, data from 6,195 independent micrographs were utilized for map construction. e, Selected 2D class averages showing multiple views of the particles.
Extended Data Fig. 2:
Extended Data Fig. 2:. Particle distribution, and resolution estimation for the PhyA dimer EM maps.
a, The 3D EM consensus map and focus-refined individual platform and HKRD maps color coded by local resolution. b, Eulerian angle distribution of raw particle images used in the final 3D reconstruction. c, Gold-standard Fourier shell correlation (FSC) of two half maps (orange curve) and the correlation of the atomic model and the final composite 3D map (purple curve).
Extended Data Fig. 3:
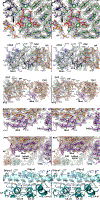
Extended Data Fig. 3:. Superposition of the cryo-EM map with the models of various features within the Arabidopsis PhyA dimer.
The map is shown in grey mesh whereas the 3D models of the motifs/residues are shown in cartoons/sticks and colored as in Fig. 1e. Panels a-c include PΦB (red sticks) to highlight proximity to the chromophore. Key residues are indicated. a, Knot lasso extending from the GAF domain to encircle the N-terminal extension (NTE) just upstream of the nPAS domain. b, Residues 69–81 comprising part of the NTE near the knot lasso that reaches near the chromophore. c, Orthogonal views of the hairpin extending from the PHY domain to contact the GAF domain near the chromophore. d, The modulator loop extending from between the PAS1 and PAS2 domains to interact with the PHY domain of its own protomer. e, The paired DHp domains within the HKRD. Helices α1 and α2 are indicated. The cruciate feature within helix α1 is located by the brackets. Residue 905 (R905), which is normally occupied by a histidine in transmitter histidine kinases, is highlighted by the red oval. f, Closeup views of the connections between the PAS2 domain of protomer B and the nPAS and GAF domains of protomer A within the dimer. g, Structural prediction of the PAS1 fold by TrRosetta (left) and congruence of this prediction (grey) with the cryo-EM models of the PAS2 (center) and nPAS domains from PhyA (right) shown in color. The N- and C-terminal ends are indicated. For panels (e) and (f), the peptide backbone is shown in cartoon, whereas the amino acid side chains are in sticks. The prime designations identify residues from the B protomer.
Extended Data Fig. 4:
Extended Data Fig. 4:. Stereo views of interdomain junctions within the Arabidopsis PhyA dimer.
The intricate interconnectivities of domains within the PSM are shown in the top three views. The fourth and fifth views highlight the modulator loop (Mod)/PHY domain connection, which provides an intra-protomer structural link with the PSM, and their connectivity to the hairpin, helical spine, and PAS2 domain features. The sixth view shows one half of the dimeric interface of the HKRD involving the DHp and CA domain α-helices. Key residues are indicated; prime designations indicate those from protomer B.
Extended Data Fig. 5:
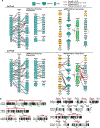
Extended Data Fig. 5:. Comparison of HKRD inter-protomer and HKRD-platform contacts in Arabidopsis (At) PhyA and PhyB as predicted from their cryo-EM models.
a, Diagrams of the contacts. Shown are the interacting regions in context of their α-helical, β-strand, or loop configurations. Left diagrams highlight the HKRD interprotomer interactions among the DHp and CA domains. Right diagrams highlight interactions between the HKRD (cyan/teal) and GAF (green) and PHY (orange) domains within the platform. The lines locate the specific residues involved in the predicted contacts; shown are connections found within PhyA, PhyB, or both. (A) and (B) refer to the A and B protomers within the dimer, respectively. Amino acid numberings correspond that those found within PhyA or PhyB. Some strands or helices are included for structural context but not found to participate in the interactions. b, Sequence alignment of the regions within AtPhyA and AtPhyB participating in the contacts shown in (a). Identical and similar amino acids are colored in black and grey boxes, respectively. The bars above demarcate the α-helical (red) and β-stranded (blue) features. The green circles below identify specific amino acids that participate in the contacts shown in (a).
Extended Data Fig. 6:
Extended Data Fig. 6:. The effect of NΔ25 and NΔ66 NTE truncations on the Pfr→Pr thermal reversion rate of full-length Arabidopsis PhyA.
a, Domain organization of full-length (FL) PhyA and NTE truncations starting at residue 25 (NΔ24) and 66 (NΔ65). The length of the NTE was extended for clarity. Dashed red lines represent the interaction of PΦB with NTE residues Tyr-70 and Ile-74. b, Thermal reversion rates of FL PhyA and its PSM bearing the NTE truncations NΔ24 and NΔ65. Data points and fit lines representative of three technical replicates are shown (see Extended Data Table 2 for statistical analyses). Also included are Pfr→Pr thermal reversion data for PSM fragments of Arabidopsis PhyA with comparable NTE truncations, remeasured here for completeness, see also Burgie et al.. Because the reaction rates differ by orders of magnitude, rates in two time scales are shown: left panel, 120 min; right panel, 1200 min. SDS-PAGE gels and absorption and Pr-Pfr difference spectra for the preparations are shown in Supplementary Figs. 1 and 2.
Extended Data Fig. 7:
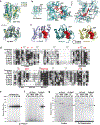
Extended Data Fig. 7:. Arabidopsis (At) PhyA has a compromised ATP-binding pocket and lacks autophosphorylation activity in vitro despite structural similarity to transmitter histidine kinases.
a, Orthogonal views of the HKRD CA region from At PhyA superposed with the same region from At PhyB (PDB ID code 7RZW) and the prokaryotic Walk transmitter HK from Lactobacillis plantarum (Lp) (PDB ID code 4U7O). b and c, Models showing the predicted position of ADP (red) in the At PhyA CA domain based on the binding pocket described in Lp WalK. Residues expected to participate in binding are indicated in (b). ADP clashes with multiple residues in the pocket of this predicted PhyA-ATP model, indicating that conformational shifts in At PhyA induced by ATP or photoactivation would be necessary for binding. Sites with substantial clash are circled. d, Amino acid sequence alignment of the possible ATP-binding pocket of At PhyA and At PhyB with comparable CA domains from bona fide histidine kinases from Bacillus subtilis (Bs YFI), Thermotoga maritima (Tm HK853), L. plantarum (Lp Walk) and Streptococcus mutans (Sm Vick), and with those from bacterial Phys (BphPs) with HK/phosphatase activities from Pseudomonas syringae (Ps BphP) and Deinococcus radiodurans (Dr BphP). Identical and similar amino acids are colored in black and grey boxes, respectively. The signature N, G1/D, F and G2 boxes and ATP lid for histidine kinases are indicated. Arrowheads locate key residues within the ATP-binding pocket that are critical for catalysis. e-g, At PhyA is a poor kinase as compared to Ps BphP based on autophosphorylation assays. Equimolar amounts of recombinant biliproteins were incubated for 1 min to 2 hr at ambient temperature (~24 °C) with 150 μM ATP supplemented with 10 μCi of [γ-32P]-ATP, quenched with SDS-PAGE sample buffer, and measured for 32P incorporation by autoradiography of SDS-PAGE gels. e, Time course for autophosphorylation of Ps BphP as Pfr. f, Comparisons of autophosphorylation activities of At PhyB as Pr and Pfr with those of Ps BphP after 2 hr incubations. Arrowheads locate Ps BphP. The phosphorimager scans are representative of three independent experiments. g, Images of the SDS-PAGE gels stained for protein with Coomassie blue or for the bound bilin by zinc-induced fluorescence.
Fig. 1:
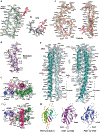
Fig. 1:. Overall 3D structure of the Arabidopsis PhyA dimer.
a, Domain organization of PhyA. Shown are the positions of the PΦB chromophore, the nPAS, GAF and PHY domains, and the NTE, knot lasso (KL) and hairpin (HP) features within the PSM, the internal PAS1 and PAS2 domains, the modulator loop (Mod) preceding the PAS2 domain, and the DHp and CA domains within the HKRD. The numbers delineate domain boundaries within the PhyA polypeptide. Cys323, which links PΦB by a thioether bond, is identified by the red circle. The length of the NTE was extended for clarity. b, Cryo-EM model of the PΦB-binding pocket from the A protomer (sticks) superposed with the EM map (grey mesh). PΦB and the NTE, GAF domain and PHY hairpin carbon atoms are in cyan, black, green and orange, respectively. The nitrogen, oxygen and sulfur atoms are in blue, red and yellow, respectively. The A–D pyrrole rings are labelled. c, Orthogonal views of a surface-rendered, 15 Å resolution 3D EM map of the PhyA dimer, positioning the PAS1 domain (pink) relative to the HKRDs and platform (grey). d, Surface-rendered bottom view of the 3D EM map at 3.2 Å average resolution for the PhyA dimer without the PAS1 domain, which was not resolved in this map. The dashed grey line demarcates protomers A and B. Dimensions of the platform are indicated. e, Orthogonal cartoon views of the atomic model of dimeric PhyA. The NTE, nPAS, GAF, PHY and PAS2/Mod regions are in black/grey, blue, green, yellow/orange and purple/magenta, respectively. The DHp and CA domains within the HKRDs are in teal/light cyan. PΦB is shown in red sticks. Positions of the HP, NTE and KL features are highlighted. The PSMs arrange head-to-tail within the PhyA dimer platform, while the HKRDs arrange head-to-head.
Fig. 2:
Fig. 2:. PΦB configuration and PSM structure of Arabidopsis PhyA strongly resemble those from other plant Phys.
a, Cryo-EM structures of PΦB in protomers A (left) and B (right) from Arabidopsis thaliana (At) PhyA shown in sticks with accompanying EM map of the bilin region (grey mesh) The A–D pyrrole rings, Cys323 that links PΦB via its C31 carbon and the D ring C182 carbon are labelled. PΦB and Cys323 carbon atoms are in cyan and green, while the nitrogens, oxygens and sulfur atoms are in blue, red and yellow, respectively. b, Relative positions of PΦB from protomer B (cyan) with that from a nPAS–GAF domain fragment of G. max (Gm) PhyA assembled with PCB (grey), as determined by X-ray crystallography (PDB 6TC7 (ref. )). c, Orthogonal views of the nPAS–GAF region of At PhyA (coloured) superposed with that from Gm PhyA (grey). The asterisk highlights the point of structural divergence at the dimer interface. PΦB and PCB are in red and grey, respectively. d, Orthogonal views of the PSM region from At PhyA (coloured) superposed with that of full-length At PhyB (grey) (PDB 7RZW (ref. ). The models were superposed via their nPAS–GAF bidomains. The nPAS, GAF, helical spine and hairpin (HP) features are highlighted. eg, Comparisons of the bilin-binding GAF pocket for: the two protomers (A and B) from the At PhyA dimer (e), protomer A of At PhyA (coloured) superposed with that of the nPAS–GAF fragment from Gm PhyA (grey) (f) and protomer A of At PhyA (coloured) superposed with that from At PhyB (grey) (g). The bilin, NTE and GAF domains are coloured as in Fig. 1e. Amino acid numbering refers to the At PhyA polypeptide.
Fig. 3:
Fig. 3:. Unlike Arabidopsis PhyB, the HKRD bidomain from the PhyA dimer does not appear to associate with the platform.
a, Orthogonal views of the cartoon models for dimeric PhyA and PhyB showing the relationships of the platform with the HKRDs. Protomers A and B in PhyA and PhyB are coloured in orange and blue, and magenta and grey, respectively. b, Differing tilts of the HKRDs relative to the platforms in PhyA and PhyB translate into different bends of the helix α1 cruciates within the DHp domains. DHp helices 1α and 2α of the two protomers were aligned by global superposition of the nPAS–GAF–PHY–PAS2 region of each protomer against that of protomer A from PhyA. For clarity, only the DHp is shown and coloured as in a. c, Surface-rendered opposing views of the PhyA EM map illustrate the lack of contact between the HKRDs and platform. The densities of the individual domains are coloured as in Fig. 1d. d, Close inspection of the gap region between the HKRDs and platform in the PhyA EM map. Shown are four cross-sections of the EM map in c, along with the atomic model in sticks, starting from the proximal face of the HKRDs (1) and continuing through to the distal face (4). The GAF, PHY, PAS2 and DHp–CA domain residues from the indicated protomers are coloured in green, orange, magenta and cyan, respectively. Amino acids bordering the gap between the HKRDs and platform are labelled. The dashed oval outlines the α1 helix covalently connecting the HKRD to the platform. Scale bar, 5 Å.
Fig. 4:
Fig. 4:. Comparisons of the helical spine and hairpin motifs from Arabidopsis (At) PhyA with those from PhyB and Synechocystis Cph1.
a, Cartoon views of the helical spines from the Phys in the Pr state. The Phys were superposed based on the GAF domain to highlight the different bends of the helical spines. The A protomer of At PhyA is shown in green in each image. Other structures include the B protomer of At PhyA and the A and B protomers of At PhyB (PDB 7RZW (ref. )), all determined by cryo-EM, and the X-ray crystallographic model of the PSM from Synechocystis sp. PCC6803 (Syn) Cph1 (PDB 2VEA (ref. )). Lys400 positioned at the helical spine bend is indicated for At PhyA. b, Hairpin comparisons by superposing the GAF domains for At PhyA (coloured) with either full-length At PhyB, or PSM fragments from G. max (Gm) PhyB (PDB 6TL4 (ref. )) and Syn Cph1 determined by X-ray crystallography (grey/black). The positions of highly conserved WGG and PRXSF sequences at the hairpin–GAF domain connections are shown in sticks and highlighted with circles. Tyr70 of At PhyA, which is a target of phosphorylation, is shown in red sticks. c, Cavity rimmed by the hairpin permits solvent access to the A pyrrole ring (red). Shown is a surface view of the dimer. The colours for the various domains are as in Fig. 1d,e. PΦB is in red in panels b and c.
Fig. 5:
Fig. 5:. C-terminal domains of Arabidopsis PhyA influence dimerization and Pfr→Pr thermal reversion.
a, Domain organization of full-length (FL) PhyA and truncation mutants lacking the CA (N950), HKRD (N876) and modulator–HKRD (N741) features, or all regions C-terminal to the PSM (N593). The numbers delineate domain boundaries within the PhyA polypeptides. The length of the NTE was extended for clarity. Dashed red lines represent the interactions of PΦB with the NTE at Tyr70 and Ile74. b, Apparent molecular weight of FL PhyA and the various truncations at increasing protein concentrations as measured by SEC. c, Thermal reversion of FL PhyA and the various C-terminal truncations described in a (left). Assembled biliproteins were photoconverted to Pfr with red light and allowed to revert back to Pr in darkness at 25 °C. Normalized data points and fit lines from reactions representative of three technical replicates are shown for absorbance measurements at 725 nm (see Extended Data Table 2 for rate constants, amplitudes and s.d. values). For comparison, simulated thermal reversion kinetics for FL PhyB and comparable truncations assembled with PΦB are shown (right), using rate constants and amplitudes previously determined by Li et al.. SDS–PAGE gels, and absorption and Pr − Pfr difference spectra for the preparations are shown in Supplementary Figs. 1 and 2.
Fig. 6:
Fig. 6:. The dimerization and modulator loop interfaces in the Arabidopsis PhyA platform influence Pfr→Pr thermal reversion.
a, Surface views of the dimeric platform of PhyA highlighting the PAS2–nPAS–GAF interfaces between protomers and the modulator loop (Mod)–PHY interfaces within each protomer. The nPAS, GAF and PAS2–Mod regions are coloured as in Figure 1d; the remaining regions are shown as grey cartoons. PΦB is in red sticks. b, Close-up views of the PAS2–nPAS–GAF domain interface between protomers highlighting key contacts examined by mutagenesis in d and e. The FGDV>VARE, FGW>NTC, ΔTQK and GN>MH mutations reflect substitution of residues present in PhyA with those in Arabidopsis PhyB. c, Close-up views of the modulator–PHY interface within protomers. Residues examined by mutagenesis in d are in green. d,e, Dimerization measured by SEC (d) and thermal reversion kinetics (e) of N876 truncation mutations affecting the residues located in b and c. The boundaries for monomer and dimer molecular weights were calculated by a global fit of all SEC data with the N876 construction. Normalized data points and fit lines for the thermal reversion reactions are representative of three technical replicates determined from absorbance measurements at 725.nm (see Extended Data Table 2 for rate constants, amplitudes and s.d. values). SDS–PAGE gels, and absorption and Pr − Pfr difference spectra for the preparations are shown in Supplementary Figs. 1 and 2.
Fig. 7:
Fig. 7:. Modifying the platform interface in Arabidopsis PhyA either diminishes or enhances the repressive influence of the HKRD on Pfr→Pr thermal reversion.
a, UV–vis spectroscopy of FL PhyA either wild type or harbouring various site-directed mutants altering the modulator or platform interfaces. Shown are the absorption spectra for Pr and samples that have been photoconverted to equilibrium with saturating red light (RL; mostly Pfr). The Pr − Pfr difference spectra are shown at 70% magnitude (offset black line). Absorption peak maxima are identified. SCR values are shown in parentheses. Spectra are the average of three technical replicates. b,c, Apparent molecular weight values as a function of protomer concentration (b) and thermal reversion kinetics at 22 °C (c) for FL PhyA and the indicated mutants. Normalized data points and fit lines from thermal reversion reactions are representative of three technical replicates determined from absorbance measurements at 725 nm (see Extended Data Table 2 for rate constants, amplitudes and s.d. values). SDS–PAGE gels of the preparations are shown in Supplementary Fig. 1.

Similar articles

Cited by

References

    1. Legris M, Ince YC & Fankhauser C Molecular mechanisms underlying phytochrome-controlled morphogenesis in plants. Nat. Commun. 10, 5219, doi:10.1038/s41467-019-13045-0 (2019). - DOI - PMC - PubMed
    1. Burgie ES & Vierstra RD Phytochromes: an atomic perspective on photoactivation and signaling. Plant Cell 26, 4568–4583, doi:10.1105/tpc.114.131623 (2014). - DOI - PMC - PubMed
    1. Franklin KA & Quail PH Phytochrome functions in Arabidopsis development. J. Exp. Bot. 61, 11–24, doi:10.1093/jxb/erp304 (2010). - DOI - PMC - PubMed
    1. Legris M et al. Phytochrome B integrates light and temperature signals in Arabidopsis. Science 354, 897–900, doi:10.1126/science.aaf5656 (2016). - DOI - PubMed
    1. Jung JH et al. Phytochromes function as thermosensors in Arabidopsis. Science 354, 886–889, doi:10.1126/science.aaf6005 (2016). - DOI - PubMed

Publication types