. 2023 Aug;30(8):1216-1223.
doi: 10.1038/s41594-023-01008-5. Epub 2023 Jun 8.

RNA polymerase II depletion from the inactive X chromosome territory is not mediated by physical compartmentalization

Affiliations

RNA polymerase II depletion from the inactive X chromosome territory is not mediated by physical compartmentalization

Samuel Collombet et al. Nat Struct Mol Biol. 2023 Aug.

Abstract

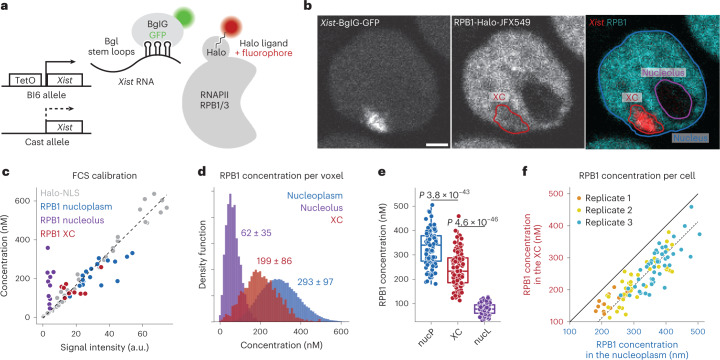
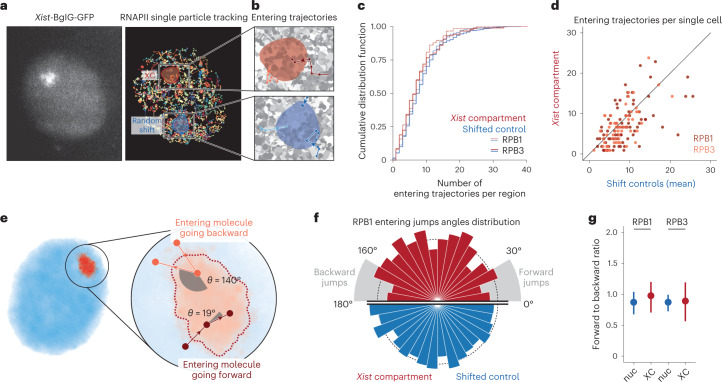
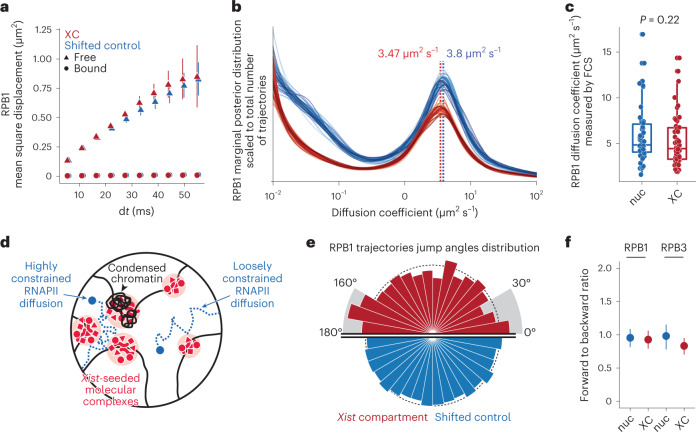
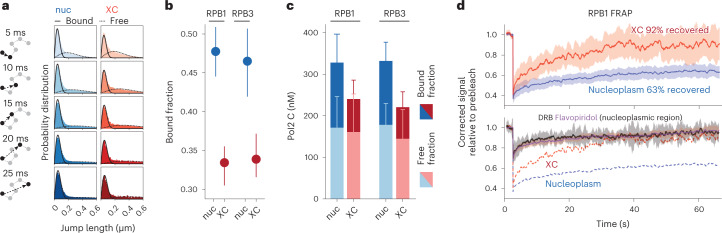
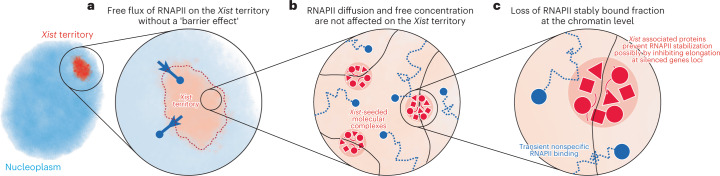
Subnuclear compartmentalization has been proposed to play an important role in gene regulation by segregating active and inactive parts of the genome in distinct physical and biochemical environments. During X chromosome inactivation (XCI), the noncoding Xist RNA coats the X chromosome, triggers gene silencing and forms a dense body of heterochromatin from which the transcription machinery appears to be excluded. Phase separation has been proposed to be involved in XCI, and might explain the exclusion of the transcription machinery by preventing its diffusion into the Xist-coated territory. Here, using quantitative fluorescence microscopy and single-particle tracking, we show that RNA polymerase II (RNAPII) freely accesses the Xist territory during the initiation of XCI. Instead, the apparent depletion of RNAPII is due to the loss of its chromatin stably bound fraction. These findings indicate that initial exclusion of RNAPII from the inactive X reflects the absence of actively transcribing RNAPII, rather than a consequence of putative physical compartmentalization of the inactive X heterochromatin domain.


Conflict of interest statement

The authors declare no competing interests.

Figures

Fig. 1
Fig. 1. RNAPII concentration in the Xist compartment.
a, Scheme of Xist and RNAPII tagging for combined live-cell imaging. b, Representative image (from 107 different single cells) of confocal microscopy of Xist (BglG-GFP) and RNAPII (RPB1-Halo) in live cells (single z stack) after 24 h of Xist induction (doxycycline treatment) with overlaid segmentation of nucleus, nucleoli and Xi (Methods). Scale bar, 2 μm. c, Calibration of signal intensity from point scanning imaging with FCS measured concentrations. Each dot represents a single measurement from a single cell. The linear calibration is established only on the freely diffusing Halo-NLS. Note that fluorescence intensity in the nucleolus was below the threshold of robust FCS measurement (Extended Data Fig. 2d), leading to artifactual concentration estimation. d, Calibrated RNAPII (RPB1) concentration per voxel for a single cell (cell shown in b), based on the calibration in c. The average concentration per region for this cell is indicated (±95% confidence interval). e, Distribution of average concentration per region per cell, for all cells after 24 h of Xist induction. Each dot represents a single cell (n = 107). P values of the differences are indicated on top (t-test two-sided, paired data). Boxplots represent the median (center) first and third quartile (hinges) and ±1.5 × IQR (whiskers). f, Average RPB1 concentration in the XC versus nucleoplasm. Each dot represents a single cell.
Fig. 2
Fig. 2. Characterization of RNAPII flux with XC.
a, Example of Xist-BGL-GFP imaging and RNAPII RPB1 SPT (5.477 ms between frame, 1 ms exposure, 3 min tracking) in the same cell. Each trajectory is shown with random colors. The red area shows the segmentation of the Xist compartment, and the blue area a random spatial shift of this region (Methods). b, Enlargement of the XC region and random shift to highlight entering trajectories of RNAPII into the XC. c, Cumulative distribution function of the number of entering trajectories in the XC (red) and random shifts (blue) for RPB1 (plain line) and RPB3 (dashed line). Only trajectories with a mean square root displacement (MSRD) > 200 nm were selected to ensure using only freely diffusing molecules (Methods). d, Scatter plot of the number of trajectories entering the XC (y axis) and the average number of trajectories entering the shift controls (x axis) in the same single cell, for RPB1 (red) and RPB3 (orange). e, If a molecule ‘bounces back’, its trajectory should display large angles between jumps, while molecules that ‘move forward’ should display small angles. Molecules in Brownian motion in free space should show no preference. f, Distributions of entering trajectories angles between the entering jump and the following one (as depicted in e) for RPB1 trajectories entering the XC (red, n = 556 entering jumps) or shifted control regions (blue, n = 4,408 entering jumps). The radius of the bar represents the density of counts. g, Ratio of forward angles (0 to 30°)/backward angles (160 to 180°) as previously done,. The dot represents the fraction estimated from all pooled trajectories (n = 556/4,408 and 346/3,310 trajectories entering XC/shift control region, for RBP1 and RPB3, respectively), and the error bar represents the standard deviation (centered on the mean estimated value) from 50 bootstrap subsampling of n = 250 entering jumps (Methods).
Fig. 3
Fig. 3. RNAPII diffusion on the Xi.
a, MSD at increasing time interval dt for RPB1 SPT trajectories inside Xist compartment (red) or in shifted control regions (blue, Fig. 2b). Trajectories are split into free and bound based on their average jump length (MSRD > 200 nm for free, and <100 nm for bound), as in Fig. 2. The dots and error bars represent the mean and standard deviation of 50 bootstraps subsampling of 3,000 trajectories (Methods). b, Distribution of diffusion coefficient inferred using spagl (Methods) for RPB1 SPT trajectories inside the Xist compartment and in shifted control regions. The marginal posterior distribution is scaled to the average number of trajectories in Xist compartment and in shifted control regions. c, Diffusion coefficients of RPB1 free fraction based on FCS measurement inside the Xist compartment and in the nucleoplasm, and fitting a two-component model (bound and free, Methods). Each dot represents a single measurement in a single cell (n = 53). The indicated P value is calculated with a t-test (two-sided, paired data). Boxplots represent the median (center) first and third quartiles (hinges) and ±1.5 × IQR (whiskers). d, Schematic representing how different environments might constrain RNAPII (in blue) diffusion. On the left side, Xist-seeded molecular complexes (in red) and dense chromatin (black) occupy a significant space that constrains RNAPII diffusion. On the right side, protein complexes and chromatin do not occupy a significantly higher space and RNAPII diffusion is not affected. e, Distributions of jump angles for RPB1 trajectories entering the XC (red, top) or control regions (blue, bottom). The radius of the bar represents the density of counts. f, Ratio of forward angles (0 to 30°)/backward angles (150 to 180°). The dots represent the fraction estimated from all free trajectories (MSRD > 200 nm, n = 1410/13,335 and 834/8,826 trajectories in XC/shift, for RBP1 and RPB3, respectively), and the error bars represent the standard deviation (centered on the mean estimated value) from 50 bootstrap subsampling of 500 free trajectories (Methods).
Fig. 4
Fig. 4. RNAPII dynamics on XC.
a, Fitting of a two-component model (bound versus freely diffusing molecules) to the distribution of jump length (that is, distance between localization n and n + dt from the same trajectory) at different time scales, for trajectories inside the XC or outside (nuc). All data from 96 single cells are pooled. b, Estimates of the bound fraction inside and outside the XC, for RPB1 and RPB3. The dots represent the fraction estimated from all pooled trajectories, and the error bars the standard deviation (centered on the mean estimated value) from 50 bootstrap subsampling of 3,000 trajectories (Methods). c, Concentration of RPB1 and RPB3 (from Fig. 1f and Extended Data Fig. 2g) scaled by the bound and free fraction from b. The error bars represent the 95% confidence interval for the product of concentration and bound/free fraction (centered on the product value) and is calculated using the delta method (Methods). d, FRAP experiment for the XC (red) or control nucleoplasmic region (blue) in the top panel, and in nucleoplasmic regions after treatment with DRB (black) or Flavopiridol (purple) in the bottom panel. Signal is normalized to the signal before bleaching (Methods). The line represents the mean of signals (n = 15 cells) and the shade its 95% confidence interval. In the bottom panel, the dotted lines represent the mean of signal for XC and nucleoplasmic regions in untreated cells and are the same as the plain lines in the top panel.
Fig. 5
Fig. 5. Summary of RNAPII dynamics on the Xist territory at multiple scales.
RNAPII can freely diffuse through the Xist-coated territory during XCI, but loses its stable bound fraction on chromatin.
Extended Data Fig. 1
Extended Data Fig. 1. Cell line characterisation.
a scheme of genetic engineering for RPB1-Halo, RPB3-Halo and Xist-Bgl. b. Western blot for RPB1 and RPB3 in untagged cell line, RPB1-Halo and RPB3-Halo. Whole image of the WB are shown in Source Data. c. Quantification of the westernblot signal from B. d. Allelic expression of Rnf12, Huwe1 and G6pdx measured by RNA pyrosequencing in cells before (Ct) and after 24 h Xist induction. e. Representative examples of RNA FISH for Xist and Huwe1 in cells before (Ct) and after 24 h Xist induction. f. Quantifications of the percentage of cells showing Xist induction (XaXi, red) no induction (XaXa, blue) or other phenotype before and after 24 h Xist induction. Source data
Extended Data Fig. 2
Extended Data Fig. 2. Live imaging of Xist RNA and RNAPII, segmentation and FCS-CI.
a Summary of the 3D segmentation workflow using Ilastik. b 3D rendering of Xist-BglG-GFP and RPB1-Halo signals in live-cell confocal imaging; and of the nucleoplasm, XC and nucleolus segmentation. c Representative image (from 92 single cells) of confocal microscopy of Xist-BglG-GFP and RPB3-Halo in live cells (single Z stack) after 24 h of Xist induction (doxycycline treatment) with overlaid segmentation of nucleus, nucleoli and Xi (see Methods).
Extended Data Fig. 3
Extended Data Fig. 3. FCS Calibrated imaging.
a. FCS-CI workflow. b. Representative example of signal intensities and fluctuation during FCS measurement in the nucleoplasm, XC and nucleolus. c. Calibration of RPB3 signal intensity from point scanning imaging with FCS measured concentrations. Each dot represents a single measurement from a single cell. The linear calibration is established only on the freely diffusing Halo-NLS. d. Calibrated RPB3 concentration per voxel for the nucleus shown in C, based on the calibration in E. the average concentration per region is indicated (± 95% confidence interval). e. distribution of RPB3 average concentration per region per cell after 24 h of Xist induction. Each dot represents a single cell (n = 92). P-values of the differences are indicated on top (t-test two sided, paired data). Boxplots represent the median (center) 1st and 3rd quartile (hinges) and +/− 1.5*IQR (whiskers). f. RPB3 Concentration in the XC versus nucleoplasm. Each dot represents a single cell. (g) Distribution of average RPB1 concentration per region per cell, for all cells after Xist induction for 24 h (left) and 5 days (right). Each dot represents a single cell. (h) Average RPB1 Concentration in the XC versus nucleoplasm, colour by time of treatment (24 h in yellow, 5 days in green). Each dot represents a single cell. Boxplots represent the median (center) 1st and 3rd quartile (hinges) and +/− 1.5*IQR (whiskers). (i) and (j) are the same as (G) and (H) for RPB3. Boxplots represent the median (center) 1st and 3rd quartile (hinges) and +/− 1.5*IQR (whiskers).
Extended Data Fig. 4
Extended Data Fig. 4. Single particle tracking data analysis.
a. Representative example of RPB3-Halo single particle tracking after 24 h Xist induction. b. workflow of the SPT data segmentation and XC shifted control regions. c. distribution of jump angles for RBP3 jump entering the XC.
Extended Data Fig. 5
Extended Data Fig. 5. Characterisation of RNAPII diffusion on the Xi.
a. Mean square displacement (MSD) at increasing time interval dt for RPB3 SPT trajectories inside Xist compartment (red) or in shifted control regions (blue, see Extended Data Fig. 4b). Trajectories are splitted into free and bound based on their average jump length (MSRD > 200 nm for free, and <100 nm for bound), as in Fig. 2. The dot and error bar represent the mean and standard deviation of 50 bootstraps subsampling of 3000 trajectories (see Methods). b. Velocity Auto-Correlation (VAC) for RPB1/3 SPT trajectories inside the Xist compartment (red) or in shifted control regions. The dot and error bar represent the mean and standard deviation of 50 bootstraps subsampling of 3000 trajectories (see Methods). c. Distribution of diffusion coefficient inferred using spagl (see Methods) for RPB1 SPT trajectories inside the Xist compartment and in shifted control regions. The marginal posterior distribution is scaled to the average number of trajectories in Xist compartment and in shifted control regions. d. e. Diffusion coefficients of RPB3 free fraction based on FCS measurement inside the Xist compartment and in the nucleoplasm, and fitting a two component model (bound and free, see Methods). Each dot represents a single measurement in a single cell (n = 20). The indicated P value is calculated with a t-test (two sided, paired data). Boxplots represent the median (center) 1st and 3rd quartile (hinges) and +/− 1.5*IQR (whiskers). f. g. RPB1 diffusion anomaly exponent from FCS measurement inside and outside XC. Each dot represents a single cell (n = 53). The indicated P-value is calculated with a t-test (two sided, paired data). Boxplots represent the median (center) 1st and 3rd quartile (hinges) and +/− 1.5*IQR (whiskers). h. Same as G for RPB3 (n = 20). The indicated P-value is calculated with a t-test (two sided, paired data). Boxplots represent the median (center) 1st and 3rd quartile (hinges) and +/− 1.5*IQR (whiskers).
Extended Data Fig. 6
Extended Data Fig. 6. Single particle tracking and FRAP.
a. Representative example of histone H2B-Halo single particle tracking after 24 h Xist induction. b. Representative example of Nls-Halo single particle tracking after 24 h Xist induction. c. Distribution of jump length in single particle tracking RPB1, RPB3 and the ‘bound’ histone H2B-Halo and ‘free’ Halo-NLS controls, and d. Estimated bound fractions. The dot represents the fraction estimated from all pooled trajectories, and the error bar the standard deviation (centered on the mean estimated value) from 50 bootstrap subsampling of 3,000 trajectories (see Methods). e. Distribution of tracking duration for bound RPB1 molecules (MSRD < 100 nm) inside and outside XC. f. Fluorescence recovery after photobleaching (FRAP) signal as in Fig. 3d, but where the signal in XC is scaled to its prebleached intensity relative to the nucleoplasmic signal. Left panel: the dots represent the mean of signals (n = 15 cells) and the error bars the 95% confidence interval. Right panel: the line represents the mean of signals (n = 15 cells) and the shade its 95% confidence interval.

References

    1. Okamoto I, Otte AP, Allis CD, Reinberg D, Heard E. Epigenetic dynamics of imprinted X inactivation during early mouse development. Science. 2004;303:644–649. doi: 10.1126/science.1092727. - DOI - PubMed
    1. Chaumeil J, Le Baccon P, Wutz A, Heard E. A novel role for Xist RNA in the formation of a repressive nuclear compartment into which genes are recruited when silenced. Genes Dev. 2006;20:2223–2237. doi: 10.1101/gad.380906. - DOI - PMC - PubMed
    1. Fraser P, Bickmore W. Nuclear organization of the genome and the potential for gene regulation. Nature. 2007;447:413–417. doi: 10.1038/nature05916. - DOI - PubMed
    1. Chow JC, et al. LINE-1 activity in facultative heterochromatin formation during X chromosome inactivation. Cell. 2010;141:956–969. doi: 10.1016/j.cell.2010.04.042. - DOI - PubMed
    1. McHugh CA, et al. The Xist lncRNA interacts directly with SHARP to silence transcription through HDAC3. Nature. 2015;521:232–236. doi: 10.1038/nature14443. - DOI - PMC - PubMed

Publication types