. 2023 Sep;7(9):1113-1128.
doi: 10.1038/s41551-023-01048-8. Epub 2023 Jun 8.

Universal redirection of CAR T cells against solid tumours via membrane-inserted ligands for the CAR

Affiliations

Universal redirection of CAR T cells against solid tumours via membrane-inserted ligands for the CAR

Angela Q Zhang et al. Nat Biomed Eng. 2023 Sep.

Abstract

The effectiveness of chimaeric antigen receptor (CAR) T cell therapies for solid tumours is hindered by difficulties in the selection of an effective target antigen, owing to the heterogeneous expression of tumour antigens and to target antigen expression in healthy tissues. Here we show that T cells with a CAR specific for fluorescein isothiocyanate (FITC) can be directed against solid tumours via the intratumoural administration of a FITC-conjugated lipid-poly(ethylene)-glycol amphiphile that inserts itself into cell membranes. In syngeneic and human tumour xenografts in mice, 'amphiphile tagging' of tumour cells drove tumour regression via the proliferation and accumulation of FITC-specific CAR T cells in the tumours. In syngeneic tumours, the therapy induced the infiltration of host T cells, elicited endogenous tumour-specific T cell priming and led to activity against distal untreated tumours and to protection against tumour rechallenge. Membrane-inserting ligands for specific CARs may facilitate the development of adoptive cell therapies that work independently of antigen expression and of tissue of origin.


Conflict of interest statement

A.Q.Z., A.H., L.E.C. and D.J.I. have submitted a patent application filed by MIT related to the data presented in this work. D.J.I. is a consultant and equity holder in Elicio Therapeutics, which has licensed rights to the MIT intellectual property mentioned above. The other authors declare no interests.

Figures
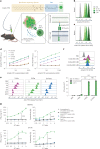
Fig. 1
Fig. 1. Amph-FITC tags cancer cells for CAR T cell-mediated killing.
a, Schematic of amph-FITC structure, insertion into cancer cell membranes, and recognition by FITC CAR T cells. Created with Biorender.com. b,c, B16F10 murine melanoma cells were incubated with amph-FITC at indicated concentrations for 30 min at 37 °C in PBS, stained with an anti-FITC antibody and analysed by flow cytometry. Shown are representative histograms of total FITC (b) and anti-FITC signals (c). d, B16F10 cells were incubated with amph-FITC conjugates of varying PEG MW as in b at the indicated concentrations and then stained with anti-FITC for flow cytometry analysis. Shown are median fluorescence intensities (MFIs) of FITC (left) and anti-FITC (right) signals. e, Kinetic analysis of anti-FITC MFI of B16F10 cultured in RPMI following tagging in 100 nM amph-FITC. f, Histograms of MC38 colon cancer cells labelled with titrated concentrations of amph-FITC to yield the same FITC fluorescence per cell (top). Cancer cells were subsequently cultured with 4m5.3-28z CAR T cells at a 1:1 E:T ratio. g,h, Co-culture of FITC-specific E2-m28z CAR T cells or control untransduced T cells with B16F10 (g) or CT-2A (h) cancer cells with or without coating by 100 nM amph-FITC at a range of E:T ratios. Shown are mean ± s.d. from duplicate samples (all biological replicates). P values were determined by two-way ANOVA. NS, not significant; ***P < 0.001, ****P < 0.0001. Source data
Fig. 2
Fig. 2. Intratumoural administration of amph-FITC decorates cancer cells and draining LNs with minimal labelling of other tissues.
C57BL/6 mice were inoculated with 106 B16F10 tumours in the flank, following by i.t. injection of 10 nmol DSPE-PEG2k-FITC when tumours reached 25 mm2 in size. a, Confocal microscopy of B16F10 tumours 24 h after i.t. amph-FITC injection. Shown is one representative histological image from two tumours analysed. b, A total of 106 B16F10 cells were inoculated in C57BL/6 mice (n = 4 per group) and injected intratumourally with 10 nmol amph-FITC when tumours were ~25 mm2 in size. Two hours later, tumours were isolated with neighbouring connective tissue, cryosectioned and stained with anti-Trp1 antibody to identify melanoma cells, anti-FITC and a cell membrane stain. Shown are representative sections from one PBS control and two amph-FITC-injected tumours. Scale bars, 200 μm. c, Biodistribution of amph-FITC 24 h following i.t. injection into B16F10 tumours (n = 5 animals per group). d, Representative flow cytometry plots of amph-FITC-injected B16 tumours (gated on CD45 cells) stained with anti-FITC to detect surface-exposed antigen. e, Immunophenotyping of B16F10 tumours in mice without prior LD at 1, 24 and 48 h following amph-FITC injection, quantifying the proportion of FITC+ anti-FITC+ double-positive cells (left), and density of FITC+ anti-FITC+ cells in the tumour (right) (n = 5 animals per group). All replicates are biological replicates. P values were determined by Mann–Whitney U test (d) or unpaired Student’s t-test (e). Shown are mean ± s.d. NS, not significant; *P < 0.05, **P < 0.01, ***P < 0.001, ****P < 0.0001. Source data
Fig. 3
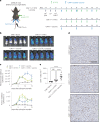
Fig. 3. FITC CAR T cells infiltrate into tumours and expand in the presence of amph-FITC.
a, Schematic and timeline of therapy in B16F10 tumours, including CAR T booster vaccine. Created with Biorender.com. b,c, Localization of FLuc+ E2-m28z FITC CAR T cells in B16F10 tumour-bearing mice on day 8 (b) and quantification of whole mouse (top) and tumour (bottom) radiance (c) (n = 5 animals per group, biological replicates). White dashed circle indicates location of flank tumour. d, Representative immunohistochemistry on CT-2A tumours treated with i.t. amph-FITC ± amph-FITC vaccine, staining for CD8, at day 12 post-adoptive transfer. Scale bar, 50 µm. e, Quantification of CD8+ T cells per mm2 per field of view (FOV) in 10 FOV per tumour, n = 10 FOVs per condition. Replicates are technical replicates to capture T cell infiltration across many FOVs within the tumour. P values were determined by one-way ANOVA with Tukey’s post hoc test. Error bars represent standard error of the mean (c) and s.d. (e). NS, not significant; ****P < 0.0001. Source data
Fig. 4
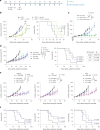
Fig. 4. Murine FITC CAR T cells combined with i.t. amph-FITC have therapeutic activity in models of melanoma and glioma.
a, Schematic and timeline of therapy for CT-2A tumour therapy. b, Tumour growth and overall survival of C57BL/6 mice (n = 5 animals per group) bearing B16F10 tumours treated with E2-28z CAR T cells as in Fig. 3a with indicated combinations. c, Tumour growth of CT-2A tumour-bearing C57BL/6 mice (n = 5 animals per group) treated with amph-FITC, FITC CAR T cells and vaccine composed of only CD8+ T cells or a combination of CD4+ and CD8+ T cells. d, Tumour growth and survival following treatment of CT-2A tumour-bearing mice (n = 5 animals per group) with CARs with low (E2.7), medium (E2) and high (4m5.3) affinities for FITC, including i.t. amph-FITC and vaccine. e,f, Tumour growth (e) and survival (f) of CT-2A tumour-bearing mice treated with CARs bearing CD28 or 4-1BB co-stimulatory domains across a range of binding affinities in combination with IT amph-FITC and amph-FITC vaccination (n = 5 animals per group). Error bars represent standard error of the mean. All replicates are biological replicates. P values were determined by two-way ANOVA (tumour growth curves) and log-rank (Mantel–Cox) test (survival curves). NS, not significant; *P < 0.05, **P < 0.01, ***P < 0.001. Source data
Fig. 5
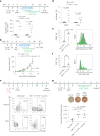
Fig. 5. Amph-FITC therapy induces epitope spreading to elicit an endogenous antitumour T cell response.
a, Flow cytometry on treated CT-2A tumours on day 34 after adoptive transfer of CD45.2+ FITC CAR T cells, quantifying CD4+ versus CD8+ CD45.1+ tumour-infiltrating host T cells (n = 4 animals per group). b, CT-2A tumour-bearing mice previously cured with CAR T and amph-FITC therapy were rechallenged versus naïve mice with 106 CT-2A cancer cells on the opposite flank at day 92 following adoptive transfer (n = 5 animals per group). c,d, Representative flow plots of DCs (c) in tumours and TDLN of mice bearing tdTomato+ CT-2A tumours at 12 days post-adoptive transfer and quantification (d) of tdTomato+ DCs in TDLN (n = 3 animals per group for no CAR T group, n = 4 for CAR T + i.t. FITC group). e,f, Expression of activation markers CD86 (e) and CCR7 (f) in TDLN DCs at 12 days post-adoptive transfer with representative histograms (n = 3 animals per group for no CAR T group, n = 5 for CAR T + i.t. FITC group). g, ELISPOT on spleens of CT-2A tumour-bearing mice on day 37 post adoptive transfer (n = 5 animals per group). Splenocytes were stimulated with irradiated CT-2A cancer cells. All replicates are biological replicates. P values were determined by unpaired Student’s t-test. Error bars represent s.d. NS, not significant; *P < 0.05, **P < 0.01. Source data
Fig. 6
Fig. 6. Local amph-FITC redirection of CAR T cells leads to a systemic antitumour immune response.
ac, C57BL/6 mice (untreated n = 10, treated n = 8) were inoculated with CT-2A tumour cells on opposite flanks, then treated with FITC-CAR T cells, amph-FITC vaccination and i.t. amph-FITC only in the 1° lesion. Shown are the timeline and schematic of the treatment (a), mean tumour size (b) and overall survival (c) over time. Created with Biorender.com. df, C57BL/6 mice (n = 10 per group) were inoculated with B16F10 tumour cells on opposite flanks, then treated with FITC-CAR T cells, amph-FITC vaccination and i.t. amph-FITC only in the 1° lesion. Shown are the timeline of the treatment (d), mean tumour size (e) and overall survival (f) over time. Error bars represent standard error of the mean. All replicates are biological replicates. P values were determined by two-way ANOVA (tumour growth curves) and log-rank (Mantel–Cox) test (survival curves). NS, not significant; **P < 0.01; ***P < 0.001, ****P < 0.0001. Source data
Fig. 7
Fig. 7. Amph-FITC CAR T cell therapy is efficacious when translated to human FITC CAR T cells in human solid tumour xenografts.
a, Expression of humanized FITC CARs. b, Schematic and timeline of therapy in NSG mice. Created with Biorender.com. c,d, Bioluminescence imaging (c) and quantification (d) of FLuc+ CAR T cell trafficking in NSG mice (n = 5 animals per group). e, MSTO-211H tumour growth of NSG mice following treatment with E2-hBBz CAR T cells (n = 10 animals per group). All replicates were biological replicates. P values were determined by two-way ANOVA. Error bars represent standard error of the mean. **P < 0.01; ***P < 0.001. NS, not significant. Source data
Extended Data Fig. 1
Extended Data Fig. 1. FITC CAR T cells expand in the peripheral blood and tumour with amph-FITC injection.
a Timeline of therapy in MC38 tumour-bearing C57BL/6 mice. b, c CAR T cells in the peripheral blood (b, day 4) and tumour (c, day 11) (n = 5 animals/group). p values were determined by unpaired Student’s t test. Error bars represent standard deviation. *p < 0.05, **p < 0.01, ***p < 0.001, ****p < 0.0001. Source data
Extended Data Fig. 2
Extended Data Fig. 2. Chemotherapy-based vs. irradiation-based lymphodepletion.
a Groups of C57BL/6 mice bearing B16F10 tumours (n = 5 animals/group) were lymphodepleted with 250 mg/kg cyclophosphamide and 50 mg/kg fludarabine administered one day before adoptive cell transfer, followed by treatment with intratumoural amph-FITC and amph-FITC vaccine boosting as indicated. b Comparison of tumour growth in mice left untreated (n = 7) vs. animals receiving lymphodepleting regimen of 5 Gy TBI (n = 8) seven days after being inoculated with 3×10⁶ CT-2A cells. p values were determined by two-way ANOVA. Error bars represent standard error of the mean. ns, not significant; **p < 0.01. Source data
Extended Data Fig. 3
Extended Data Fig. 3. Optimization of FITC CAR T and amph-FITC therapy.
a Comparison of tumour growth (left) and survival (right) in CT-2A tumour-bearing mice treated with CAR T cells followed by intratumoural amph-FITC every 3 or 6 days (n = 5 animals/group). b Comparison of tumour growth (left) and survival (right) in CT-2A tumour-bearing mice treated with FITC CAR T cells prepared in mIL-2 or a combination of mIL-7 and mIL-15 (n = 5 animals/group). P values were determined by two-way ANOVA (tumour growth curves) and log-rank (Mantel-Cox) test (survival curves). Error bars represent standard deviation. n.s., not significant; *p < 0.05, **p < 0.01, ***p < 0.001, ****p < 0.0001. Source data
Extended Data Fig. 4
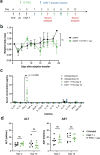
Extended Data Fig. 4. FITC CAR T and amph-FITC therapy elicit minimal toxicity.
a Timeline of therapy in CT-2A tumour-bearing C57BL/6 mice. b Body weight of B16F10 tumour-bearing C57BL/6 mice over the course of therapy (n = 5 animals/group). c, d Quantification of serum cytokines (c, n = 5 animals/group) and serum ALT and AST (d, n = 7 animals/group) at 3 and 12 days post-adoptive transfer. P values were determined by two-way ANOVA (body weight curves) or unpaired Student’s t test. Error bars represent standard error of the mean (b) and standard deviation (c). *p < 0.05, **p < 0.01, ***p < 0.001, ****p < 0.0001. Source data
Extended Data Fig. 5
Extended Data Fig. 5. Expansion and tumour localization of human FITC CAR T cells in NSG mice.
a In vitro cytotoxicity of FITC CAR T cells with amph-FITC+ MSTO-211H human mesothelioma cancer cells at 1:1 ET ratio. b Comparison of luciferase signal from fLuc+ CAR T cells over time in mice treated with only CD8+ 4m5.3-h28z CAR T cells or a combination of CD4+ and CD8+ CAR T cells (n = 5 animals/group). c, d Gating strategy for immunophenotyping human CAR T cells (c) and phenotypic composition of CAR T cells recovered from spleens of NSG mice 23 days post-adoptive transfer (d, n = 5 animals/group). e Quantification of CD4+ and CD8+ CAR T cells in the spleen on day 40 post-adoptive transfer (n = 5 animals/group). f Whole mouse radiance over time as a surrogate of CAR T cell expansion (n = 5 animals/group). Error bars represent standard error of the mean. Source data

Similar articles

Cited by

References

    1. Maude SL, et al. Tisagenlecleucel in children and young adults with B-cell lymphoblastic leukemia. N. Engl. J. Med. 2018;378:439–448. doi: 10.1056/NEJMoa1709866. - DOI - PMC - PubMed
    1. Neelapu S, et al. Axicabtagene ciloleucel CAR T-cell therapy in refractory large B-cell lymphoma. Physiol. Behav. 2016;176:139–148. - PMC - PubMed
    1. Mullard A. FDA approves fourth CAR-T cell therapy. Nature. 2021;20:166. - PubMed
    1. Munshi NC, et al. Idecabtagene vicleucel in relapsed and refractory multiple myeloma. N. Engl. J. Med. 2021;384:705–716. doi: 10.1056/NEJMoa2024850. - DOI - PubMed
    1. Berger TR, Maus MV. Mechanisms of response and resistance to CAR T cell therapies. Curr. Opin. Immunol. 2021;69:56–64. doi: 10.1016/j.coi.2021.02.010. - DOI - PubMed

Publication types