. 2023 Jun 8;24(1):135.
doi: 10.1186/s13059-023-02973-2.

Protein length distribution is remarkably uniform across the tree of life

Affiliations

Protein length distribution is remarkably uniform across the tree of life

Yannis Nevers et al. Genome Biol. .

Abstract

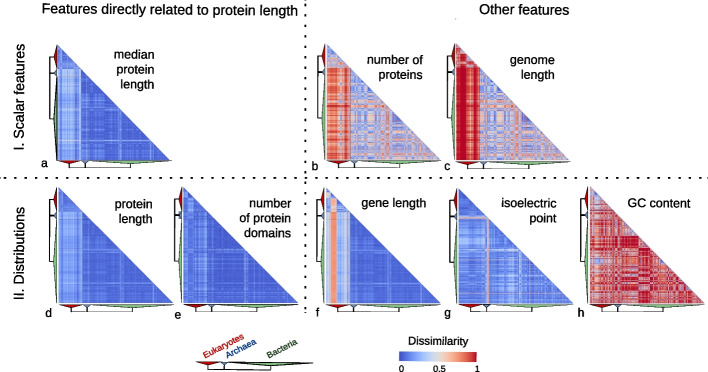
Background: In every living species, the function of a protein depends on its organization of structural domains, and the length of a protein is a direct reflection of this. Because every species evolved under different evolutionary pressures, the protein length distribution, much like other genomic features, is expected to vary across species but has so far been scarcely studied.

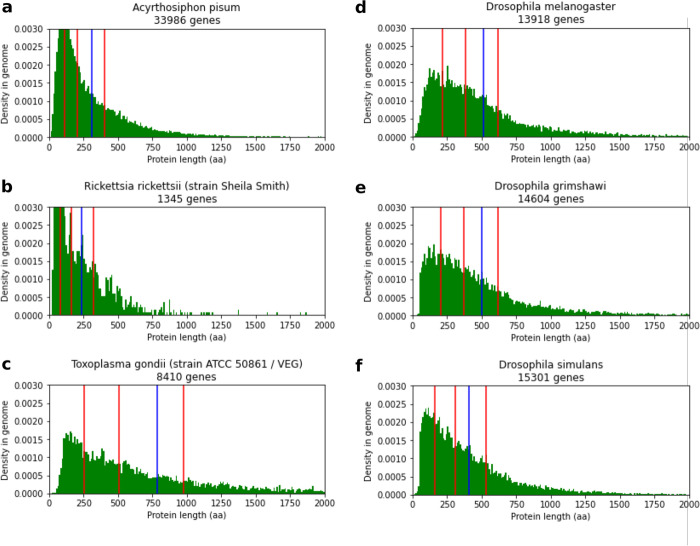
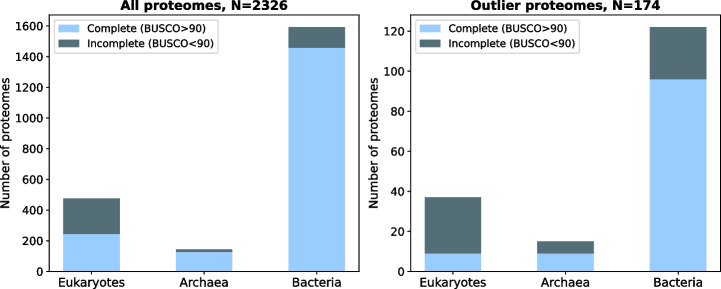
Results: Here we evaluate this diversity by comparing protein length distribution across 2326 species (1688 bacteria, 153 archaea, and 485 eukaryotes). We find that proteins tend to be on average slightly longer in eukaryotes than in bacteria or archaea, but that the variation of length distribution across species is low, especially compared to the variation of other genomic features (genome size, number of proteins, gene length, GC content, isoelectric points of proteins). Moreover, most cases of atypical protein length distribution appear to be due to artifactual gene annotation, suggesting the actual variation of protein length distribution across species is even smaller.

Conclusions: These results open the way for developing a genome annotation quality metric based on protein length distribution to complement conventional quality measures. Overall, our findings show that protein length distribution between living species is more uniform than previously thought. Furthermore, we also provide evidence for a universal selection on protein length, yet its mechanism and fitness effect remain intriguing open questions.

Keywords: Comparative genomics; Genome annotation; Genome evolution; Protein length.


Conflict of interest statement

The authors declare that they have no competing interests.

Figures

Fig. 1
Fig. 1
Distributions of protein length, GC content, and gene length (x-axis in logarithmic scale), for selected model eukaryotic species (light green), bacterial and archaeal species (blue). Summary statistics are shown as lines at the bottom of the distribution: red lines indicate the first quartile, median, and third quartile, and the blue line indicates the mean. An alternative representation with protein length on a logarithmic scale is available in Additional File 2: Fig. S1
Fig. 2
Fig. 2
Heatmaps of pairwise species comparison of genomic features. Row and columns are species, ordered by taxonomy. I Heatmaps of dissimilarity of three genomic features for every comparison of species. The dissimilarity measure used is an inverted ratio of the pair. An inverted ratio close to 0, in cool colors, means the compared values are identical or very similar. An inverted ratio higher than 0.5, in warm colors, represents a more than 2-fold difference between the highest and lowest values in the pair. Features compared are (a) median protein length, (b) protein number, and (c) genome length. II Heatmaps of dissimilarity between distributions of gene-centric features for every comparison of species. The dissimilarity measure used is the Kolmogorov–Smirnov statistics. A statistic of 0 (in blue) means complete overlap between distribution and a statistic to 1 (red) no overlap at all, with intermediate ranges between the two extremes. Compared features are (d) protein length distribution, (e) protein domain number distribution, (f) gene length distribution, (g) isoelectric point distribution, and (h) GC content distribution. The heatmaps on the left section correspond to variables directly associated with protein length
Fig. 3
Fig. 3
Examples of atypical protein length distributions and distribution heterogeneity between close species. All graphs show the density distribution of protein lengths. The red lines represent the first quartile, median, and third quartile of protein lengths, and the blue lines represent the mean. a, b Examples of proteomes with an overabundance of small proteins (eukaryote Acyrthosiphon pisum (pea aphid) (a), and bacteria Rickettsia rickettsii (b)). c Toxoplasma gondii, an example of a proteome with a high proportion of longer proteins. d–f Example of difference in protein length distributions in the Drosophila genus. Drosophila melanogaster (d) has a canonical protein length distribution shape, and similar distributions exist in other Drosophila species like Drosophila grimshawi (e). Drosophila simulans, however, shows a relative abundance of small proteins (f). An alternative representation with protein length on logarithmic scale is available in Additional File 2: Figure S10
Fig. 4
Fig. 4
Outlier proteomes in terms of gene length distribution are more likely to be incomplete. Left: Stacked bar of proteomes by domain: mostly complete proteomes in light blue and incomplete proteomes in dark blue. Right: Same representation, with proteomes having the most atypical distribution in regard to their domain (outlier proteomes)

References

    1. Wright SI. Evolution of Genome Size [Internet]. eLS. Chichester, UK: John Wiley & Sons, Ltd; 2017. p. 1–6. Available from: 10.1002/9780470015902.a0023983
    1. Elliott TA, Gregory TR. What’s in a genome? The C-value enigma and the evolution of eukaryotic genome content. Philos Trans R Soc Lond B Biol Sci. 2015;370:20140331. doi: 10.1098/rstb.2014.0331. - DOI - PMC - PubMed
    1. Li X-Q, Du D. Variation, evolution, and correlation analysis of C+G content and genome or chromosome size in different kingdoms and phyla. PLoS ONE. 2014;9:e88339. doi: 10.1371/journal.pone.0088339. - DOI - PMC - PubMed
    1. Kiraga J, Mackiewicz P, Mackiewicz D, Kowalczuk M, Biecek P, Polak N, et al. The relationships between the isoelectric point and: length of proteins, taxonomy and ecology of organisms. BMC Genomics. 2007;8:163. doi: 10.1186/1471-2164-8-163. - DOI - PMC - PubMed
    1. Kozlowski LP. Proteome-pI: proteome isoelectric point database. Nucleic Acids Res. 2017;45:D1112–D1116. doi: 10.1093/nar/gkw978. - DOI - PMC - PubMed

Publication types

LinkOut - more resources