

CFD analysis on blood flow inside a symmetric stenosed artery: Physiology of a coronary artery disease
- PMID: 37292014
- PMCID: PMC10450296
- DOI: 10.1177/00368504231180092
CFD analysis on blood flow inside a symmetric stenosed artery: Physiology of a coronary artery disease
Abstract
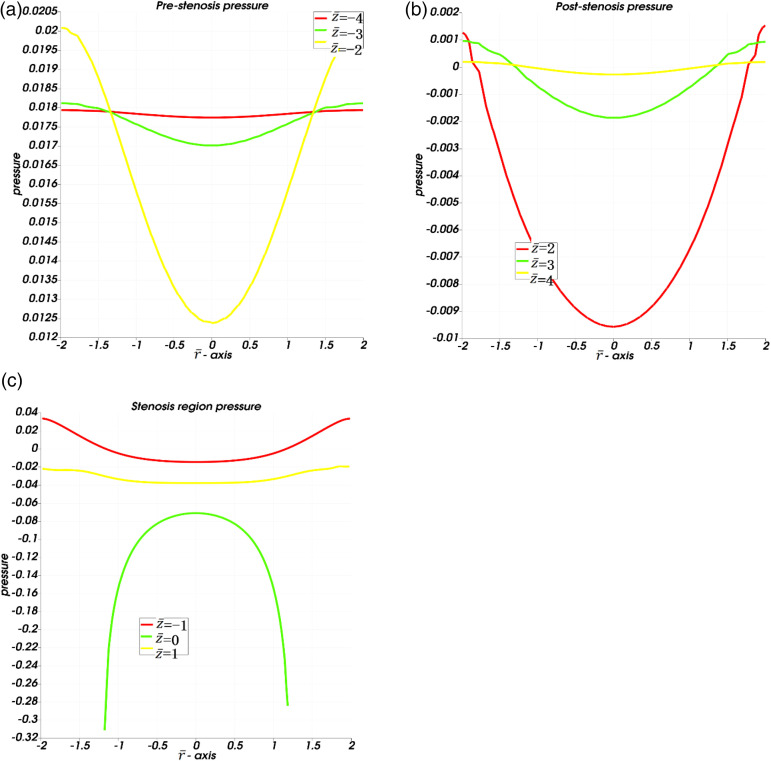
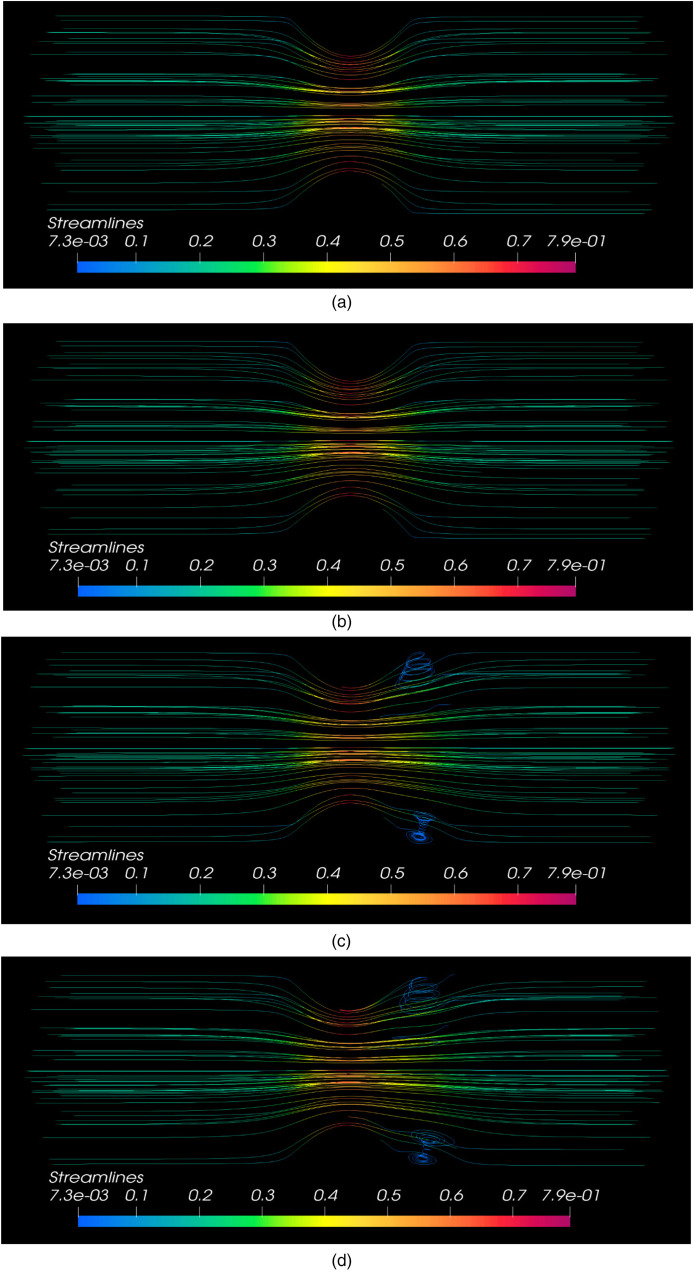
This research article interprets the computational fluid dynamics analysis on blood flow inside a symmetric stenosed artery. The current problem models the blood flow inside the left coronary artery as having a symmetric stenosis in the central region. A comprehensive physiological examination of coronary artery disease is numerically evaluated by using the computational fluid dynamics toolbox Open-Field Operation And Manipulation. There are no assumptions of mild stenosis taken into account since the considered stenosis has an exactly measured length, height and position, etc. The blood flow problem is modeled for the non-Newtonian Casson fluid with unsteady, laminar, and incompressible flow assumptions. The underlying problem is solved numerically in its dimensional form. A thorough graphical analysis is provided on the blood flow simulations, pressure profile, velocity line graphs, pressure line graphs, and streamlines for the left coronary artery having a symmetric stenosis formation. The considered artery is divided into three sections, i.e. pre-stenosis, post-stenosis, and stenosis region, and the velocity and pressure line graphs are plotted for these considered regions. The graphical illustrations provide a detailed analysis of how the blood flow is affected inside the left coronary artery due to coronary artery disease. These pre- and post-stenosis velocity line graphs reveal two intriguing results: In the pre-stenosis zone, the velocity increases with increasing axial coordinate length, whereas in the post-stenosis region, the velocity decreases with rising axial coordinate length. It is evident that as the flow moves toward the stenosis region, the flow profile rises; yet, after passing through the stenosis zone, the flow profile begins to fall as the flow moves away from the stenosis region.
Keywords: Blood flow; coronary artery disease; non-Newtonian casson fluid; symmetric stenosis.
Conflict of interest statement
The author(s) declared no potential conflicts of interest with respect to the research, authorship, and/or publication of this article.
Figures


Similar articles
-
Modeling and simulation of blood flow in unhealthy elliptic arteries with computational fluid dynamics approach.PLoS One. 2025 Apr 8;20(4):e0317989. doi: 10.1371/journal.pone.0317989. eCollection 2025. PLoS One. 2025. PMID: 40198729 Free PMC article.
-
Computational fluid dynamics analysis on endoscopy of main left coronary artery: An application of applied mathematics.Heliyon. 2024 Feb 21;10(5):e26628. doi: 10.1016/j.heliyon.2024.e26628. eCollection 2024 Mar 15. Heliyon. 2024. PMID: 38439831 Free PMC article.
-
Pulsatile flow of non-Newtonian blood fluid inside stenosed arteries: Investigating the effects of viscoelastic and elastic walls, arteriosclerosis, and polycythemia diseases.Comput Methods Programs Biomed. 2018 Feb;154:109-122. doi: 10.1016/j.cmpb.2017.11.016. Epub 2017 Nov 15. Comput Methods Programs Biomed. 2018. PMID: 29249336
-
Evaluation of functional severity of coronary artery disease and fluid dynamics' influence on hemodynamic parameters: A review.Phys Med. 2013 May;29(3):225-32. doi: 10.1016/j.ejmp.2012.03.008. Epub 2012 Jun 14. Phys Med. 2013. PMID: 22704601 Review.
-
Computational fluid dynamics in coronary artery disease.Comput Med Imaging Graph. 2014 Dec;38(8):651-63. doi: 10.1016/j.compmedimag.2014.09.002. Epub 2014 Sep 16. Comput Med Imaging Graph. 2014. PMID: 25262321 Review.
Cited by
-
Computational fluid dynamics for vascular assessment in hepatobiliopancreatic surgery: a pilot study and future perspectives.Surg Endosc. 2025 May;39(5):3127-3136. doi: 10.1007/s00464-025-11536-4. Epub 2025 Apr 1. Surg Endosc. 2025. PMID: 40169447 Free PMC article.
-
HSPA12A acts as a scaffolding protein to inhibit cardiac fibroblast activation and cardiac fibrosis.J Adv Res. 2025 Jan;67:217-229. doi: 10.1016/j.jare.2024.01.012. Epub 2024 Jan 14. J Adv Res. 2025. PMID: 38219869 Free PMC article.
-
ML-ROM wall shear stress prediction in patient-specific vascular pathologies under a limited clinical training data regime.PLoS One. 2025 Jun 12;20(6):e0325644. doi: 10.1371/journal.pone.0325644. eCollection 2025. PLoS One. 2025. PMID: 40504795 Free PMC article.
-
Modeling and simulation of blood flow in unhealthy elliptic arteries with computational fluid dynamics approach.PLoS One. 2025 Apr 8;20(4):e0317989. doi: 10.1371/journal.pone.0317989. eCollection 2025. PLoS One. 2025. PMID: 40198729 Free PMC article.
References
-
- Centers for Disease Control and Prevention, National Center for Health Statistics. About Multiple Cause of Death, 1999–2020. CDC WONDER Online Database website. Atlanta, GA: Centers for Disease Control and Prevention, 2022. Accessed February 21, 2022.
-
- Tsao CW, Aday AW, Almarzooq ZI, et al.Heart disease and stroke statistics—2022 update: A report from the American heart association. Circulation 2022; 145: e153–e639. - PubMed
-
- Agency for Healthcare Research and Quality. Medical Expenditure Panel Survey (MEPS): household component summary tables: medical conditions, United States. Accessed April 8, 2021. - PubMed
-
- Alhassen M, Abdalla A, Ali Tet al.et al.Variations in diameter of the left coronary artery and its main branches among adult population of Khartoum state, Sudan. J Hypertens Cardiol 2021; 3: 1–5.
-
- Abedin Z, Goldberg J. Origin and length of left main coronary artery: Its relation to height, weight, sex, age, pattern of coronary distribution, and presence or absence of coronary artery disease. Cathet Cardiovasc Diagn 1978; 4: 335–340. - PubMed
MeSH terms
LinkOut - more resources
Full Text Sources
Medical
Miscellaneous
