. 2023 May 30:28:227-242.
doi: 10.1016/j.bioactmat.2023.05.013. eCollection 2023 Oct.

Li-Mg-Si bioceramics provide a dynamic immuno-modulatory and repair-supportive microenvironment for peripheral nerve regeneration

Affiliations

Li-Mg-Si bioceramics provide a dynamic immuno-modulatory and repair-supportive microenvironment for peripheral nerve regeneration

Yiting Sun et al. Bioact Mater. .

Abstract

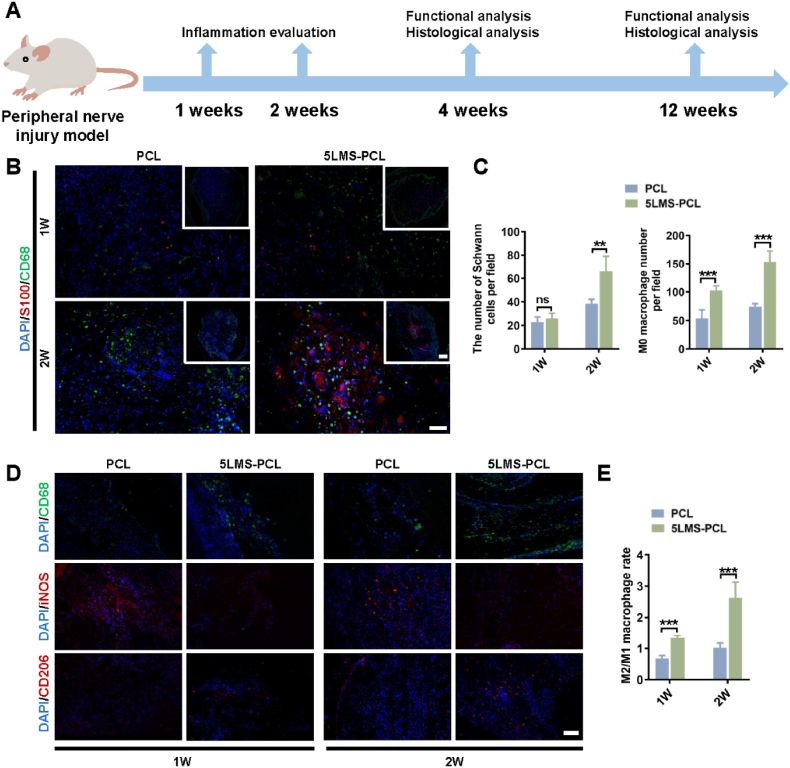
Biomaterials can modulate the local immune and repair-supportive microenvironments to promote peripheral nerve regeneration. Inorganic bioceramics have been widely used for regulating tissue regeneration and local immune response. However, little is known on whether inorganic bioceramics can have potential for enhancing peripheral nerve regeneration and what are the mechanisms underlying their actions. Here, the inorganic lithium-magnesium-silicon (Li-Mg-Si, LMS) bioceramics containing scaffolds are fabricated and characterized. The LMS-containing scaffolds had no cytotoxicity against rat Schwann cells (SCs), but promoted their migration and differentiation towards a remyelination state by up-regulating the expression of neurotrophic factors in a β-catenin-dependent manner. Furthermore, using single cell-sequencing, we showed that LMS-containing scaffolds promoted macrophage polarization towards the pro-regenerative M2-like cells, which subsequently facilitated the migration and differentiation of SCs. Moreover, implantation with the LMS-containing nerve guidance conduits (NGCs) increased the frequency of M2-like macrophage infiltration and enhanced nerve regeneration and motor functional recovery in a rat model of sciatic nerve injury. Collectively, these findings indicated that the inorganic LMS bioceramics offered a potential strategy for enhancing peripheral nerve regeneration by modulating the immune microenvironment and promoting SCs remyelination.

Keywords: Bioceramics; Immuno-modulation microenvironment; Macrophage; Nerve guidance conduit; Peripheral nerve regeneration.


Conflict of interest statement

All the authors have no conflict of interests.

Figures

Image 1
Graphical abstract
Fig. 1
Fig. 1
LMS bioceramic extracts promote the proliferation, migration and differentiation of RSCs, and regulate the polarization of macrophages in vitro. (A) Electron microscopy scanning displayed that the LMS bioceramics are amorphous and agglomerated, and the EDS mapping indicated the uniform distribution of Mg and Si ions. Scale bars = 2 and 1 μm. (B) XRD pattern of LMS bioceramics exhibited that the major phase was Li2MgSiO4. (C) XPS analysis of the chemical elemental composition of LMS bioceramics. (D) The effects of different concentrations of LMS extracts on the viability of RSCs in the indicated time periods. (E&F) Treatment with the indicated concentrations of LMS extracts promoted the wound healing of RSCs. Scale bars = 200 μm. (G) RT-qPCR analysis of the relative levels of myelination-related gene mRNA transcripts in RSC96 cells after treatment with vehicle or LMS extracts at different dilutions (1/64, 1/128 and 1/256) for the indicated time periods. (H) Western blot analysis of the relative levels of myelination-related protein expression in RSC96 cells after treatment with vehicle or LMS extracts at different dilutions (1/64, 1/128 and 1/256) for 24 h. (I) Representative immunofluorescent images of RSCs that had been treated with vehicle or LMS extracts at different dilutions (1/64, 1/128 and 1/256) for 24 h. The cells were stained with phalloidin (green), nuclei (blue) and anti-S100 (red). Scale bars = 100 μm (J) Flow cytometry analysis of RAW264.7 cells that had been treated with vehicle or LMS extracts at different dilutions (1/64, 1/128 and 1/256) for 3 days. (K) RT-qPCR analysis of the relative levels of macrophage polarization-related gene mRNA transcripts in RAW264.7 cells after treatment with vehicle or LMS extracts at different dilutions (1/64, 1/128 and 1/256) for 3 days. (L) Western blot analysis of the relative levels of macrophage polarization-related protein expression in RAW264.7 cells after treatment with vehicle or LMS extracts at different dilutions (1/64, 1/128 and 1/256) for 3 days.
Fig. 2
Fig. 2
LMS-containing scaffolds modulate the proliferation, migration and differentiation of RSC96 cells. (A) SEM images of scaffolds containing different concentrations of LMS. (B–C) Representative images and quantitative results of live-dead staining of RSC96 cells after cultured on scaffolds containing different concentrations of LMS. Scale bars = 200 μm. (D) The effects of scaffolds containing different concentrations of LMS on the viability of RSCs. (E) RT-qPCR analysis of the relative levels of myelination-related gene mRNA transcripts in RSC96 cells that had been cultured on scaffolds containing different concentrations of LMS for 24 h. (F) Immunoblotting analysis of the relative levels of myelination-related protein expression in RSC96 cells that had been cultured on scaffolds containing different concentrations of LMS for 24 h. (G) GO analysis of the enrichment of differentially expressed genes between RSC96 cells cultured on PCL and 5LMS-PCL scaffold for 24 h followed by RNA sequencing. (H–I) Differentially expressed genes between RSC96 cells cultured on PCL and 5LMS-PCL scaffold for 24 h (|log2FC|>1 and FDR<0.05). (J) Immunoblotting analysis of the relative protein levels of the GSK3β/β-catenin pathway in RSC96 cells cultured on scaffolds containing different concentrations of LMS for 24 h. (K) RT-qPCR analysis of the relative levels of gene mRNA transcripts in the GSK3β/β-catenin pathway in RSCs cultured on scaffolds containing different concentrations of LMS for 24 h in the presence or absence of XAV939. (L) Immunoblotting analysis of the relative protein levels in the GSK3β/β-catenin pathway in RSC96 cells cultured on scaffolds containing different concentrations of LMS for 24 h in the presence or absence of XAV939.
Fig. 3
Fig. 3
Single cell RNA-seq analysis of macrophages polarized by LMS-containing scaffold (A) UMAP visualization of the distributions of RAW264.7 cells on different scaffolds. (B) Identification of the 9 subclusters of cell population. (C) Hypergeometric distribution analysis of the groups (PCL or 5LMS-PCL) of each cell clusters. (D) Gene ontology (GO) functional enrichment analysis. (E) Visualization of the selected marker genes of M2 macrophage. (F) UMAP visualization of RAW264.7 cells on different scaffolds after the scSTAR transformation (G) Identification of the 8 subclusters of cell population after the scSTAR transformation (H) hypergeometric distribution analysis of the groups (PCL or 5LMS-PCL) of each cell clusters after the scSTAR transformation. (I) Pseudotime-trajectory analysis of RAW264.7 cells. (J) Violin plot displayed the expression levels of genes along the trajectory with the p value<0.001 (K) GO functional enrichment analysis of trajectory genes.
Fig. 4
Fig. 4
Effects of polarized macrophages induced by LMS-containing scaffolds on RSC96 cell behavior. (A) Flow cytometry analysis of RAW264.7 cells cultured on PCL or 5LMS-PCL scaffold for 24 h after LPS stimulation. (B) Representative immunofluorescent images of different groups of RAW264.7 cells characterized by immunofluorescence staining using anti-CD68 (green), anti-iNOS (red) and anti-CD206 (red) as well as DAPI (blue). Scale bars = 150 μm (C) RT-qPCR analysis of the relative levels of inflammation-related gene mRNA transcripts in different groups of RAW264.7 cells. (D) Immunoblotting analysis of the relative levels of inflammation-related protein expression in different groups of RAW264.7 cells. (E) Quantitative analysis of the wound healing capacities of RSC96 cells after coculture with different CM for the indicated time periods. (F&G) Representative images of transwell migration and quantitative analysis of migrated RSC96 cells after coculture with different conditioned medium for 1 day. Scale bars = 200 μm (H) RT-qPCR analysis of the relative levels of myelination-related gene mRNA transcripts in RSC96 cells after coculture with different conditioned medium for 3 days.
Fig. 5
Fig. 5
Relevance between macrophages and SCs at 1 and 2 weeks after grafting of NGCs in vivo. (A) A schematic illustration of in vivo analysis in a rat model of sciatic nerve defect. (B) Double immunofluorescent staining of the transverse sections of grafted NGCs revealed the distribution of macrophages (M0, CD68, green) and SCs (S100, red) within different NGCs. Scale bars = 100 and 50 μm (C) Quantitative analysis of the number of infiltrated macrophages and SCs in each group. (D) Immunofluorescent analysis of macrophage polarization within the grafted NGCs using anti-CD68 (green), anti-iNOS (red) and anti-CD206 (red) as well as DAPI. (E) Quantitative analysis of the ratios of CD68+/CD206+ macrophages to CD68+/iNOS+ macrophages in each group.
Fig. 6
Fig. 6
LMS-containing NGCs promote motor function recovery in vivo. (A) Gross observation of regenerated nerves in each group at indicated post-surgery time points. Scale bars = 5 μm (B) Representative images of rat footprints in each group. (C) Quantitative analysis of sciatic functional index (SFI). (D) Representative patterns of CMAP in each group. (E) Quantitative analysis of nerve conduction latency and CMAP amplitudes. (F) Gross observation of gastrocnemius muscles on the surgery side (ES) and contralateral side (NS) in each group. (G) Quantitative analysis of the wet weight ratio of gastrocnemius muscles (ES/NS). (H–I) Quantitative analysis of gastrocnemius muscle fiber diameter and the percentage area of collagen deposition. (J–K) Representative images of H&E staining and Masson trichrome staining of gastrocnemius muscle in each group. Scale bars = 50 and 200 μm.
Fig. 7
Fig. 7
LMS-containing NGCs promotes nerve regeneration in vivo. (A–C) TEM images of axon diameter and myelin sheath thickness of regenerating nerves in each group of rats at 12 weeks post-surgery. Scale bars = 10, 1, 10 and 1 μm, respectively. (D) Representative H&E staining images in each group. Scale bars = 50 μm. (E & F) Toluidine blue staining and quantitative analysis of myelination. Scale bars = 50 μm. (G & H) Representative images of immunohistochemical staining and quantitative analysis of the CD31+ areas around regenerating nerves. Scale bars = 50 μm.
Fig. 8
Fig. 8
LMS-containing NGCs promote nerve myelination and β-catenin activation in vivo. (A) Representative immunofluorescent images of myelination in the regenerating nerves using anti-PMP22 (red) and anti-NCAM (green) as well as PGP 9.5 and DAPI. Scale bars = 100 μm. (B) Representative immunofluorescent images of active β-catenin (green) expression in the regenerating nerves. Scale bars = 100 and 50 μm. (C) Representative immunofluorescent images of the longitudinal and transverse sections of regenerating nerves using anti-NF200 (green) and anti-S100 (red) at 12 weeks post-surgery. Scale bars = 100 and 50 μm. (D–H) Quantitative analysis of PMP22, NCAM, active β-catenin, NF200 and S100 expression in each group of rats.
Schematic. 1
Schematic. 1
A schematic illustration of proposed mechanisms for LMS-containing nerve guidance conduit providing a dynamic immuno-modulatory and repair-supportive microenvironment for peripheral nerve regeneration.

References

    1. Behtaj S., St John J.A., Ekberg J.A.K., Rybachuk M. Neuron-fibrous scaffold interfaces in the peripheral nervous system: a perspective on the structural requirements. Neural regeneration research. 2022;17(9):1893–1897. doi: 10.4103/1673-5374.329003. - DOI - PMC - PubMed
    1. Singh V.K., Haq A., Tiwari M., Saxena A.K. Approach to management of nerve gaps in peripheral nerve injuries. Injury. 2022;53(4):1308–1318. doi: 10.1016/j.injury.2022.01.031. - DOI - PubMed
    1. Scheib J., Hoke A. Advances in peripheral nerve regeneration. Nat. Rev. Neurol. 2013;9(12):668–676. doi: 10.1038/nrneurol.2013.227. - DOI - PubMed
    1. Liu K., Yan L., Li R., Song Z., Ding J., Liu B., Chen X. 3D printed personalized nerve guide conduits for precision repair of peripheral nerve defects. Adv. Sci. 2022;9(12) doi: 10.1002/advs.202103875. - DOI - PMC - PubMed
    1. Bassilios Habre S., Bond G., Jing X.L., Kostopoulos E., Wallace R.D., Konofaos P. The surgical management of nerve gaps: present and future. Ann. Plast. Surg. 2018;80(3):252–261. doi: 10.1097/SAP.0000000000001252. - DOI - PubMed

LinkOut - more resources