

A method to produce a flexible and customized fuel models dataset
- PMID: 37292241
- PMCID: PMC10244702
- DOI: 10.1016/j.mex.2023.102218
A method to produce a flexible and customized fuel models dataset
Abstract
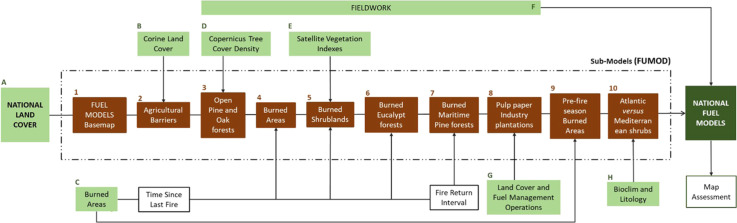
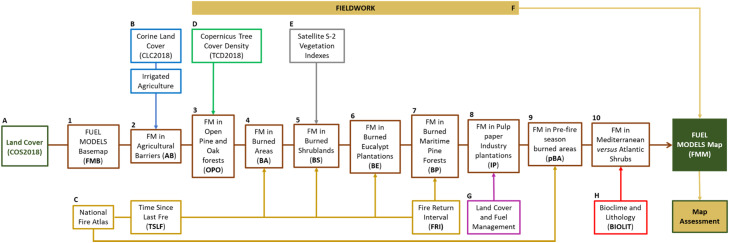
Simulation of vegetation fires very often resorts to fire-behavior models that need fuel models as input. The lack of fuel models is a common problem for researchers and fire managers because its quality depends on the quality/availability of data. In this study we present a method that combines expert- and research-based knowledge with several sources of data (e.g. satellite and fieldwork) to produce customized fuel models maps. Fuel model classes are assigned to land cover types to produce a basemap, which is then updated using empirical and user-defined rules. This method produces a map of surface fuel models as detailed as possible. It is reproducible, and its flexibility relies on juxtaposing independent spatial datasets, depending on their quality or availability. This method is developed in a ModelBuilder/ArcGis toolbox named FUMOD that integrates ten sub-models. FUMOD has been used to map the Portuguese annual fuel models grids since 2019, supporting regional fire risk assessments and suppression decisions. Datasets, models and supplementary files are available in a repository (https://github.com/anasa30/PT_FuelModels). •FUMOD is a flexible toolbox with ten sub-models included that maps updated Portuguese fuel models.
Keywords: Automatic updates; Burned areas; Expert-based knowledge; FUMOD: updated fuel models gridded dataset; Fire-atlas; Flexible approach; Fuel models; Land cover; Satellite data; Spectral vegetation indexes; Time since last fire.
© 2023 The Author(s).
Conflict of interest statement
The authors declare that they have no known competing financial interests or personal relationships that could have appeared to influence the work reported in this paper.
Figures


Similar articles
-
Multitemporal lidar captures heterogeneity in fuel loads and consumption on the Kaibab Plateau.Fire Ecol. 2022;18(1):18. doi: 10.1186/s42408-022-00142-7. Epub 2022 Aug 9. Fire Ecol. 2022. PMID: 36017330 Free PMC article.
-
Developing Custom Fire Behavior Fuel Models for Mediterranean Wildland-Urban Interfaces in Southern Italy.Environ Manage. 2015 Sep;56(3):754-64. doi: 10.1007/s00267-015-0531-z. Epub 2015 May 12. Environ Manage. 2015. PMID: 25962800
-
The dynamics and drivers of fuel and fire in the Portuguese public forest.J Environ Manage. 2014 Dec 15;146:373-382. doi: 10.1016/j.jenvman.2014.07.049. Epub 2014 Sep 7. J Environ Manage. 2014. PMID: 25203440
-
Fine-resolution mapping of wildfire fuel types for Canada: Fuzzy logic modeling for an Alberta pilot area.Environ Monit Assess. 2006 Sep;120(1-3):127-52. doi: 10.1007/s10661-005-9053-0. Epub 2006 Jun 13. Environ Monit Assess. 2006. PMID: 16770507
-
Detection, emission estimation and risk prediction of forest fires in China using satellite sensors and simulation models in the past three decades--an overview.Int J Environ Res Public Health. 2011 Aug;8(8):3156-78. doi: 10.3390/ijerph8083156. Epub 2011 Jul 28. Int J Environ Res Public Health. 2011. PMID: 21909297 Free PMC article. Review.
Cited by
-
Zone adaptive fuel mapping for high resolution wildfire spread forecasting.Sci Rep. 2025 Jul 1;15(1):22254. doi: 10.1038/s41598-025-06402-1. Sci Rep. 2025. PMID: 40596365 Free PMC article.
References
-
- Ascoli D., Vacchiano G., Scarpa C., Arca B., Barbati A., Battipaglia G., Elia M., Esposito A., Garfì V., Lovreglio R., Mairota P., Marchetti M., Marchi E., Meytre S., Ottaviano M., Pellizzaro G., Rizzolo R., Sallustio L., Salis M., Sirca C., Valese E., Ventura A., Bacciu V. Harmonized dataset of surface fuels under Alpine, temperate and Mediterranean conditions in Italy. A synthesis supporting fire management. IForest Biogeosciences For. 2020;13:513. doi: 10.3832/IFOR3587-013. - DOI
-
- Fernandes P.M. Combining forest structure data and fuel modelling to classify fire hazard in Portugal. Ann. For. Sci. 2009;664(66):415. doi: 10.1051/FOREST/2009013. 2009415. - DOI
-
- Kucuk O., Bilgili E., Paulo Fernandes A.M., Fernandes P.M. Fuel modelling and potential fire behavior in Turkey. Šumarski List. 2015;139:553–560.
-
- Holsinger L., Parks S.A., Miller C. Weather, fuels, and topography impede wildland fire spread in western US landscapes. For. Ecol. Manag. 2016;380:59–69. doi: 10.1016/j.foreco.2016.08.035. - DOI
LinkOut - more resources
Full Text Sources
