

Analyzing nonlinear contributions from climate change and anthropogenic activity to the normalized difference vegetation index across China using a locally weighted regression approach
- PMID: 37292263
- PMCID: PMC10245264
- DOI: 10.1016/j.heliyon.2023.e16694
Analyzing nonlinear contributions from climate change and anthropogenic activity to the normalized difference vegetation index across China using a locally weighted regression approach
Abstract
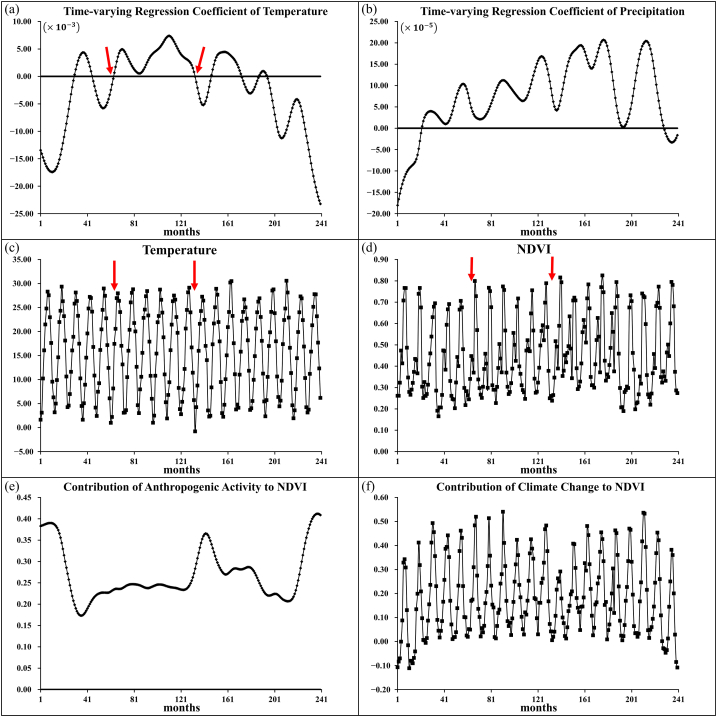
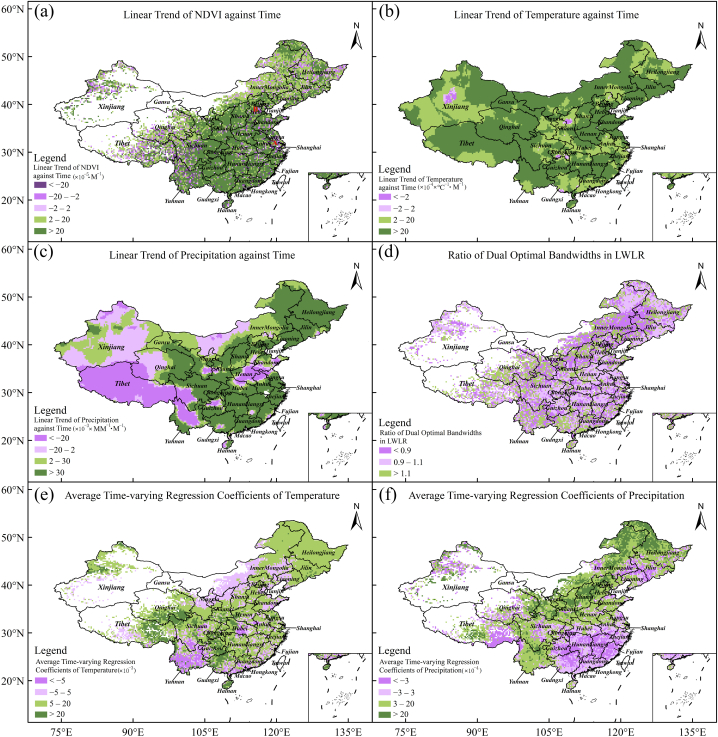
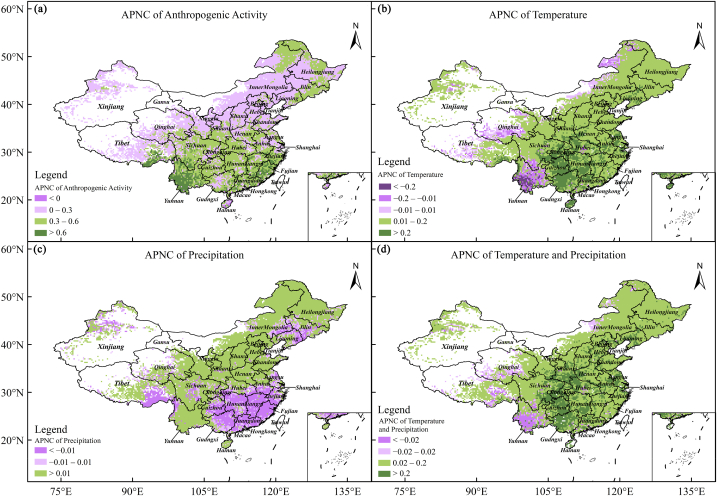
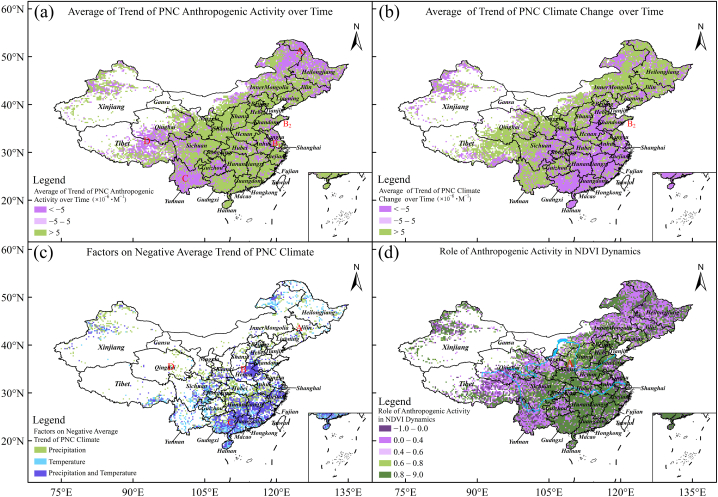
Nonlinear contributions from climate change and anthropogenic activity to the Normalized Difference Vegetation Index (NDVI) are analyzed to better understand the mechanisms underlying the nonlinear response of vegetation growth. In this study, it was hypothesized that NDVI dynamics on a nonlinear trajectory could track fluctuations of climate change and anthropogenic activity. Contributions from climate change and anthropogenic activity to NDVI were quantified using a locally weighted regression approach based on monthly timescale datasets. The findings showed that: 1) Vegetation cover fluctuated and increased in 81% of regions in China from 2000 to 2019. 2) The average predicted nonlinear contribution (APNC) of anthropogenic activity to NDVI was positive in China. The temperature APNC was positive in most of China but negative in Yunnan, where high temperatures and asynchronous temporal changes in temperature and NDVI were observed. The precipitation APNC was positive in the north of the Yangtze River, where precipitation is insufficient; but negative in South China, where precipitation is plentiful. Anthropogenic activity had the highest magnitude among the three nonlinear contributions, followed by temperature and precipitation. 3) The regions with contribution rates of anthropogenic activity greater than 80% were mainly distributed in the central Loess Plateau, North China Plain, and South China, while the areas with contribution rates of climate change greater than 80% were mainly concentrated in the northeastern QTP, Yunnan, and Northeast China. 4) The high temperature, drought, and asynchronous temporal changes in temperature, precipitation, and NDVI caused the negative average of changing trends in the predicted nonlinear contribution (PNC) of climate change to NDVI. Deforestation, land cover change, and grazing/fencing led to the negative average of changing trends in PNC from anthropogenic activity. These findings deepen our understanding of the mechanisms underlying the nonlinear responses of vegetation growth to climate change and anthropogenic activity.
Keywords: Anthropogenic activity; Changing trend; Meteorological factors; NDVI; Nonlinear contribution.
© 2023 The Authors. Published by Elsevier Ltd.
Conflict of interest statement
The authors declare that they have no known competing financial interests or personal relationships that could have appeared to influence the work reported in this paper.
Figures
Similar articles
-
Effects of Climate Change on Land Cover Change and Vegetation Dynamics in Xinjiang, China.Int J Environ Res Public Health. 2020 Jul 6;17(13):4865. doi: 10.3390/ijerph17134865. Int J Environ Res Public Health. 2020. PMID: 32640654 Free PMC article.
-
Identifying the Impacts of Climate Change and Human Activities on Vegetation Cover Changes: A Case Study of the Yangtze River Basin, China.Int J Environ Res Public Health. 2022 May 20;19(10):6239. doi: 10.3390/ijerph19106239. Int J Environ Res Public Health. 2022. PMID: 35627774 Free PMC article.
-
[Vegetation cover change and its response to climate change on the Loess Plateau, Northwest China based on ICEEMDAN method].Ying Yong Sheng Tai Xue Bao. 2021 Jun;32(6):2129-2137. doi: 10.13287/j.1001-9332.202106.011. Ying Yong Sheng Tai Xue Bao. 2021. PMID: 34212619 Chinese.
-
Assessment of climatic and anthropogenic influences on vegetation dynamics in China: a consideration of climate time-lag and cumulative effects.Int J Biometeorol. 2025 Jan;69(1):77-91. doi: 10.1007/s00484-024-02794-3. Epub 2024 Oct 7. Int J Biometeorol. 2025. PMID: 39373934
-
Increased sandstorm frequency in North China in 2023: Climate change reflection on the Mongolian plateau.Innovation (Camb). 2023 Aug 12;4(5):100497. doi: 10.1016/j.xinn.2023.100497. eCollection 2023 Sep 11. Innovation (Camb). 2023. PMID: 37663931 Free PMC article. Review. No abstract available.
Cited by
-
Considering Climatic Factors, Time Lag, and Cumulative Effects of Climate Change and Human Activities on Vegetation NDVI in Yinshanbeilu, China.Plants (Basel). 2023 Sep 19;12(18):3312. doi: 10.3390/plants12183312. Plants (Basel). 2023. PMID: 37765476 Free PMC article.
References
-
- Wang H., Zhou S., Li X., Liu H., Chi D., Xu K. The influence of climate change and human activities on ecosystem service value. Ecol. Eng. 2016;87:224–239. doi: 10.1016/j.ecoleng.2015.11.027. - DOI
-
- French A.N., Hunsaker D.J., Sanchez C.A., Saber M., Gonzalez J.R., Anderson R. Satellite-based NDVI crop coefficients and evapotranspiration with eddy covariance validation for multiple durum wheat fields in the US Southwest. Agric. Water Manag. 2020;239 doi: 10.1016/j.agwat.2020.106266. - DOI
-
- Ghebrezgabher M.G., Yang T., Yang X., Sereke T.E. Assessment of NDVI variations in responses to climate change in the Horn of Africa. The Egyptian Journal of Remote Sensing and Space Science. 2020;23(3):249–261. doi: 10.1016/j.ejrs.2020.08.003. - DOI
LinkOut - more resources
Full Text Sources
