[Preprint]. 2023 May 15:rs.3.rs-2921804.
doi: 10.21203/rs.3.rs-2921804/v1.

Spatial genomic, biochemical, and cellular mechanisms drive meningioma heterogeneity and evolution

Affiliations

Spatial genomic, biochemical, and cellular mechanisms drive meningioma heterogeneity and evolution

Calixto-Hope Lucas et al. Res Sq. .

Update in

Abstract

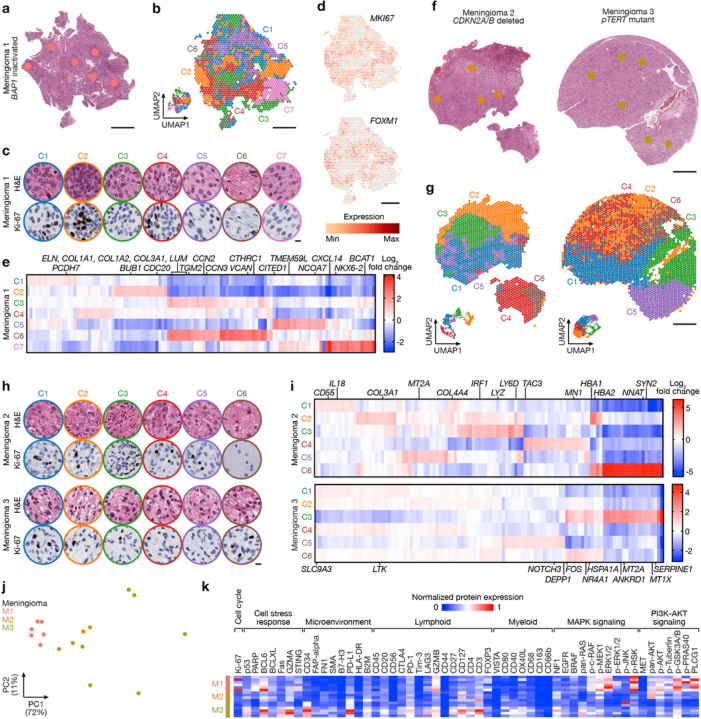
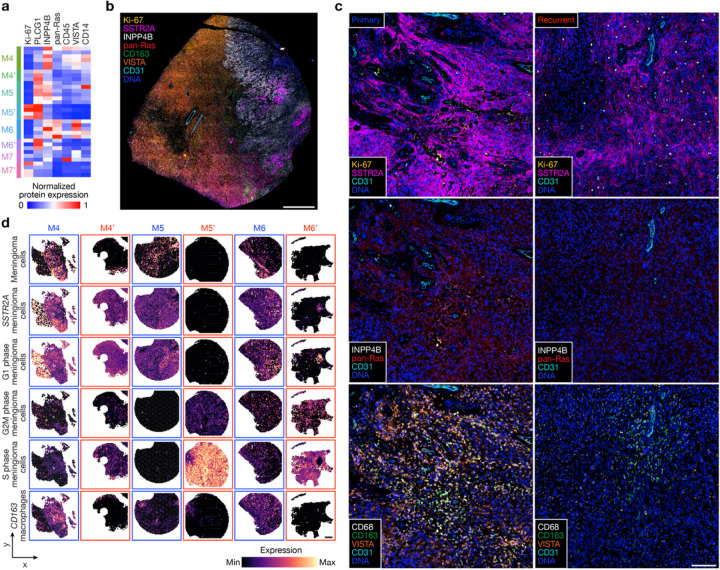
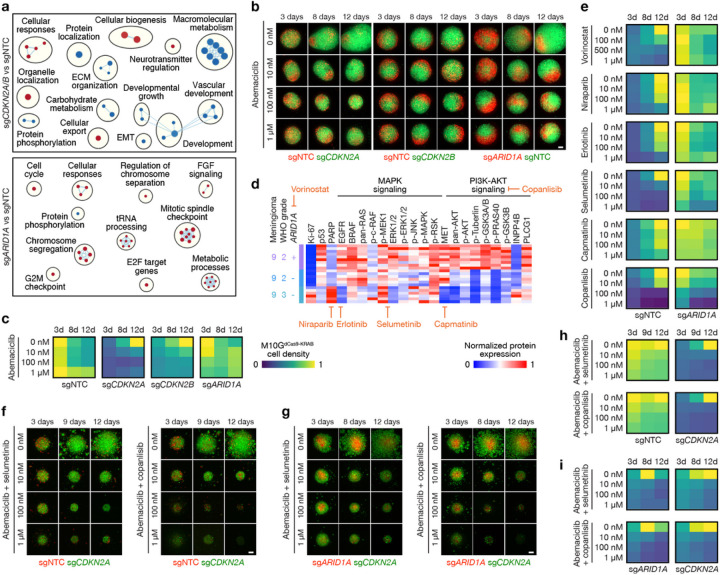
Intratumor heterogeneity underlies cancer evolution and treatment resistance1-5, but targetable mechanisms driving intratumor heterogeneity are poorly understood. Meningiomas are the most common primary intracranial tumors and are resistant to all current medical therapies6,7. High-grade meningiomas cause significant neurological morbidity and mortality and are distinguished from low-grade meningiomas by increased intratumor heterogeneity arising from clonal evolution and divergence8. Here we integrate spatial transcriptomic and spatial protein profiling approaches across high-grade meningiomas to identify genomic, biochemical, and cellular mechanisms linking intratumor heterogeneity to the molecular, temporal, and spatial evolution of cancer. We show divergent intratumor gene and protein expression programs distinguish high-grade meningiomas that are otherwise grouped together by current clinical classification systems. Analyses of matched pairs of primary and recurrent meningiomas reveal spatial expansion of sub-clonal copy number variants underlies treatment resistance. Multiplexed sequential immunofluorescence (seqIF) and spatial deconvolution of meningioma single-cell RNA sequencing show decreased immune infiltration, decreased MAPK signaling, increased PI3K-AKT signaling, and increased cell proliferation drive meningioma recurrence. To translate these findings to clinical practice, we use epigenetic editing and lineage tracing approaches in meningioma organoid models to identify new molecular therapy combinations that target intratumor heterogeneity and block tumor growth. Our results establish a foundation for personalized medical therapy to treat patients with high-grade meningiomas and provide a framework for understanding therapeutic vulnerabilities driving intratumor heterogeneity and tumor evolution.


Conflict of interest statement

Competing interests statement The authors declare no competing interests.

Figures

Figure 1
Figure 1. Experimental design and workflow.
a, 16 high-grade meningioma samples from 10 meningiomas that were resected from 9 patients were analyzed using comprehensive histologic, immunohistochemical, and bulk and spatial bioinformatic techniques, including spatial transcriptomics, spatial protein profiling, multiplexed sequential immunofluorescence microscopy, and spatial deconvolution of meningioma single-cell RNA sequencing. Results were validated using RNA sequencing from 502 meningiomas, and CRISPR interference, pharmacology, and live cell imaging of meningioma organoid preclinical models. Scale bars, 1mm for meningiomas and 100μm for meningioma organoids. b, Oncoprint comprised of the clinical, histologic, genetic, epigenetic, and gene expression features of the meningioma samples in this study. c, Uniform manifold approximation and projection (UMAP) of 38,718 meningioma spatial transcriptomes after Harmony batch correction shaded by sample of origin. d, UMAP of meningioma spatial transcriptomes after Harmony batch correction shaded by unsupervised hierarchical clusters. e, Heatmap of meningioma spatial protein profiling comprised of 72 proteins from 82 regions revealing significant inter- and intratumor heterogeneity.
Figure 2
Figure 2. High-grade meningiomas are distinguished by divergent intratumor gene and protein expression programs.
Spatial transcriptomics and protein profiling of meningiomas 1–3 (M1–3) with driver mutations associated with adverse clinical outcomes, such as BAP1 loss (M1), CDKN2A/B loss (M2), or TERT promoter mutation (M3). a, M1 H&E-stained section showing regions of spatial protein profiling. Scale bar, 1mm. b, Spatial distribution of unsupervised hierarchical spatial transcriptome clusters from M1. Insert shows Uniform manifold approximation and project (UMAP) analysis of M1 spatial transcriptomes. Scale bar, 1mm. c, Representative H&E morphology and Ki-67 immunohistochemistry (IHC) of spatial transcriptome clusters from M1. Colors correspond to spatial transcriptomes from b. Scale bar, 10μm. d, Spatial distribution and expression of MKI67 or FOXM1 transcripts from M1. Scale bar, 1mm. e, Top 119 differentially expressed genes across unsupervised hierarchical spatial transcriptome clusters from M1. f, M2 (left) or M3 (right) H&E-stained sections showing regions of spatial protein profiling. Scale bar, 1mm. g, Spatial distribution of unsupervised hierarchical spatial transcriptome clusters from M2 (left) or M3 (right). Inserts show UMAP analyses of M2 or M3 spatial transcriptomes. Scale bar, 1mm. h, Representative H&E morphology and Ki-67 IHC of spatial transcriptome clusters from M2 (top) or M3 (bottom). Colors correspond to spatial transcriptomes from g. Scale bar, 10μm. i, Top differentially expressed genes across unsupervised hierarchical spatial transcriptome clusters from M2 (top, 115 genes) or M3 (bottom, 110 genes). j, Principal component (PC) analysis of spatial protein profiling from M1–3. k, Differentially expressed spatial proteins from M1–3 (all with Student’s t test p£0.05 for head-to-head comparisons of one meningioma to at least one other meningioma).
Figure 3
Figure 3. Spatial expansion of sub-clonal copy number variants underlies high-grade meningioma recurrence.
Spatial transcriptomics and protein profiling of matched pairs of primary and recurrent meningiomas from patients 4–7 (M4 and M4’, M5 and M5’, M6 and M6’, and M7 and M7’). a, Preoperative T1 post-contrast magnetic resonance imaging (MRI) of matched pairs of primary (blue, M4, M5, M6, M7) and recurrent (red, M4’, M5’, M6’, M7’) meningiomas. b, UMAP analysis of matched pairs of primary and recurrent meningioma spatial transcriptomes after Harmony batch correction. Scale bar, 1mm. c, Spatial distribution of unsupervised hierarchical spatial transcriptome clusters harboring divergent copy number variants from InferCNV. Scale bar, 1mm. d, Spatial distribution of differentially expressed genes associated with copy number variants across matched pairs of primary and recurrent meningiomas. Scale bar, 1mm.
Figure 4
Figure 4. Decreased immune infiltration, decreased MAPK signaling, increased PI3K-AKT signaling, and increased cell proliferation underlie high-grade meningioma recurrence.
a, Differentially expressed spatial proteins from M4–7’ (all with Student’s t test p£0.05 for at least 3 of 4 primary versus recurrent meningioma comparisons). b, Representative image of multiplexed seqIF microscopy showing intratumor heterogeneity of signaling mechanisms and cell types in the region of M9 with WHO grade 2 (left) and WHO grade 3 (right) histology, as well as ARID1A and Chr4/14q loss. Scale bar, 1mm. c, Multiplexed seqIF microscopy showing temporal evolution of signaling mechanisms and cell types in primary versus recurrent meningiomas. Images from M4 and M4’ that are representative of matched pairs of primary and recurrent meningiomas from patients 4–7 (M4 and M4’, M5 and M5’, M6 and M6’, and M7 and M7’). Scale bar, 100μm. d, Spatial deconvolution of meningioma single-cell RNA sequencing showing temporal evolution of cell types from matched pairs of primary (blue) and recurrent (red) meningiomas. Scale bar, 1mm.
Figure 5
Figure 5. Regionally distinct sub-clonal spatial transcriptomes underlie histological heterogeneity in high-grade meningioma.
a, Ki-67 immunohistochemistry (IHC) of regionally distinct samples from M9 demonstrating heterogeneous histological (WHO grade 2 or 3), mutational (ARID1A, ASXL1), and cytogenetic (chromosome 4, 14q) features (Fig. 1b). b, p16 IHC of regionally distinct samples from M10 demonstrating heterogeneous histological (p16, Ki-67) and cytogenetic (chromosome 1q, 4q, 9p, 10q) features (Fig. 1b). c, UMAP analysis of M9 spatial transcriptomes after Harmony batch correction shaded by region of origin (left) or unsupervised hierarchical clusters (right). Scale bar, 1mm. d, UMAP analysis of M10 spatial transcriptomes after Harmony batch correction shaded by region of origin (left) or unsupervised hierarchical clusters (right). Scale bar, 1mm. e, Spatial distribution of unsupervised hierarchical spatial transcriptome clusters from M9 after Harmony batch correction. Scale bar, 1mm. f, Spatial distribution of unsupervised hierarchical spatial transcriptome clusters from M10 after Harmony batch correction. Scale bar, 1mm. g, Distribution of unsupervised hierarchical spatial transcriptome clusters from M9 after Harmony batch correction. Spatial transcriptome clusters correlating with WHO grade 3 histology are annotated. h, Top 89 differentially expressed genes across unsupervised hierarchical spatial transcriptome clusters from M9. I, Spatial distribution of differentially expressed genes associated with histological variability across regionally distinct samples from M9. Scale bar, 1mm. j, Distribution of unsupervised hierarchical spatial transcriptome clusters from M10 after Harmony batch correction. k, Top 110 differentially expressed genes across unsupervised hierarchical spatial transcriptome clusters from M10. l, Spatial distribution of differentially expressed genes associated with histological variability across regionally distinct samples from M10. Scale bar, 1mm.
Figure 6
Figure 6. High-grade meningiomas are distinguished by regionally distinct intratumor immune infiltration, MAPK signaling, PI3K-AKT signaling, and cell proliferation.
a, Multiplexed seqIF microscopy showing intratumor heterogeneity of signaling mechanisms and cell types in the region of M9 with WHO grade 2 (left) and WHO grade 3 (right) histology, as well as ARID1A and Chr4/14q loss. Scale bar, 1mm. b, Multiplexed seqIF microscopy showing M9 from a at higher magnification. Scale bar, 200μmm. c, Multiplexed seqIF microscopy showing intratumor heterogeneity of signaling mechanisms in the region of M10 with reduced immunostaining for p16 (top) and Chr4q/9p/10q loss. Scale bar, 1mm. d, Spatial deconvolution of meningioma single-cell RNA sequencing showing spatial evolution of cell types from in M9 in a and b (left) or M10 in c (right). Scale bar, 1mm.
Figure 7
Figure 7. A preclinical platform for testing personalized medical therapies to overcome intratumor heterogeneity in high-grade meningiomas.
a, Network of gene circuits distinguishing M10GdCas9-KRAB meningioma cells expressing sgNTC (n=3), sgCDKN2A (n=3), sgCDKN2B (n=3), or sgARID1A (n=3) using RNA sequencing. Nodes represent pathways and edges represent shared genes between pathways (p£0.05, FDR£0.05). Red nodes are enriched and blue nodes are suppressed in experimental versus sgNTC control conditions. b, Abemaciclib treatments of 3D organoid co-cultures of M10GdCas9-KRAB meningioma cells expressing sgNTC, sgCDKN2A, sgCDKN2B, or sgARID1A. Scale bar, 100μm. c, Quantification of abemaciclib treatments of 3D organoid co-cultures of M10GdCas9-KRAB meningioma cells expressing sgNTC, sgCDKN2A, sgCDKN2B, or sgARID1A. Representative of 8–10 biological replicates per condition. d, Differentially expressed spatial proteins from M9 (all with Student’s t test p£0.05 for at least 2 of 3 regionally distinct comparisons). e, Quantification of molecular therapy treatments of 3D organoid co-cultures of M10GdCas9-KRAB meningioma cells expressing sgNTC or sgARID1A. Representative of 8–10 biological replicates per condition. Scale from c. f, Combination molecular therapy treatments of 3D organoid co-cultures of M10GdCas9-KRAB meningioma cells expressing sgCDKN2A or sgNTC. Scale bar, 100μm. g, Combination molecular therapy treatments of 3D organoid co-cultures of M10GdCas9-KRAB meningioma cells expressing sgCDKN2A or sgARID1A. Scale bar, 100μm. h, Quantification of combination molecular therapy treatments of 3D organoid co-cultures of M10GdCas9-KRAB meningioma cells expressing sgCDKN2A or sgNTC. Representative of 8 biological replicates per condition. Scale from c. i, Quantification of combination molecular therapy treatments of 3D organoid co-cultures of M10GdCas9-KRAB meningioma cells expressing sgCDKN2A or sgARID1A. Representative of 8 biological replicates per condition. Scale from c.

References

    1. Wang J. et al. Clonal evolution of glioblastoma under therapy. Nat Genet 48, 768–776 (2016). - PMC - PubMed
    1. Andor N. et al. Pan-cancer analysis of the extent and consequences of intratumor heterogeneity. Nat Med 22, 105–113 (2016). - PMC - PubMed
    1. Gerstung M. et al. The evolutionary history of 2,658 cancers. Nature 578, 122–128 (2020). - PMC - PubMed
    1. Jamal-Hanjani M. et al. Tracking the Evolution of Non–Small-Cell Lung Cancer. New Engl J Med 376, 2109–2121 (2017). - PubMed
    1. Wang L. et al. A single-cell atlas of glioblastoma evolution under therapy reveals cell-intrinsic and cell-extrinsic therapeutic targets. Nat Cancer 3, 1534–1552 (2022). - PMC - PubMed

Publication types