[Preprint]. 2023 May 23:rs.3.rs-2921860.
doi: 10.21203/rs.3.rs-2921860/v1.

Integrated multimodal cell atlas of Alzheimer's disease

Mariano I Gabitto  1 Kyle J Travaglini  1 Victoria M Rachleff  1   2 Eitan S Kaplan  1 Brian Long  1 Jeanelle Ariza  2 Yi Ding  1 Joseph T Mahoney  1 Nick Dee  1 Jeff Goldy  1 Erica J Melief  2 Krissy Brouner  1 John Campos  2 Ambrose J Carr  3 Tamara Casper  1 Rushil Chakrabarty  1 Michael Clark  1 Jazmin Compos  1 Jonah Cool  3 Nasmil J Valera Cuevas  1 Rachel Dalley  1 Martin Darvas  2 Song-Lin Ding  1 Tim Dolbeare  1 Christine L Mac Donald  4 Tom Egdorf  1 Luke Esposito  1 Rebecca Ferrer  1 Rohan Gala  1 Amanda Gary  1 Jessica Gloe  1 Nathan Guilford  1 Junitta Guzman  1 Windy Ho  1 Tim Jarksy  1 Nelson Johansen  1 Brian E Kalmbach  1 Lisa M Keene  2 Sarah Khawand  2 Mitch Kilgore  2 Amanda Kirkland  2 Michael Kunst  1 Brian R Lee  1 Jocelin Malone  1 Zoe Maltzer  1 Naomi Martin  1 Rachel McCue  1 Delissa McMillen  1 Emma Meyerdierks  1 Kelly P Meyers  5 Tyler Mollenkopf  1 Mark Montine  2 Amber L Nolan  2 Julie Nyhus  1 Paul A Olsen  1 Maiya Pacleb  2 Thanh Pham  1 Christina Alice Pom  1 Nadia Postupna  2 Augustin Ruiz  1 Aimee M Schantz  2 Staci A Sorensen  1 Brian Staats  1 Matt Sullivan  1 Susan M Sunkin  1 Carol Thompson  1 Michael Tieu  1 Jonathan Ting  1 Amy Torkelson  1 Tracy Tran  1 Ming-Qiang Wang  1 Jack Waters  1 Angela M Wilson  2 David Haynor  6 Nicole Gatto  5 Suman Jayadev  7 Shoaib Mufti  1 Lydia Ng  1 Shubhabrata Mukherjee  8 Paul K Crane  8 Caitlin S Latimer  2 Boaz P Levi  1 Kimberly Smith  1 Jennie L Close  1 Jeremy A Miller  1 Rebecca D Hodge  1 Eric B Larson  8 Thomas J Grabowski  6 Michael Hawrylycz  1 C Dirk Keene  2 Ed S Lein  1
Affiliations

Integrated multimodal cell atlas of Alzheimer's disease

Mariano I Gabitto et al. Res Sq. .

Update in

  • Integrated multimodal cell atlas of Alzheimer's disease.
    Gabitto MI, Travaglini KJ, Rachleff VM, Kaplan ES, Long B, Ariza J, Ding Y, Mahoney JT, Dee N, Goldy J, Melief EJ, Agrawal A, Kana O, Zhen X, Barlow ST, Brouner K, Campos J, Campos J, Carr AJ, Casper T, Chakrabarty R, Clark M, Cool J, Dalley R, Darvas M, Ding SL, Dolbeare T, Egdorf T, Esposito L, Ferrer R, Fleckenstein LE, Gala R, Gary A, Gelfand E, Gloe J, Guilford N, Guzman J, Hirschstein D, Ho W, Hupp M, Jarsky T, Johansen N, Kalmbach BE, Keene LM, Khawand S, Kilgore MD, Kirkland A, Kunst M, Lee BR, Leytze M, Mac Donald CL, Malone J, Maltzer Z, Martin N, McCue R, McMillen D, Mena G, Meyerdierks E, Meyers KP, Mollenkopf T, Montine M, Nolan AL, Nyhus JK, Olsen PA, Pacleb M, Pagan CM, Peña N, Pham T, Pom CA, Postupna N, Rimorin C, Ruiz A, Saldi GA, Schantz AM, Shapovalova NV, Sorensen SA, Staats B, Sullivan M, Sunkin SM, Thompson C, Tieu M, Ting JT, Torkelson A, Tran T, Valera Cuevas NJ, Walling-Bell S, Wang MQ, Waters J, Wilson AM, Xiao M, Haynor D, Gatto NM, Jayadev S, Mufti S, Ng L, Mukherjee S, Crane PK, Latimer CS, Levi BP, Smith KA, Close JL, Miller JA, Hodge RD, Larson EB, Grabowski TJ, Hawrylycz M, Keene CD, Lein ES. Gabitto MI, et al. Nat Neurosci. 2024 Dec;27(12):2366-2383. doi: 10.1038/s41593-024-01774-5. Epub 2024 Oct 14. Nat Neurosci. 2024. PMID: 39402379 Free PMC article.

Abstract

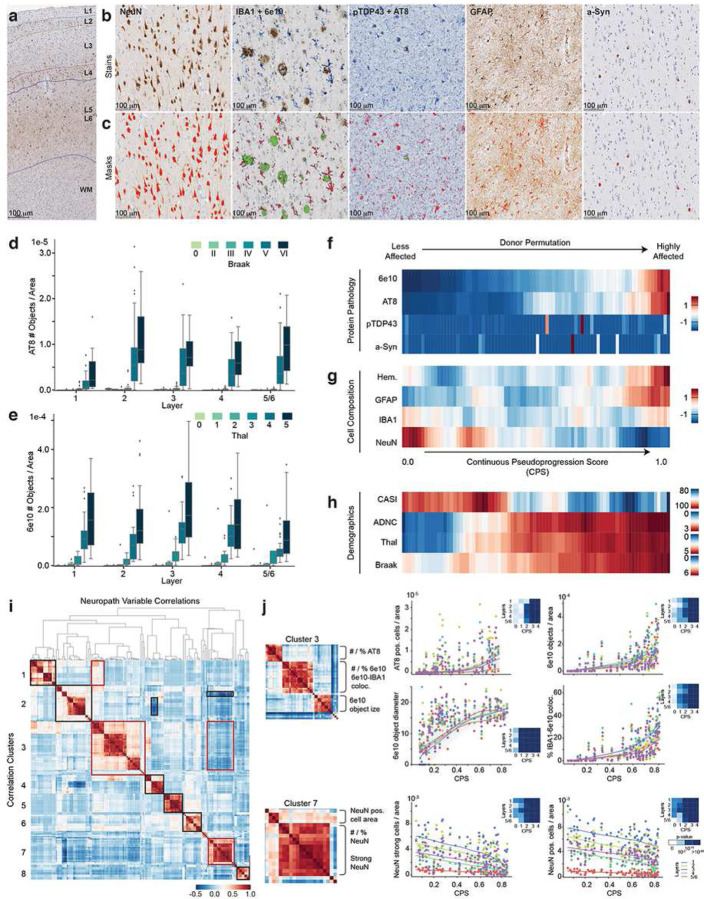
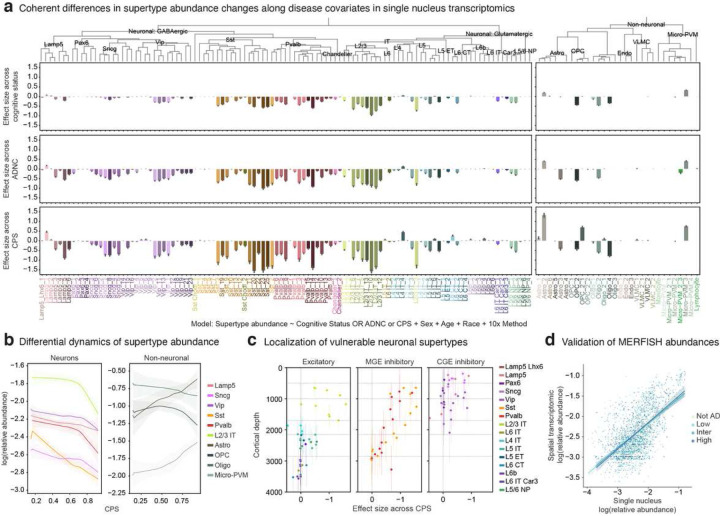
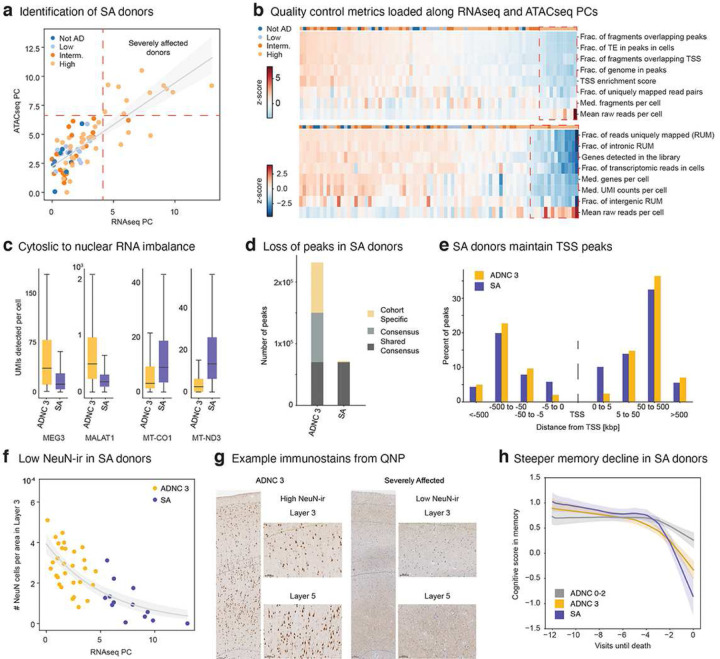
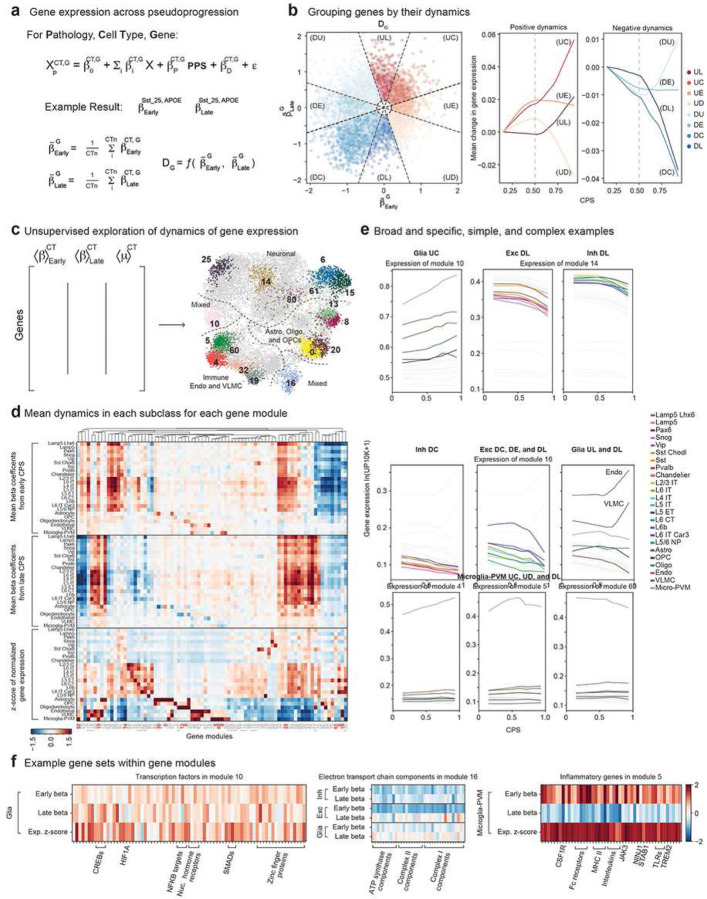
Alzheimer's disease (AD) is the most common cause of dementia in older adults. Neuropathological and imaging studies have demonstrated a progressive and stereotyped accumulation of protein aggregates, but the underlying molecular and cellular mechanisms driving AD progression and vulnerable cell populations affected by disease remain coarsely understood. The current study harnesses single cell and spatial genomics tools and knowledge from the BRAIN Initiative Cell Census Network to understand the impact of disease progression on middle temporal gyrus cell types. We used image-based quantitative neuropathology to place 84 donors spanning the spectrum of AD pathology along a continuous disease pseudoprogression score and multiomic technologies to profile single nuclei from each donor, mapping their transcriptomes, epigenomes, and spatial coordinates to a common cell type reference with unprecedented resolution. Temporal analysis of cell-type proportions indicated an early reduction of Somatostatin-expressing neuronal subtypes and a late decrease of supragranular intratelencephalic-projecting excitatory and Parvalbumin-expressing neurons, with increases in disease-associated microglial and astrocytic states. We found complex gene expression differences, ranging from global to cell type-specific effects. These effects showed different temporal patterns indicating diverse cellular perturbations as a function of disease progression. A subset of donors showed a particularly severe cellular and molecular phenotype, which correlated with steeper cognitive decline. We have created a freely available public resource to explore these data and to accelerate progress in AD research at SEA-AD.org.


Conflict of interest statement

Additional Declarations: There is NO Competing Interest.

Figures

Figure 1
Figure 1. MTG quantitative neuropathology orders donors according to pseudo-progression of disease.
A) MTG tissue is annotated to discriminate cortical layers 1–6, in addition to the white matter (WM)boundary. B) Pathological proteins (Aβ (6e10), pTau (AT8), α-Syn, and pTDP43) and cellular populations (neurons (NeuN), microglia (Iba1), and astrocytes (GFAP)) are immunoassayed. C) Masks created by HALO software to quantify each immunoassay of panel B. D) Boxplot organizing quantitative pTau measurements (number of AT8-ir pTau-bearing cells) accordingto Braak Stage. E) Boxplot organizing quantitative Aβ measurements (number of 6e10-ir Aβ plaques) according to Thal Phase. F) Average white matter measurements obtained for immunoassayed protein pathologies (Aβ, pTau, α-Syn, and pTDP43) or G) immunoassayed cellular populations (neurons, microglia, and Astrocytes), ordered according to continuous pseudo-progression score. Layer information from F) and G) entered the calculation of continuous pseudo-progression score. H) Pseudo-progression score orders donors recapitulating cognitive decline (CASI) and increased in brain-wide pathology (ADNC, Thal Phase, Braak Stage). Of note, all measurements are orthogonal to the information used to build the pseudo-progression score. I) Hierarchically organized correlation matrix depicting correlation across all quantitative neuropathologyvariables. This matrix can be organized into seven different correlation clusters. J) Cluster 7 of the correlation matrix depicted in I) comprised variables decreasing their value alongcontinuous pseudo-progression, such as the number of NeuN-ir cells or percent NeuN-ir cell area. Correlation cluster 3 is comprised of variables increasing along pseudo-progression, such as the number of AT8-ir pTau-bearing cells, 6e10-ir Aβ plaques or the size of the 6e10-ir Aβ plaques. Left, reproduction of correlation values for each cluster. Right, traces for representative variables showing layer information along pseudo-progression. The heatmap on each time trace represents p-value signi cance for a general additive model in which pseudo-progression is binned in 5 intervals.
Figure 2
Figure 2. Vulnerable Populations in MTG concentrate around super cial supragranular layers.
A) Resulting effect size of a linear mixed model explaining the proportion of each population by (Top)cognitive status, (Middle) ADNC, or (Bottom) Pseudo-progression, controlling for sex, age, and single-cell technology. Negative/positive values indicate that populations are decreasing/increasing along pseudoprogression score with respect to the covariate under analysis. B) Logarithm of the relative abundance along pseudo-progression score for neurons and non-neuronalcells organized by their subclasses. C) Cortical layer localization of vulnerable neuronal populations. Each dot represents a supertypecolorcoded by subclass. D) Plot depicting the logarithmic relative abundance for each cell type in each donor assayed bysinglenucleus RNA-seq versus spatial transcriptomic.
Figure 3
Figure 3. A subset of donor present high vulnerability to AD, exhibiting shutdown of their transcriptional machinery, and pronounced cognitive decline.
A) First principal component for single-nucleus RNA-seq quality control metrics versus single-nucleusATAC-seq for each library in each donor color-coded by ADNC category. B) Depiction of quality control metrics for single-nucleus RNA-seq library (bottom) or single-nucleusATAC-seq library (top) order by their loading along the rst principal component of each modality. C) UMIs detected per cell for mitochondrial genes MT-CO1, MT-ND3 or markers of nuclear RNA, MEG3 orMALAT1 for a subset of 11 donors with ADNC 3 or ADNC 3 highly vulnerable. D) Number of chromatin accessible regions in ADNC 3 donors or (severely affected) SA donors. SharedConsensus accessible regions are regions shared across all cohorts. Consensus regions denote regions shared across members of each cohort and cohort specific depict peaks unique to some members of each cohort. E) Distribution of the percentage of accessible regions in ADNC 3 or SA donors organized by theirdistance from the transcription start site of the nearest gene. F) Number of NeuN immunoreactive cells per area in layer 3 along the quality control rst principalcomponent. SA donors localize at the end of this trajectory and exhibit almost no immunoreactive cells. G) Example case depicting the NeuN immunoreactive cells in ADNC 3 donors and the lack ofimmunoreactivity in SA donors. H) SA donors exhibit pronounced memory cognitive decline compared to ADNC 3 donors. Cognitive scorefor each donor plot across visits until time of death.
Figure 4:
Figure 4:. Gene expression changes along pseudo-progression exhibit complex cell type-specific dynamical patterns.
A) Linear mixed model used to analyze gene expression changes along pseudo progression score. Controlling by covariates such as sex, age and single-nucleus technology, pseudo-progression score is separated in 2 bins and early (low pathology) and late (high pathology) beta coe cients associated with pseudo-progression are calculated. B) Genes can be categorized into 8 bins given their dynamical properties. Left, early versus latestandardized beta coefficients for each gene in each supertype. Each gene is categorized according to its dynamical changes according to the following categories: DU, down up. DE, down early. DC, down consistently. DL, down late. UD, up down. UE, up early. UC, up consistently. UL, up late. Right, example genes in each of the C) Framework to explore gene expression changes in an unsupervised manner. For each gene, early andlate beta coefficients and mean expression values are collected in each cell type (left). Next, an unsupervised low dimensional representation is built for all genes (right). Low dimensional representation is color coded by the cell types in which mean expression values are higher. D) Heatmap displaying means of early and late beta coefficients together with z-score gene expression. Each row represents a subclass and each column a gene module obtained from C). E) Dynamics along CPS of different gene modules color coded by subclass. Top panels representmodules with similar dynamics across glial subclasses (Module 10) or excitatory and inhibitory neurons (Module 14). Middle panels represent a module with complex dynamics, different in inhibitory neurons (DC), excitatory (DC, DE, DL), and glial cells (UL, DL). Bottom panels highlight a module specific to the Micro-PVM subclass. F) Example gene modules (10, 16, 5) highlighting their gene ontology description and families of geneswithin them.
Figure 5
Figure 5. Vulnerable MGE-derived inhibitory interneurons exhibit similar transcriptional pro les and common electrophysiological features.
A) UMAP representation of MGE-derived neurons (Sst, Pvalb) color coded by supertype (left), or effectsize associated with CPS (right). B) Correlation matrix of average gene expression pro les for each supertype. Gene expression pro les areltered to select only highly variable genes. C) Mean enrichment calculated across affected Sst supertypes versus affected Pvalb supertypes. D) Morphological reconstructions of affected MGE-derived interneurons. E) SAG and TAU are the two most variable electrophysiological features across affected and nonaffectedMGE-derived supertypes. Boxplot depicting tau and sag distributions in affected and nonaffected MGE-derived subclasses. F) Dynamics of gene modules preferentially expressed in Sst supertypes. Left, Mean gene expressionzscore versus t-statistics between early beta coefficients affected and unaffected Sst supertypes. Grey clusters were driven by a single supertype and not considered. Right, unnormalized mean gene expression (counts) of different gene modules (81, 45, 47, 27) in affected and unaffected supertypes (Top). Bottom, change in expression from baseline. G) Difference in beta coefficient and gene expression z-score for genes in modules depicted in F).

Similar articles

  • Integrated multimodal cell atlas of Alzheimer's disease.
    Gabitto MI, Travaglini KJ, Rachleff VM, Kaplan ES, Long B, Ariza J, Ding Y, Mahoney JT, Dee N, Goldy J, Melief EJ, Agrawal A, Kana O, Zhen X, Barlow ST, Brouner K, Campos J, Campos J, Carr AJ, Casper T, Chakrabarty R, Clark M, Cool J, Dalley R, Darvas M, Ding SL, Dolbeare T, Egdorf T, Esposito L, Ferrer R, Fleckenstein LE, Gala R, Gary A, Gelfand E, Gloe J, Guilford N, Guzman J, Hirschstein D, Ho W, Hupp M, Jarsky T, Johansen N, Kalmbach BE, Keene LM, Khawand S, Kilgore MD, Kirkland A, Kunst M, Lee BR, Leytze M, Mac Donald CL, Malone J, Maltzer Z, Martin N, McCue R, McMillen D, Mena G, Meyerdierks E, Meyers KP, Mollenkopf T, Montine M, Nolan AL, Nyhus JK, Olsen PA, Pacleb M, Pagan CM, Peña N, Pham T, Pom CA, Postupna N, Rimorin C, Ruiz A, Saldi GA, Schantz AM, Shapovalova NV, Sorensen SA, Staats B, Sullivan M, Sunkin SM, Thompson C, Tieu M, Ting JT, Torkelson A, Tran T, Valera Cuevas NJ, Walling-Bell S, Wang MQ, Waters J, Wilson AM, Xiao M, Haynor D, Gatto NM, Jayadev S, Mufti S, Ng L, Mukherjee S, Crane PK, Latimer CS, Levi BP, Smith KA, Close JL, Miller JA, Hodge RD, Larson EB, Grabowski TJ, Hawrylycz M, Keene CD, Lein ES. Gabitto MI, et al. Nat Neurosci. 2024 Dec;27(12):2366-2383. doi: 10.1038/s41593-024-01774-5. Epub 2024 Oct 14. Nat Neurosci. 2024. PMID: 39402379 Free PMC article.
  • Integrative network analysis of nineteen brain regions identifies molecular signatures and networks underlying selective regional vulnerability to Alzheimer's disease.
    Wang M, Roussos P, McKenzie A, Zhou X, Kajiwara Y, Brennand KJ, De Luca GC, Crary JF, Casaccia P, Buxbaum JD, Ehrlich M, Gandy S, Goate A, Katsel P, Schadt E, Haroutunian V, Zhang B. Wang M, et al. Genome Med. 2016 Nov 1;8(1):104. doi: 10.1186/s13073-016-0355-3. Genome Med. 2016. PMID: 27799057 Free PMC article.
  • Single-cell atlas reveals correlates of high cognitive function, dementia, and resilience to Alzheimer's disease pathology.
    Mathys H, Peng Z, Boix CA, Victor MB, Leary N, Babu S, Abdelhady G, Jiang X, Ng AP, Ghafari K, Kunisky AK, Mantero J, Galani K, Lohia VN, Fortier GE, Lotfi Y, Ivey J, Brown HP, Patel PR, Chakraborty N, Beaudway JI, Imhoff EJ, Keeler CF, McChesney MM, Patel HH, Patel SP, Thai MT, Bennett DA, Kellis M, Tsai LH. Mathys H, et al. Cell. 2023 Sep 28;186(20):4365-4385.e27. doi: 10.1016/j.cell.2023.08.039. Cell. 2023. PMID: 37774677 Free PMC article.
  • [Selective stimulations and lesions of the rat brain nuclei as the models for research of the human sleep pathology mechanisms].
    Šaponjić J. Šaponjić J. Glas Srp Akad Nauka Med. 2011;(51):85-97. Glas Srp Akad Nauka Med. 2011. PMID: 22165729 Review. Serbian.
  • Neuropathology of Alzheimer's Disease.
    Trejo-Lopez JA, Yachnis AT, Prokop S. Trejo-Lopez JA, et al. Neurotherapeutics. 2022 Jan;19(1):173-185. doi: 10.1007/s13311-021-01146-y. Epub 2021 Nov 2. Neurotherapeutics. 2022. PMID: 34729690 Free PMC article. Review.

Cited by

References

    1. Masters C. L. et al. Alzheimer’s disease. Nature Reviews Disease Primers 1, 15056 (2015). - PubMed
    1. Jack C. R. et al. Hypothetical model of dynamic biomarkers of the Alzheimer’s pathological cascade. The Lancet Neurology 9, 119–128 (2010). - PMC - PubMed
    1. Thal D. R., Rub U., Orantes M. & Braak H. Phases of A beta-deposition in the human brain and its relevance for the development of AD. Neurology 58, 1791–1800 (2002). - PubMed
    1. Braak H. & Braak E. Neuropathological stageing of Alzheimer-related changes. Acta neuropathologica 82, 239–259 (1991). - PubMed
    1. Jack C. R. et al. A/T/N: An unbiased descriptive classification scheme for Alzheimer disease biomarkers. Neurology 87, 539–547 (2016). - PMC - PubMed

Publication types

LinkOut - more resources