[Preprint]. 2023 May 17:2023.05.16.23290063.
doi: 10.1101/2023.05.16.23290063.

Insights into human health from phenome- and genome-wide analyses of UK Biobank retinal optical coherence tomography phenotypes

Affiliations

Insights into human health from phenome- and genome-wide analyses of UK Biobank retinal optical coherence tomography phenotypes

Seyedeh Maryam Zekavat et al. medRxiv. .

Abstract

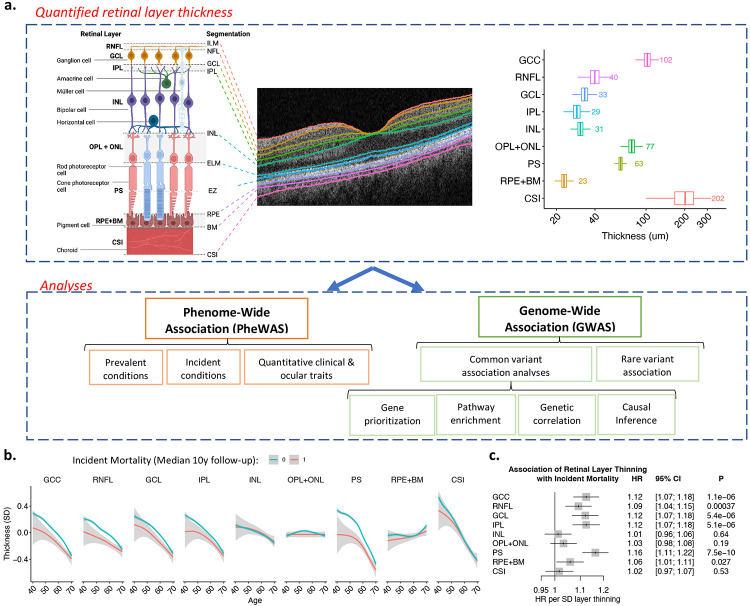
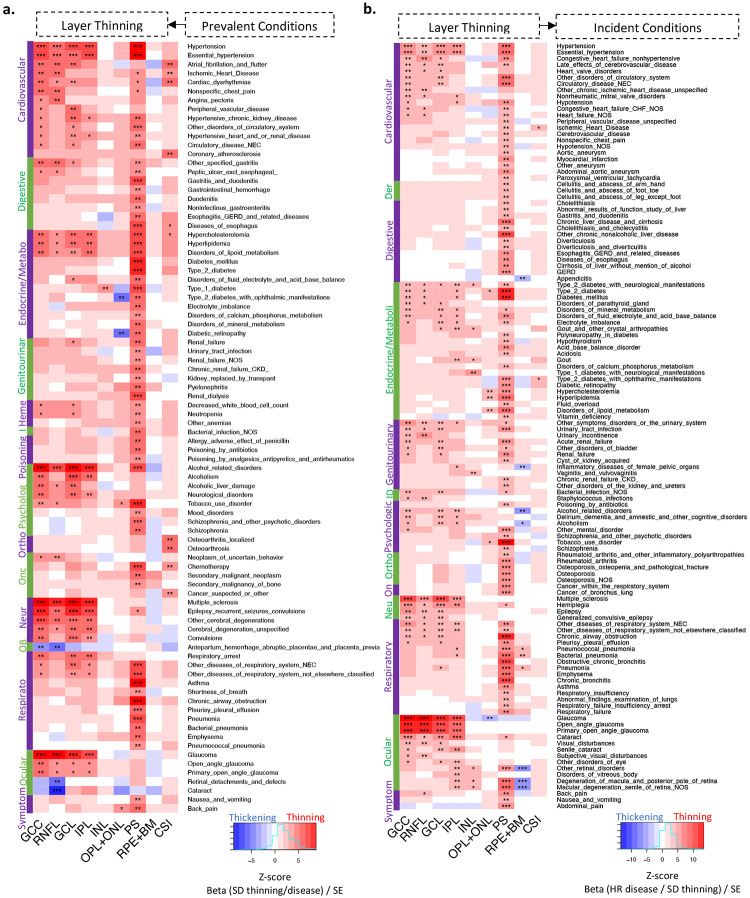
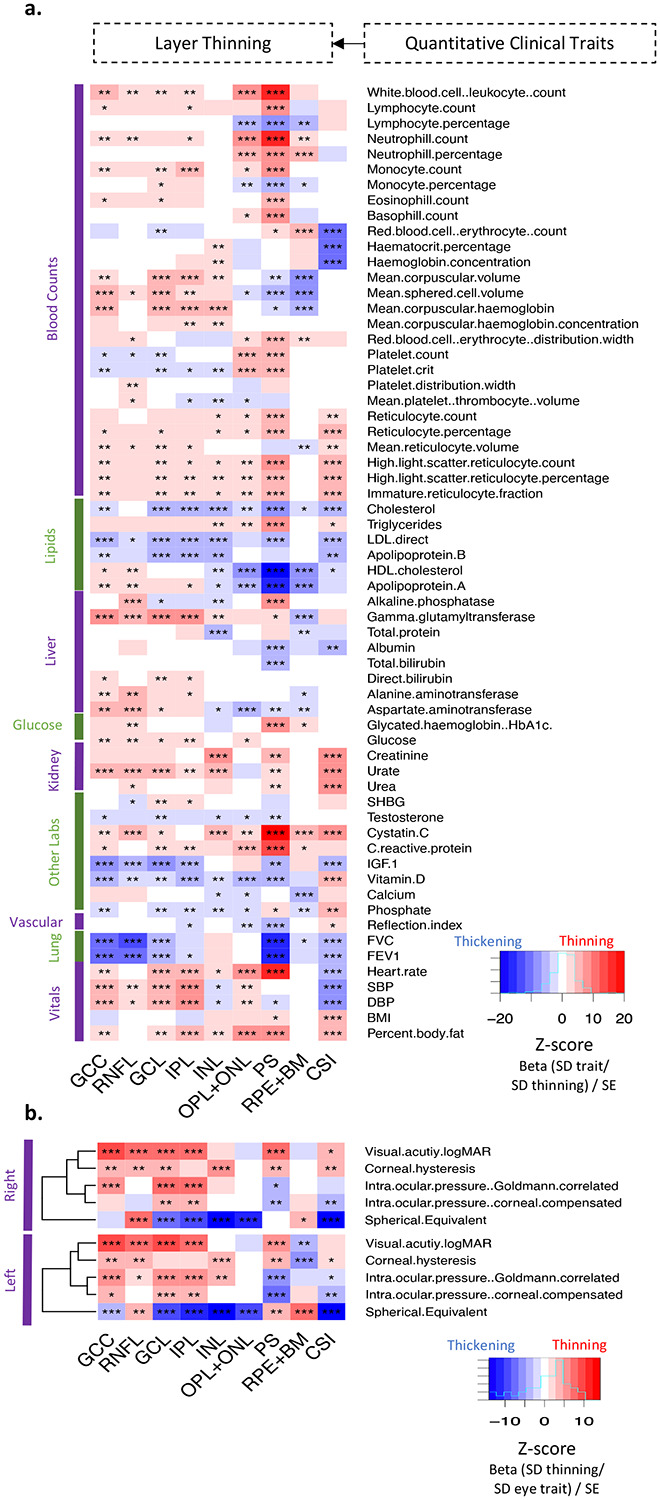
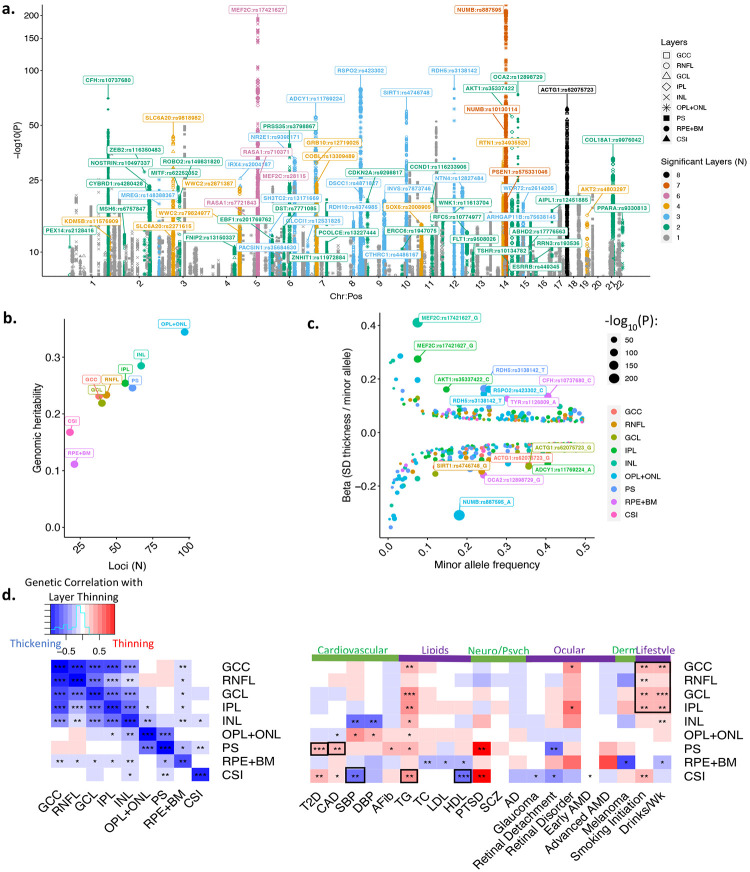
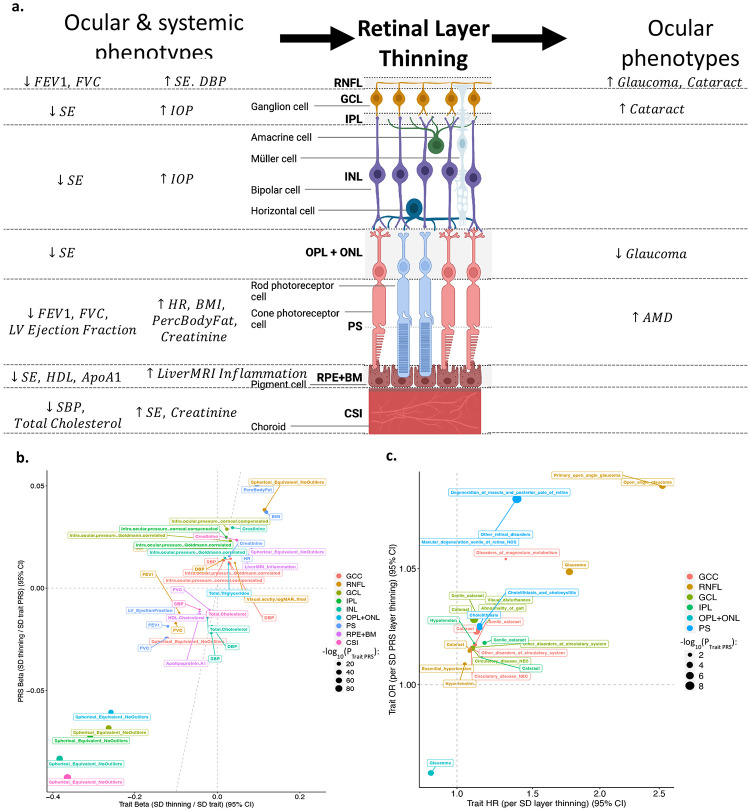
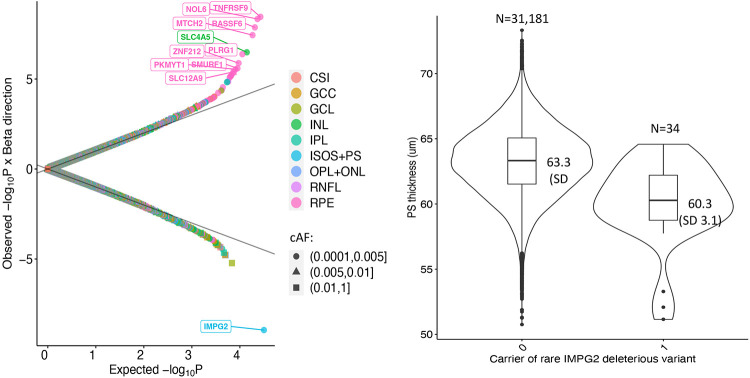
The human retina is a complex multi-layered tissue which offers a unique window into systemic health and disease. Optical coherence tomography (OCT) is widely used in eye care and allows the non-invasive, rapid capture of retinal measurements in exquisite detail. We conducted genome- and phenome-wide analyses of retinal layer thicknesses using macular OCT images from 44,823 UK Biobank participants. We performed phenome-wide association analyses, associating retinal thicknesses with 1,866 incident ICD-based conditions (median 10-year follow-up) and 88 quantitative traits and blood biomarkers. We performed genome-wide association analyses, identifying inherited genetic markers which influence the retina, and replicated our associations among 6,313 individuals from the LIFE-Adult Study. And lastly, we performed comparative association of phenome- and genome- wide associations to identify putative causal links between systemic conditions, retinal layer thicknesses, and ocular disease. Independent associations with incident mortality were detected for photoreceptor thinning and ganglion cell complex thinning. Significant phenotypic associations were detected between retinal layer thinning and ocular, neuropsychiatric, cardiometabolic and pulmonary conditions. Genome-wide association of retinal layer thicknesses yielded 259 loci. Consistency between epidemiologic and genetic associations suggested putative causal links between thinning of the retinal nerve fiber layer with glaucoma, photoreceptor segment with AMD, as well as poor cardiometabolic and pulmonary function with PS thinning, among other findings. In conclusion, retinal layer thinning predicts risk of future ocular and systemic disease. Furthermore, systemic cardio-metabolic-pulmonary conditions promote retinal thinning. Retinal imaging biomarkers, integrated into electronic health records, may inform risk prediction and potential therapeutic strategies.


Figures

Figure 1:
Figure 1:
Study schematic and retinal layer thickness measurements. a. Here, we first quantified the thickness of 9 retinal layers across all individuals with retinal OCT imaging data available in the UK Biobank (N=44,823). We then used these measurements to perform phenome- and genome-wide association analyses to identify what phenotypes are associated with the different layers of the retina, and what genetic variants influence these layers. Measured thickness of the retinal layers in microns is provided. b. Relationship of normalized retinal layer thickness with age stratified by incident mortality (1,746 cases, 39,188 controls) across a median 10-year follow-up period. c. Association of retinal layer thinning with incident mortality, adjusted for age, age2, sex, height, weight, ethnicity, and spherical equivalent. ILM = Internal limiting membrane, NFL = nerve fiber layer, GCC = ganglion cell complex or RNFL+GCL+IPL, GCL = ganglion cell layer, IPL = inner plexiform layer, INL = inner nuclear layer, ELM = external limiting membrane, EZ = ellipsoid zone, also known as photoreceptor inner segment/outer segment junction, RPE = retinal pigment epithelium, BM = Bruch’s membrane, CSI = choroid-sclera interface, RNFL = retinal nerve fiber layer, OPL+ONL = outer plexiform layer and outer nuclear layer, PS = photoreceptor segment, RPE+BM = retinal pigment epithelium and Bruch’s membrane complex.
Figure 2:
Figure 2:
Phenome-wide association study of retinal layer thickness with prevalent and incident disease. a. Association of prevalent disease (i.e., disease present at time of retinal imaging) with retinal layer thinning in logistic regression models. b. Association of retinal layer thickness with incident disease (i.e., disease that developed after retinal imaging during followup), in Cox Proportional hazard models. All analyses are adjusted for age, age2, sex, height, weight, ethnicity, and spherical equivalent. Across both panels, phenotypes with at least one layer having false discovery rate (FDR)<0.01 were included in the plots. Within cells, association strength is denoted as such: ***FDR<1x10⁻⁴, **1x10⁻⁴≤FDR<0.01, *0.01≤FDR<0.05. The color reflects the z-score (or beta in units of SD thinning/standard error) for association, where red reflects layer thinning and blue reflects thickening. Full results are available in Supplementary Tables 3,4. GCC = ganglion cell complex or RNFL+GCL+IPL, RNFL = retinal nerve fiber layer, GCL = ganglion cell layer, IPL = inner plexiform layer, INL = inner nuclear layer, OPL+ONL = outer plexiform layer and outer nuclear layer, PS = photoreceptor segment, RPE+BM = retinal pigment epithelium and Bruch’s membrane complex, CSI = choroid layer.
Figure 3:
Figure 3:
Phenome-wide association study of quantitative clinical traits with retinal layer thinning. Association of quantitative a. clinical and b. ocular traits acquired at time of imaging with retinal layer thinning in linear regression models. All analyses are adjusted for age, age2, sex, height, weight, ethnicity, and spherical equivalent. Across both panels, phenotypes with at least one layer having false discovery rate (FDR)<0.01 were included in the plots. Within cells, association strength is denoted as such: ***FDR<1x10⁻⁴, **1x10⁻⁴≤FDR<0.01, *0.01≤FDR<0.05. The color reflects the z-score (or beta in units of SD quantitative trait/ SD thinning/standard error) for association, where red reflects layer thinning and blue reflects thickening. Full results are available in Supplementary Table 5. GCC = ganglion cell complex or RNFL+GCL+IPL, RNFL = retinal nerve fiber layer, GCL = ganglion cell layer, IPL = inner plexiform layer, INL = inner nuclear layer, OPL+ONL = outer plexiform layer and outer nuclear layer, PS = photoreceptor segment, RPE+BM = retinal pigment epithelium and Bruch’s membrane complex, CSI = choroid layer.
Figure 4:
Figure 4:
Genome-wide association study of retinal layer thickness. a. Manhattan plot of genome-wide significant variants (P<5x10⁻⁸) with retinal layer thickness across 9 retinal layers. Analyses are adjusted for age, age2, sex, spherical equivalent, genetic ancestry, and genotyping array. Individual dots reflect genomic variants which are colored by the number of layers significant for the variant, and shape reflects the layer with the most significant association for that variant. Labeled loci are genome-wide significant in at least 2 layers and are labeled by the top predicted PoPS gene within a 1MB window of the variant. Full results are available in Supplementary Tables 6-7. b. Predicted genomic heritability by layer plotted against the number of genome-wide significant, independent loci (LD clumping with r^2< 0.1) for that layer. c. plot of the minor allele frequency versus effect size beta across all 259 independent, top genome-wide significant variants. Variants with P<1x10-50 are labeled with the gene and variant as well as the minor allele. d. genomic correlation analyses across the 9 layers (left) as well as several available GWAS traits previously published (right). Within cells, association strength is denoted through the corrected P-value as such: ***P<1x10⁻⁴, **1x10⁻⁴≤P<0.01, *0.01≤P<0.05. The color reflects the corrected genomic correlation for association, where red reflects layer thinning and blue reflects thickening. Full quantitative results for the genomic correlation analyses are provided in Supplementary Table 12. GCC = ganglion cell complex or RNFL+GCL+IPL, RNFL = retinal nerve fiber layer, GCL = ganglion cell layer, IPL = inner plexiform layer, INL = inner nuclear layer, OPL+ONL = outer plexiform layer and outer nuclear layer, PS = photoreceptor segment, RPE+BM = retinal pigment epithelium and Bruch’s membrane complex, CSI = choroid layer.
Figure 5:
Figure 5:
Concordant epidemiological and genetic associations with retinal layer thickness. a. Schematic of concordant epidemiological and genetic associations with retinal layer thickness visually showing ocular and systemic phenotypes that may causally influence retinal layer thinning, and the effect of retinal layer thinning on incident ocular phenotypes. b. Plot of quantitative phenotypes which are significantly and directionally concordant in their association with retinal layer thickness both epidemiologically (x-axis) and genomically between polygenic risk scores for the the quantitative phenotypes and retinal layer thickness (y-axis). In both models, analyses are adjusted for age, age2, sex, spherical equivalent, genetic ancestry, and genotyping array. Full results comparing epidemiological and genetic associations between all quantitative traits and retinal layers are provided in Supplementary Table 16. c. Plot of retinal layers which are significantly and directionally concordant in their association with diseases both epidemiologically with incident disease (x-axis) and genomically between polygenic risk scores for the retinal layer and any prevalent or incident disease (y-axis). In both models, analyses are adjusted for age, age2, sex, spherical equivalent, genetic ancestry, and genotyping array. Full results of the retinal layer polygenic risk score associations with all analyzed phenotypes are provided in Supplementary Table 15. GCC = ganglion cell complex or RNFL+GCL+IPL, RNFL = retinal nerve fiber layer, GCL = ganglion cell layer, IPL = inner plexiform layer, INL = inner nuclear layer, OPL+ONL = outer plexiform layer and outer nuclear layer, PS = photoreceptor segment, RPE+BM = retinal pigment epithelium and Bruch’s membrane complex, CSI = choroid layer.
Figure 6:
Figure 6:
Rare variant association study of retinal layer thickness. a. Quantile-quantile plot of rare disruptive variants grouped by gene with retinal layer thickness across 9 retinal layers. Analyses are adjusted for age, age2, sex, spherical equivalent, genetic ancestry, and genotyping array. Labeled dots reflect genome-wide significant genes (P<0.05/11,767=4.2x10−6) which are colored by the respective layer. Full results are available in Supplementary Table 17. b. For the strongest association, of rare disruptive variants in IMPG2 with photoreceptor segment (PS) thickness, violin plots showing that the mean PS thickness in non-carriers (0) is 63.3 (SD 2.7) um versus carriers of a disruptive variant in IMPG2 (1) is 60.3 (SD 3.1) um. GCC = ganglion cell complex or RNFL+GCL+IPL, RNFL = retinal nerve fiber layer, GCL = ganglion cell layer, IPL = inner plexiform layer, INL = inner nuclear layer, OPL+ONL = outer plexiform layer and outer nuclear layer, PS = photoreceptor segment, RPE+BM = retinal pigment epithelium and Bruch’s membrane complex, CSI = choroid layer.

Similar articles

References

    1. Marshall J., The ageing retina: Physiology or pathology. Eye (Basingstoke) 1 (1987), doi:10.1038/eye.1987.47. - DOI - PubMed
    1. Solberg Y., Rosner M., Belkin M., The association between cigarette smoking and ocular diseases. [Review] [162 refs]. Surv Ophthalmol 42 (1998). - PubMed
    1. Schmidt-Erfurth U., Nutrition and retina.Dev Ophthalmol 38 (2005), doi:10.1159/000082772. - DOI - PubMed
    1. Corso-Díaz X., Jaeger C., Chaitankar V., Swaroop A., Epigenetic control of gene regulation during development and disease: A view from the retina Prog Retin Eye Res 65 (2018), doi:10.1016/j.preteyeres.2018.03.002. - DOI - PMC - PubMed
    1. Unterlauft J. D., Rehak M., Böhm M. R. R., Rauscher F. G., Analyzing the impact of glaucoma on the macular architecture using spectral-domain optical coherence tomography. PLoS One 13 (2018), doi:10.1371/journal.pone.0209610. - DOI - PMC - PubMed

Publication types