[Preprint]. 2023 May 26:rs.3.rs-2960437.
doi: 10.21203/rs.3.rs-2960437/v1.

Higher Neuronal Facilitation and Potentiation with APOE4 Suppressed by Angiotensin II

Affiliations

Higher Neuronal Facilitation and Potentiation with APOE4 Suppressed by Angiotensin II

Sarah B Scheinman et al. Res Sq. .

Update in

Abstract

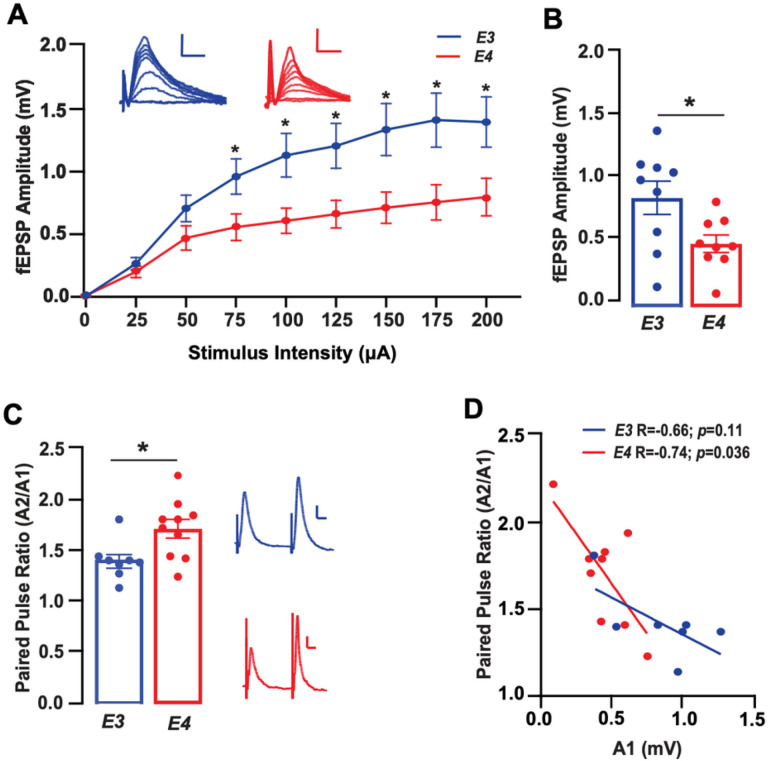
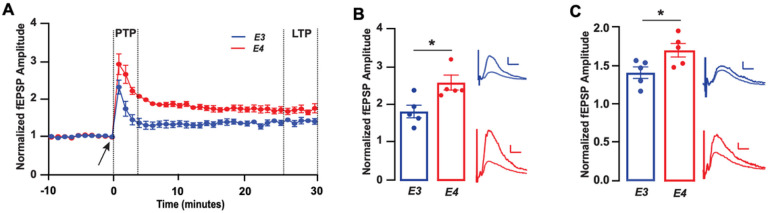
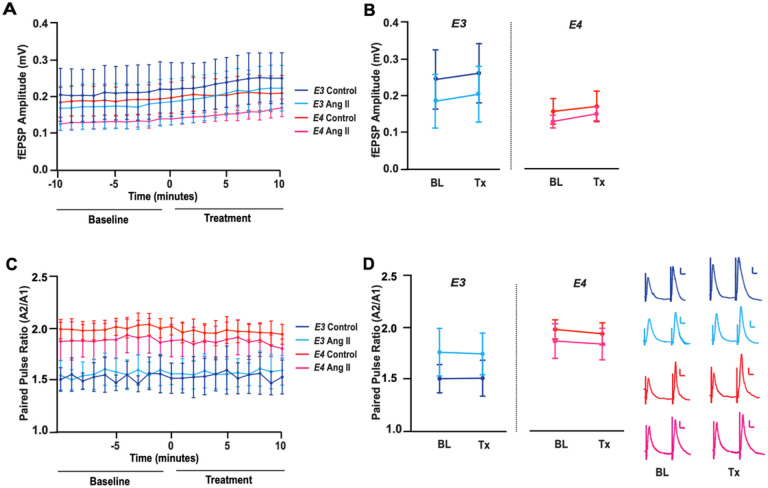
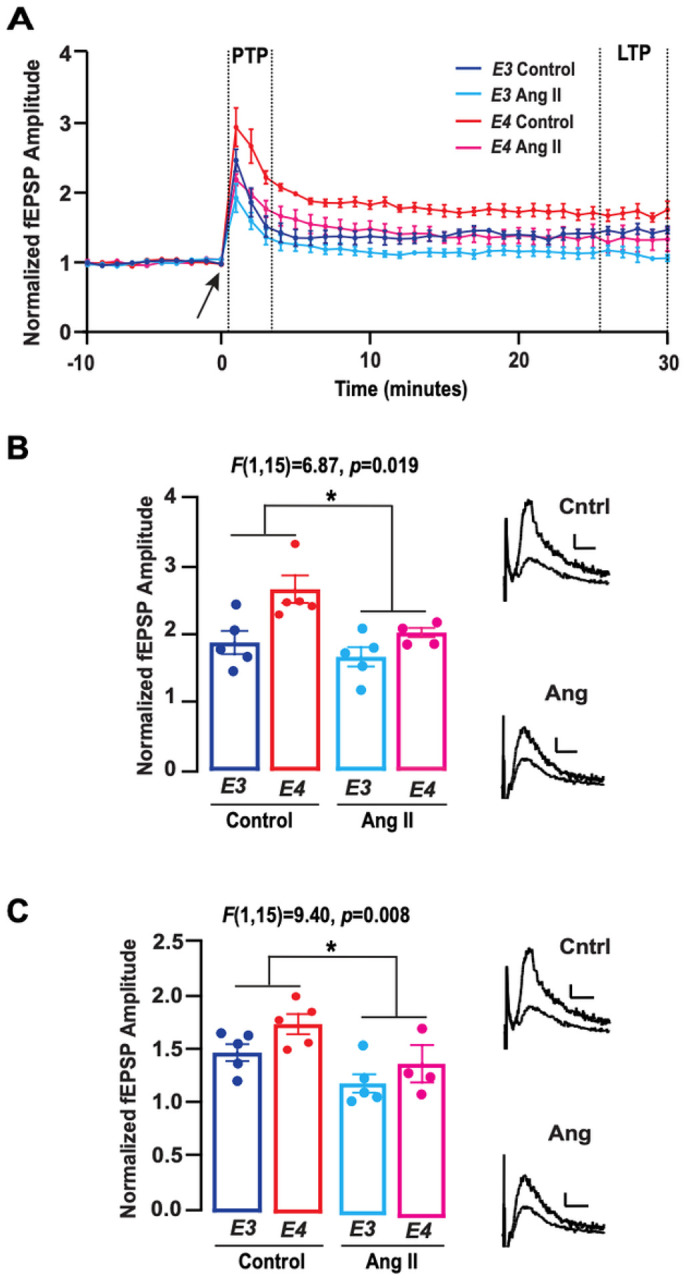
Progressive hippocampal degeneration is a key component of Alzheimer's disease (AD) progression. Therefore, identifying how hippocampal neuronal function is modulated early in AD is an important approach to eventually prevent degeneration. AD-risk factors and signaling molecules likely modulate neuronal function, including APOE genotype and angiotensin II. Compared to APOE3 , APOE4 increases AD risk up to 12-fold, and high levels of angiotensin II are hypothesized to disrupt neuronal function in AD. However, the extent that APOE and angiotensin II modulates the hippocampal neuronal phenotype in AD-relevant models is unknown. To address this issue, we used electrophysiological techniques to assess the impact of APOE genotype and angiotensin II on basal synaptic transmission, presynaptic and post-synaptic activity in mice that express human APOE3 (E3FAD) or APOE4 (E4FAD) and overproduce Aβ. We found that compared to E3FAD mice, E4FAD mice had lower basal synaptic activity, but higher levels of paired pulse facilitation (PPF) and Long-Term Potentiation (LTP) in the Schaffer Collateral Commissural Pathway (SCCP) of the hippocampus. We also found that exogenous angiotensin II has a profound inhibitory effect on hippocampal LTP in both E3FAD and E4FAD mice. Collectively, our data suggests that APOE4 and Aβ are associated with a hippocampal phenotype comprised of lower basal activity and higher responses to high frequency stimulation, the latter of which is suppressed by angiotensin II. These novel data suggest a potential mechanistic link between hippocampal activity, APOE4 genotype and angiotensin II in AD.


Conflict of interest statement

Conflict of Interest. The authors declare that they have no conflict of interest.

Figures

Figure 1
Figure 1. Lower basal synaptic transmission but higher paired pulse facilitation with APOE4as compared to APOE3
(A) Input output (I/O) functions for E3FAD and E4FAD mice at stimulus intensities ranging from 0–200μA. Evoked fEPSP amplitudes were lower in E4FAD as compared to E3FAD mice at stimulus intensities > 75mA (p<0.05 by t-test at each stimulus intensity). (B) Two stimuli were applied to the SCCP at 20Hz and amplitudes of resulting fEPSPs were measured to assess paired pulse facilitation (PPF). The Amplitude of the first fEPSP (A1) was lower in E4FAD mice as compared to E3FAD mice (t(16)=2.45, p=0.023), (C) but the paired pulse ratio (Amplitude of the second fEPSP as a ratio of the amplitude of the first fEPSP – A2/A1) was higher in E4FAD as compared to E3FAD mice (t(16)=2.54, p=0.022). (D) There was also a significant correlation between A1 and PPF ratio in E4FAD (r=0.74, p=0.036) but not E3FAD (r=0.66, p=0.11) mice. Insets A and C show representative traces from E3FAD and E4FAD mice; calibration bars = 0.2mV, 10ms. All data expressed as mean +/− SEM. *p < 0.05 by t-test. n=7 for E3FAD mice, and n=9 for E4FAD mice.
Figure 2
Figure 2. Larger magnitude of response to high frequency stimulation with APOE4 compared to APOE3
(A) Time course data depicting the effect of high frequency stimulation (HFS) on the amplitude of fEPSPs in E3FAD and E4FAD mice. The arrow at 0 minute indicates induction of HFS protocol. Dashed lines between minutes 1–3 indicate post tetanic potentiation (PTP) period and dashed lines between minutes 25–30 indicate long term potentiation (LTP) period. Amplitude of fEPSPs were higher in E4FAD as compared to E3FAD mice during (B) PTP (t(8)=2.95, p=0.018), and (C)LTP (t(8)=2.77, p=0.024) time periods. Insets B and C show representative traces from E3FAD and E4FAD mice during the PTP and LTP time periods, respectively; calibration bars = 0.1mV, 10ms. All data expressed as mean +/− SEM. *p < 0.05 by t-test. n=5 for E3FAD mice, and n=5 for E4FAD mice.
Figure 3
Figure 3. No effect of angiotensin II on basal synaptic transmission or synaptic facilitation with APOE3 or APOE4.
(A) Paired stimuli were applied to the SCCP at 20 Hz every 15s for 20 minutes to assess basal synaptic transmission and paired pulse facilitation (PPF). Time course data of the amplitude of the first response (mV) is depicted. Time 0 indicates bath application of either 10uM of angiotensin II or vehicle treatment. (B) Exogenous angiotensin II did not alter the amplitude of the first evoked fEPSP (A1) in E3FAD (t(8)=0.18, p=0.86) or E4FAD (t(8)=0.81, p=0.43) mice. Vehicle treatment also did not alter A1 in E3FAD (t(6)=0.15, p=0.88) or E4FAD (t(8)=0.27, p=0.79) mice. (C)Time course data of the paired pulse facilitation ratio (A2/A1) is depicted. (D)Exogenous angiotensin II did not alter the PPF ratio in E3FAD (t(8)=0.053, p=0.96) or E4FAD (t(8)=0.13, p=0.89) mice. Vehicle treatment also did not alter the PPF ratio in E3FAD (t(6)=0.022, p=0.98) or E4FAD (t(8)=0.30, p=0.77) mice. All data expressed as mean +/− SEM. p > 0.05 by t-test. n =4 for E3FAD vehicle, n =5 for E3FAD Ang II, n=5 for E4FAD vehicle, and n=5 for E4FAD Ang II.
Figure 4
Figure 4. Angiotensin II suppresses the magnitude of response to high frequency stimulation with APOE3and APOE4.
(A) Time course data depicting the effect of high frequency stimulation (HFS) on the amplitude of fEPSPs in E3FAD and E4FAD mice. The arrow at 0 minute indicates induction of HFS protocol. Dashed lines between minutes 1–3 indicate post tetanic potentiation (PTP) period and dashed lines between minutes 25–30 indicate long term potentiation (LTP) period. (B) During the PTP period, amplitude of the fEPSPs were lower with the addition of 10uM angiotensin II in E3FAD and E4FAD mice (F(1,14) = 5.38, p= 0.036). (C) During the LTP period, amplitude of the fEPSPs were also lower with the addition of 10uM angiotensin II in E3FAD and E4FAD mice (F(1,14) = 11.06, p = 0.005). Insets B and C show representative control and angiotensin II traces for both the PTP and LTP periods. Calibration bars = 0.1mV, 10ms. All data expressed as mean +/− SEM. *p < 0.05 by two-way ANOVA.

Similar articles

References

    1. 2022 Alzheimer’s disease facts and figures. Alzheimers Dement, 2022. 18(4): p. 700–789. - PubMed
    1. Collaborators, G.B.D.D.F., Estimation of the global prevalence of dementia in 2019 and forecasted prevalence in 2050: an analysis for the Global Burden of Disease Study 2019. Lancet Public Health, 2022. 7(2): p. e105–e125. - PMC - PubMed
    1. Mufson E.J., et al., Hippocampal plasticity during the progression of Alzheimer’s disease. Neuroscience, 2015. 309: p. 51–67. - PMC - PubMed
    1. Balestrieri J.V.L., et al., Structural Volume of Hippocampus and Alzheimer’s Disease. Rev Assoc Med Bras (1992), 2020. 66(4): p. 512–515. - PubMed
    1. Scaduto P., et al., Functional excitatory to inhibitory synaptic imbalance and loss of cognitive performance in people with Alzheimer’s disease neuropathologic change. Acta Neuropathol, 2023. 145(3): p. 303–324. - PMC - PubMed

Publication types

LinkOut - more resources