[Preprint]. 2023 May 18:2023.05.15.540823.
doi: 10.1101/2023.05.15.540823.

Tumor Cytokine-Induced Hepatic Gluconeogenesis Contributes to Cancer Cachexia: Insights from Full Body Single Nuclei Sequencing

Affiliations

Tumor Cytokine-Induced Hepatic Gluconeogenesis Contributes to Cancer Cachexia: Insights from Full Body Single Nuclei Sequencing

Ying Liu et al. bioRxiv. .

Abstract

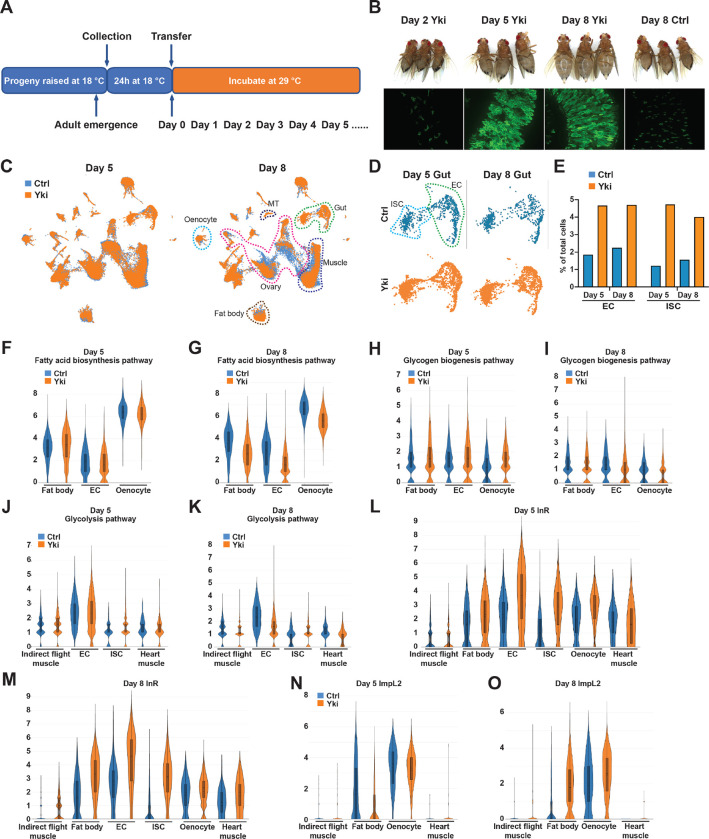
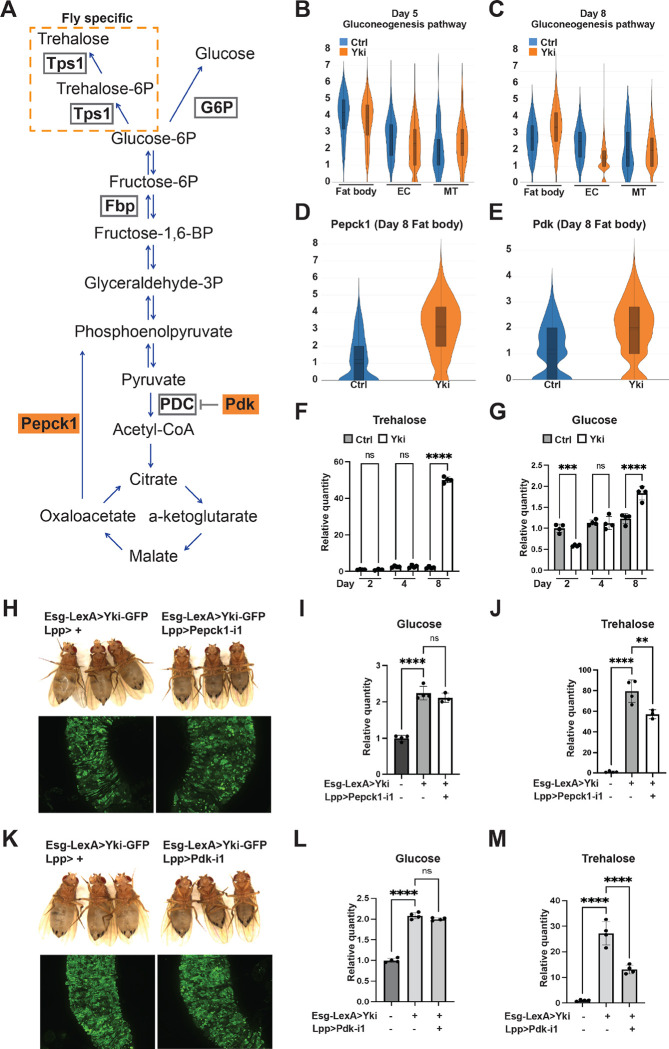
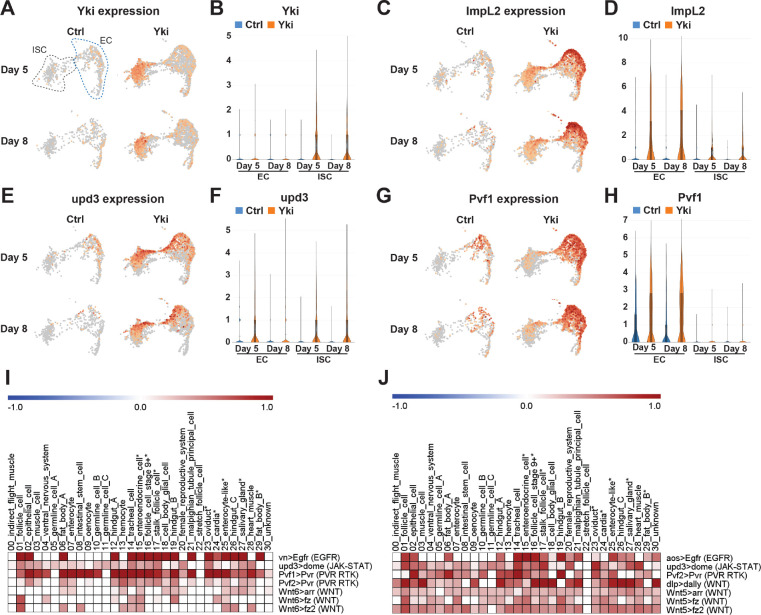
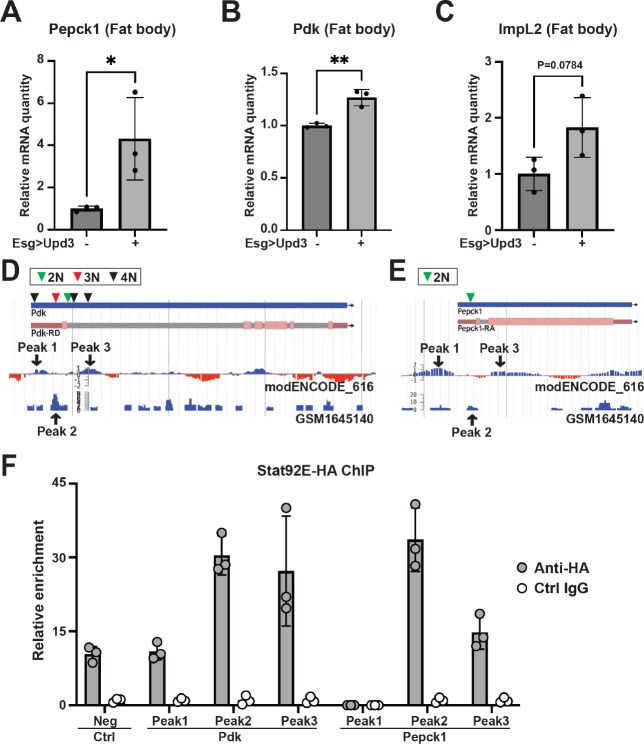
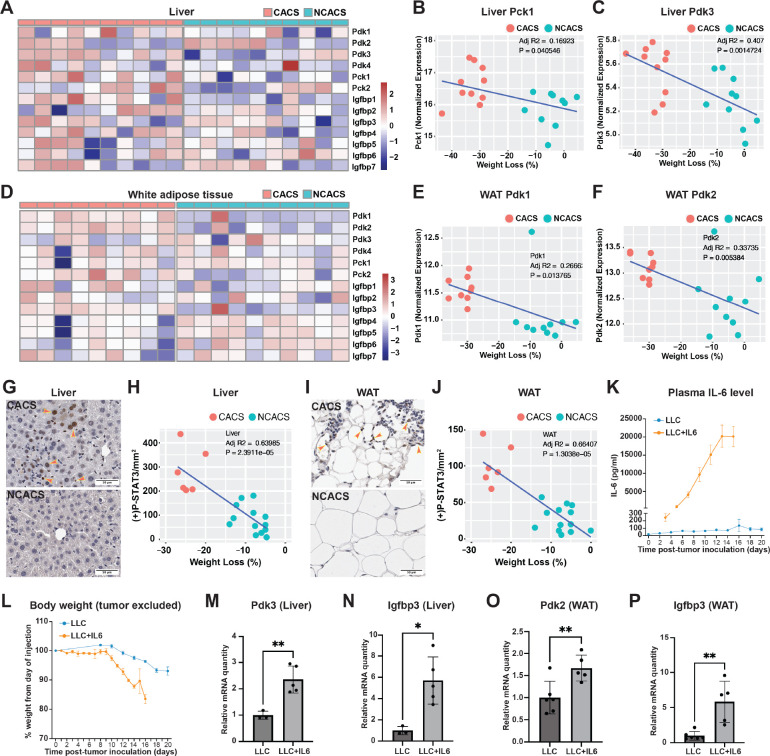
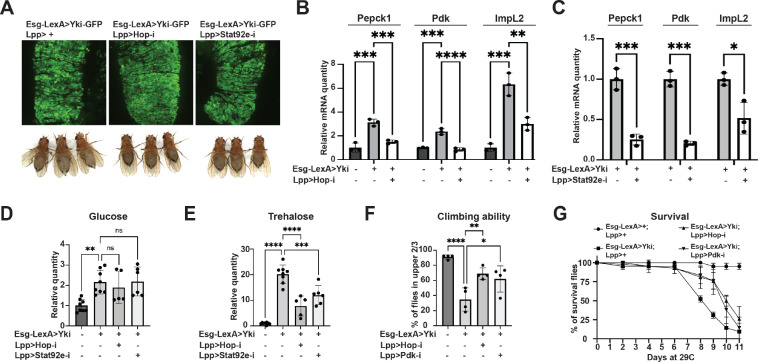
A primary cause of death in cancer patients is cachexia, a wasting syndrome attributed to tumor-induced metabolic dysregulation. Despite the major impact of cachexia on the treatment, quality of life, and survival of cancer patients, relatively little is known about the underlying pathogenic mechanisms. Hyperglycemia detected in glucose tolerance test is one of the earliest metabolic abnormalities observed in cancer patients; however, the pathogenesis by which tumors influence blood sugar levels remains poorly understood. Here, utilizing a Drosophila model, we demonstrate that the tumor secreted interleukin-like cytokine Upd3 induces fat body expression of Pepck1 and Pdk, two key regulatory enzymes of gluconeogenesis, contributing to hyperglycemia. Our data further indicate a conserved regulation of these genes by IL-6/JAK-STAT signaling in mouse models. Importantly, in both fly and mouse cancer cachexia models, elevated gluconeogenesis gene levels are associated with poor prognosis. Altogether, our study uncovers a conserved role of Upd3/IL-6/JAK-STAT signaling in inducing tumor-associated hyperglycemia, which provides insights into the pathogenesis of IL-6 signaling in cancer cachexia.


Conflict of interest statement

Declaration of interests The authors declare no competing interests.

Figures

Figure 1.
Figure 1.. Full-body single-nucleus transcriptome survey of Drosophila Yki flies.
(A) Experimental design of tumor induction in flies. (B) Representative gut tumor and phenotypes of Yki flies at Day 2, Day 5, Day 8, and control flies at Day 8. (C) UMAP visualization of cell clusters of control (coral) and Yki (indigo) flies at Day 5 and Day 8. (D) UMAP visualization of intestinal stem cells (ISC) and enterocyte (EC) clusters of control and Yki flies at Day 5 and 8. (E) EC and ISC proportion comparison between control and Yki flies at Day 5 and 8. Expression levels of fatty acid biosynthesis pathway genes at Day 5 (F) and Day 8 (G) in the fat body, EC, and oenocyte cell clusters represented by violin plots. Expression levels of glycogen biosynthesis pathway genes at Day 5 (H) and Day 8 (I) in the fat body, EC, and oenocyte cell clusters visualized by violin plots. Expression levels of glycolysis pathway genes at Day 5 (J) and Day 8 (K) in the indirect flight muscle, EC, ISC, and heart muscle cell clusters visualized by violin plots. Expression levels of InR at Day 5 (L), Day 8 (M), ImpL2 at Day 5 (N) and Day 8 (O) in the indirect flight muscle, fat body, EC, ISC, oenocyte, heart muscle cell clusters visualized by violin plots. See also Figure S1.
Figure 2.
Figure 2.. Increased expression of Pepck1 and Pdk in the fat body of Yki flies stimulates gluconeogenesis.
(A) Gluconeogenesis pathway in Drosophila. Expression levels of gluconeogenesis pathway genes at Day 5 (B) and Day 8 (C) in the fat body, EC, and malpighian tubule (MT) cell clusters visualized by violin plots. Expression levels of Pepck1 (D) and Pdk (E) at Day 8 in fat body in control and Yki flies visualized by violin plots. Relative whole-body trehalose (F) and glucose (G) levels upon different tumor induction time. (H) Representative gut tumor and phenotype of Yki flies without and with fat body Pepck1 depletion at Day 6. Relative whole-body glucose (I) and trehalose (J) levels of control flies, Yki flies, and Yki flies with fat body Pepck1 depletion at Day 8. (K) Representative gut tumor and phenotype of Yki flies without and with fat body Pdk depletion at Day 6. Relative whole-body glucose (L) and trehalose (M) levels of control flies, Yki flies, and Yki flies with fat body Pdk depletion at Day 8. **p < 0.01, ***p < 0.001, ****p < 0.0001. Error bars indicate SDs. See also Figure S2.
Figure 3
Figure 3. Analysis of perturbed signaling pathways in Yki flies.
UMAP visualization showing enrichment of Yki (A), ImpL2 (C), Upd3 (E), and Pvf1 (G) expression in ISC and EC clusters. Expression levels of Yki (B), ImpL2 (D), Upd3 (F), and Pvf1 (H) in ISC and EC clusters represented by violin plots. Heatmap plots showing selected increased signaling from EC (I) and from ISC (J) upon tumor progression (Day 8 vs Day 5). Darkness reflects increased signaling. See also Figure S3.
Figure 4
Figure 4. The Jak/Stat pathway regulates Pepck1 and Pdk in the fat body.
qRT-PCR analysis of Pepck1 (A), Pdk (B), and ImpL2 (C) mRNA levels in fat body of flies without and with ISC Upd3 expression at Day 8. Data retrieved from ChIP-seq database indicating enrichment of Stat92e binding at Pdk (D) and Pepck1 (E) gene region, inverted triangle indicates STAT binding motif (2N: TTCNNGAA, 3N: TTCNNNGAA, 4N: TTCNNNNGAA). (F) Chromatin immunoprecipitation (ChIP) revealed the enrichment of HA-tagged Stat92E binding at Pepck1 and Pdk gene region showed by fold changes related to control IgG at Day 8. A fragment of Sam-S with no Stat-binding sites was used as the negative control (Neg). *p < 0.05, **p < 0.01. Error bars indicate SDs. See also Figure S4.
Figure 5
Figure 5. Conserved Jak/Stat pathway regulation of cachectic gene expression in hepatocytes and adipocytes.
Heatmap plots showing expression levels of Pdk1–4, Pck1–2, and Igfbp1–7 in liver (A) and WAT (D) of CACS and NCACS KL mice (Columns are showing individual animals). Correlation plots showing positive relations between liver Pck1 expression (B), liver Pdk3 expression (C), WAT Pdk1 expression (E), WAT Pdk2 expression (F) and weight loss of KL mice. Immunohistochemistry (IHC) staining of p-STAT3 in liver (G) and WAT (I) of CACS and NCACS KL mice. Quantifications are shown in (H) and (J), respectively. Plasma IL-6 levels (K) and body weight (L) of B6 mice injected with LLC cells without and with IL-6 expression. qRT-PCR analysis of liver Pdk3 (M), Igfbp3 (N), and WAT Pdk2 (O), Igfbp3 (P) mRNA levels of B6 mice injected with LLC cells without and with IL-6 expression. *p < 0.05, **p < 0.01. Error bars indicate SDs. See also Figure S5.
Figure 6.
Figure 6.. Cachectic role of tumor-induced JAK-STAT signaling.
(A) Representative gut tumor and phenotypes of Yki flies without and with fat body hop or Stat92e depletion at Day 6. (B) qRT-PCR analysis of Pepck1, Pdk, and ImpL2 mRNA levels in the fat body of control flies, Yki flies, and Yki flies with fat body hop depletion at Day 8. (C) qRT-PCR analysis of Pepck1, Pdk, and ImpL2 mRNA levels in the fat body of Yki flies without or with fat body Stat92e depletion at Day 8. Relative whole-body glucose (D) and trehalose (E) levels of control flies, Yki flies, and Yki flies with fat body hop or Stat92e depletion at Day 6. Climbing ability at Day 6 (F) and survival curve (G) of control flies, Yki flies, and Yki flies with fat body hop or Pdk depletion. *p < 0.05, **p < 0.01, ***p < 0.001, ****p < 0.0001. Error bars indicate SDs. See also Figure S6.

Similar articles

References

    1. Agustsson T., D’souza M.A., Nowak G., Isaksson B., 2011. Mechanisms for skeletal muscle insulin resistance in patients with pancreatic ductal adenocarcinoma. Nutrition 27, 796–801. 10.1016/j.nut.2010.08.022 - DOI - PubMed
    1. Argilés J.M., Anker S.D., Evans W.J., Morley J.E., Fearon K.C.H., Strasser F., Muscaritoli M., Baracos V.E., 2010. Consensus on cachexia definitions. J Am Med Dir Assoc 11, 229–230. 10.1016/j.jamda.2010.02.004 - DOI - PubMed
    1. Argilés J.M., Stemmler B., López-Soriano F.J., Busquets S., 2019. Inter-tissue communication in cancer cachexia. Nature Reviews Endocrinology 15, 9–20. 10.1038/s41574-018-0123-0 - DOI - PubMed
    1. Asp M.L., Tian M., Wendel A.A., Belury M.A., 2010. Evidence for the contribution of insulin resistance to the development of cachexia in tumor-bearing mice. Int. J. Cancer 126, 756–763. 10.1002/ijc.24784 - DOI - PubMed
    1. Baker J.C., Yan X., Peng T., Kasten S., Roche T.E., 2000. Marked Differences between Two Isoforms of Human Pyruvate Dehydrogenase Kinase *. Journal of Biological Chemistry 275, 15773–15781. 10.1074/jbc.M909488199 - DOI - PubMed

Publication types