[Preprint]. 2024 Feb 16:2023.05.14.540275.
doi: 10.1101/2023.05.14.540275.

Immersive scene representation in human visual cortex with ultra-wide angle neuroimaging

Affiliations

Immersive scene representation in human visual cortex with ultra-wide angle neuroimaging

Jeongho Park et al. bioRxiv. .

Update in

Abstract

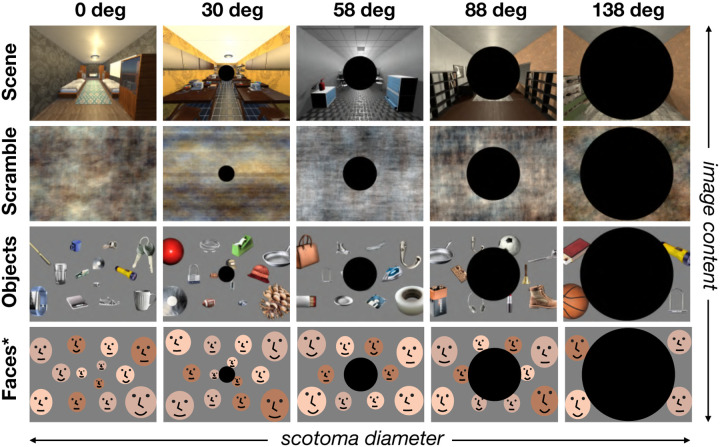
While humans experience the visual environment in a panoramic 220° view, traditional functional MRI setups are limited to display images like postcards in the central 10-15° of the visual field. Thus, it remains unknown how a scene is represented in the brain when perceived across the full visual field. Here, we developed a novel method for ultra-wide angle visual presentation and probed for signatures of immersive scene representation. To accomplish this, we bounced the projected image off angled-mirrors directly onto a custom-built curved screen, creating an unobstructed view of 175°. Scene images were created from custom-built virtual environments with a compatible wide field-of-view to avoid perceptual distortion. We found that immersive scene representation drives medial cortex with far-peripheral preferences, but surprisingly had little effect on classic scene regions. That is, scene regions showed relatively minimal modulation over dramatic changes of visual size. Further, we found that scene and face-selective regions maintain their content preferences even under conditions of central scotoma, when only the extreme far-peripheral visual field is stimulated. These results highlight that not all far-peripheral information is automatically integrated into the computations of scene regions, and that there are routes to high-level visual areas that do not require direct stimulation of the central visual field. Broadly, this work provides new clarifying evidence on content vs. peripheral preferences in scene representation, and opens new neuroimaging research avenues to understand immersive visual representation.

Keywords: cortical organization; functional MRI; peripheral vision; scene representation.


Conflict of interest statement

Declaration of Interests The authors declare no competing interests.

Figures

Figure 1:
Figure 1:
Full-field neuroimaging. (A) Physical setup. An image was bounced off two angled mirrors and directly projected onto a curved screen inside the scanner bore. (B) Image preparation. To account for the perceptual distortion on the tilted curved screen, we computationally warped an image in the opposite direction of distortion.
Figure 2:
Figure 2:
Extended eccentricity map. An example participant’s right occipital cortex is shown from a medial view. Each voxel is colored based on its preference for one of five eccentricity rings (right). In the group data, the black dotted line shows where a typical eccentricity map would end, and the black arrows show how much more cortex can be stimulated with the full-field neuroimaging. Individual brain maps from nine participants also show a consistent pattern of results.
Figure 3:
Figure 3:
Whole brain contrast maps. The group data is shown on an example subject brain. Zoom-in views at each row are captured around the classic scene regions. (A) Image content contrast. A large portion of high-level visual areas, including the scene regions, shows higher activation for the intact scenes compared to the phase-scrambled scenes. (B) Visual size contrast. A large swath of cortex near the parieto-occipital sulcus is strongly activated when viewing a full-field scene compared to a postcard scene.
Figure 4:
Figure 4:
ROI anlaysis. The anatomical locations of each ROI are illustrated on a schematic brain map in the middle (top: medial side, bottom: ventral surface of the right hemisphere). Each ROI panel shows the mean beta averaged across participants for each condition. Individual data are overlaid on top of the bars as dots. The main effect of visual size (blue vs. purple) and the main effect of content (dark vs. light) were significant in all ROIs. The significant interaction was found only in the PPA and RSC. The FFA result is in Supplement Fig.4.
Figure 5:
Figure 5:
Conditions and Stimuli (Experiment 3). To stimulate only the peripheral visual field, we removed the central portion of the image by creating a ”scotoma” that systematically varied in size. There were five levels of scotomas including the no-scotoma condition (columns). We filled in the remaining space with four different kinds of image content: intact scenes, phase-scrambled scenes, object array, and face arrays (rows). For the object and face arrays, the size of individual items was adjusted to account for cortical magnification. *For copyright reasons, human faces have been substituted with illustrations in this manuscript.
Figure 6:
Figure 6:
ROI anlaysis (Experiment 3). In each panel, the line plot shows how the response of each ROI changed as we increasingly removed the central visual field stimulation via scotoma, leaving only the peripheral stimulation. The call-out box with a bar plot shows responses for each image content at the largest scotoma condition (>138 deg diameter). Overall, PPA and RSC maintained their scene preference over faces across all scotoma conditions, whereas the OPA maintained the preference until the penultimate condition. The FFA also maintained its content preference for faces across all scotoma conditions.
Figure 7:
Figure 7:
Whole brain contrast maps (Experiment 3). This figure shows the whole-brain contrast between the scenes (red) and faces (blue), at each scotoma condition (columns). (A) Ventral view with PPA and FFA. (B) Medial view with RSC. (C) Lateral view with OPA.
Figure 8:
Figure 8:
ROI responses to eccentricity rings. (A) PPA response increases until the penultimate condition then drops at the extreme periphery. (B) RSC response was rather flat then jumped after the third ring, clearly showing its preference for the far-periphery. (C) OPA showed a mild peak around the third ring. (D) FFA showed the opposite pattern to A-C, demonstrating its preference for the central visual field.
Figure 9:
Figure 9:
Schematics showing the relationship between the retinotopic map and the scene regions. The scale and shape of retinotopic map is not accurately presented as the actual data. Instead, this flattened map of the medial view emphasizes the idea that the three scene regions might be connected via the far-peripheral cortex.

Similar articles

References

    1. Arcaro M. J., and Livingstone M. S. A hierarchical, retinotopic proto-organization of the primate visual system at birth. Elife 6 (2017), e26196. - PMC - PubMed
    1. Arnoldussen D. M., Goossens J., and van den Berg A. V. Adjacent visual representations of self-motion in different reference frames. Proceedings of the National Academy of Sciences 108, 28 (2011), 11668–11673. - PMC - PubMed
    1. Bainbridge W. A., and Baker C. I. Boundaries extend and contract in scene memory depending on image properties. Current Biology 30, 3 (2020), 537–543. - PMC - PubMed
    1. Baldassano C., Esteva A., Fei-Fei L., and Beck D. M. Two distinct scene-processing networks connecting vision and memory. Eneuro 3, 5 (2016). - PMC - PubMed
    1. Baldassano C., Fei-Fei L., and Beck D. M. Pinpointing the peripheral bias in neural scene-processing networks during natural viewing. Journal of Vision 16, 2 (2016), 9–9. - PubMed

Publication types