[Preprint]. 2023 May 18:rs.3.rs-2644953.
doi: 10.21203/rs.3.rs-2644953/v1.

Evolved bacterial siderophore-mediated antibiotic cross-protection

Affiliations

Evolved bacterial siderophore-mediated antibiotic cross-protection

Anna Clara M Galdino et al. Res Sq. .

Update in

Abstract

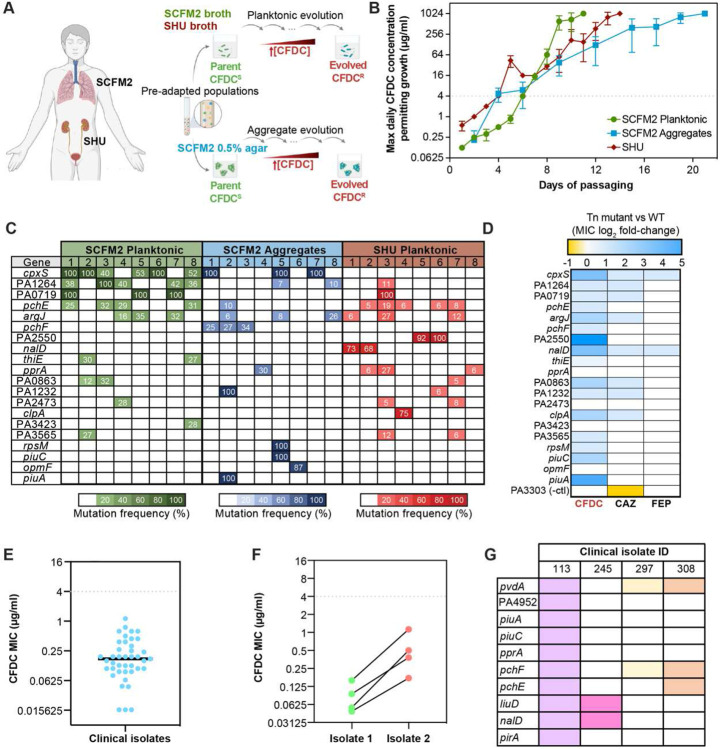
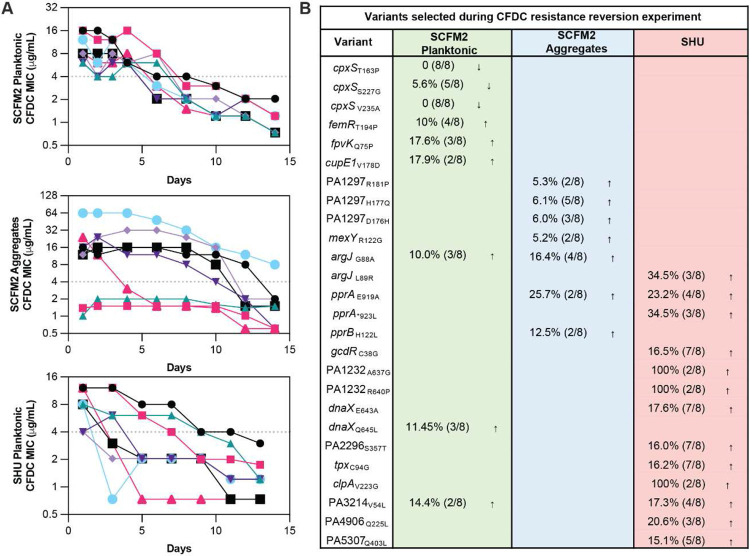
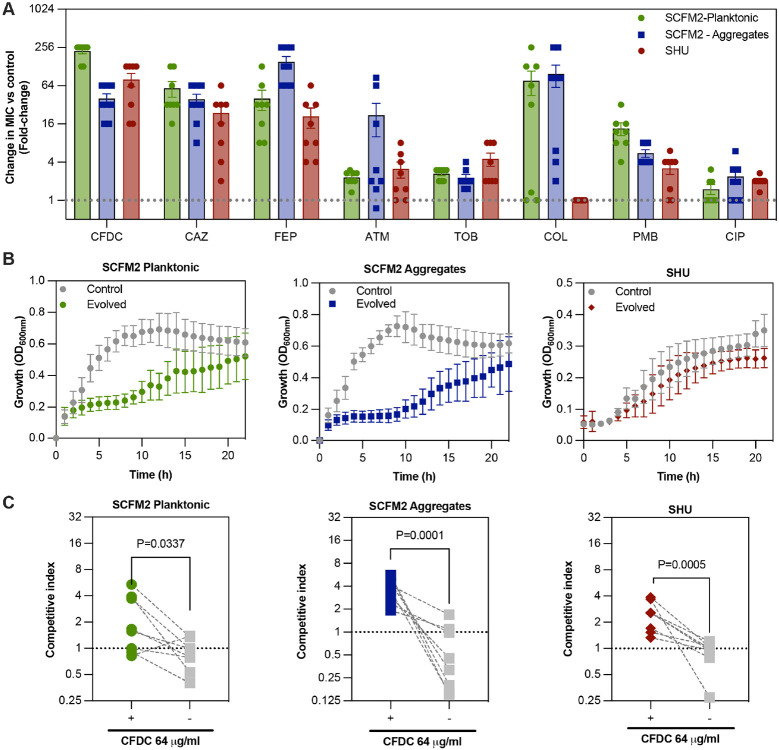
Antibiotic cross-protection enables resistant bacteria to protect other bacteria that would be otherwise susceptible to the drug. Cefiderocol is the first siderophore cephalosporin antibiotic approved for treating Gram-negative bacterial infections, including carbapenem-resistant Pseudomonas aeruginosa strains. While highly effective, CFDC resistance has been detected clinically, and mechanisms of resistance and cross-protection are not completely understood. In this study, we used experimental evolution and whole genome sequencing to identify cefiderocol resistance mechanisms and evaluated the trade-offs of evolving resistance. We found some cefiderocol-resistant populations evolved cross-protective social behavior, preventing cefiderocol killing of susceptible siblings. Notably, cross-protection was driven by increased secretion of bacterial iron-binding siderophores, which is unique from previously described antibiotic degradation mediated cross-protection. While concerning, we also showed that resistance can be selected against in drug-free environments. Deciphering the costs associated with antibiotic resistance might aid the development of evolution-informed therapeutic approaches to delay the evolution of antibiotic resistance.


Figures

Extended Data Figure 1 ∣
Extended Data Figure 1 ∣. Genetic diversity of populations evolved in the presence or absence of increasing concentrations of CFDC.
Shannon diversity indices were calculated from SNV frequencies in control and cefiderocol-evolved populations (mean; p-values, unpaired t-tests).
Extended Data Figure 2 ∣
Extended Data Figure 2 ∣. Ancestral populations are not able to grow in presence of cefiderocol.
Growth in the presence and absence of 64 μg/ml cefiderocol of populations was determined by monitoring fluorescence over time (h).
Extended Data Figure 3 ∣
Extended Data Figure 3 ∣. In vitro competition between ancestral and CFDC-resistant evolved planktonic populations.
Evolved and ancestral populations were tagged with eYFP and mApple fluorescent proteins, respectively. The fluorescent populations were competed (at 1:1 ratio) in the presence or absence of cefiderocol (64 μg/ml). Populations growth was determined by monitoring fluorescence over time (h). Experime were performed in triplicate, in three independent experimental sets (mean ± SD).
Extended Data Figure 4 ∣
Extended Data Figure 4 ∣. In vitro competition between ancestral and CFDC-resistant evolved aggregates populations.
Evolved and ancestral populations were tagged with eYFP and mApple fluorescent proteins, respectively. The fluorescent populations were competed (at 1:1 ratio) in the presence or absence of cefiderocol (64 μg/ml). Aggregate populations were visualized with a Zeiss LSM 780 confocal microscope.
Extended Data Figure 5 ∣
Extended Data Figure 5 ∣. The role of pyoverdine in benevolent cross-protection.
a, Pyoverdine production by PAO1 and cpxS variants (T163P, S227G and V235A) in SCFM2 with ½ × CFDC MIC measured after 20 h of incubation (mean ± SEM, ANOVA). b, Changes in CFDC susceptibility in the presence of pyoverdine (PVD) and pyochelin (PCH), the combinatorial effect is expressed by the log2 CFDC fractional inhibitory concentration (FIC). c, To measure the displacement of Fe(III) from CFDC, 100 μM of CFDC was pre-incubated with 100 μM of FeCl3 for 16h at room temperature. Next, 100 μM of free pyoverdine was added to ferric-CFDC and incubated for an additional hour. Iron(III) displacement was determined by pyoverdine fluorescence quenching.
Fig. 1 ∣
Fig. 1 ∣. Cefiderocol resistance variants detected through experimental evolution are also detected in P. aeruginosa clinical isolates.
a, Experimental design: P. aeruginosa PAO1 was propagated in SCFM2 or SHU for ten days prior to cefiderocol exposure. Pre-adapted populations were propagated daily in increasing cefiderocol concentrations planktonically in SHU or SCFM2 and as ABBA biofilm aggregates in SCFM2. When evolved population achieved growth at 1,024 μg/μl cefiderocol-evolved populations were harvested and sequenced to identify cefiderocol resistance mutations. As a control, 8 populations for each medium and lifestyle were propagated in antibiotic-free conditions. b, Cefiderocol resistance levels during experimental evolution. cefiderocol MICs were calculated using broth microdilution methods, (n=8, mean ± SEM). c, Heatmap showing mutations detected in populations which evolved to grow at 1,024 μg/μl cefiderocol in SCFM2 (planktonic and aggregates) and SHU. Variants detected in at least 25% of populations are listed. Each column represents one replicate population and color intensity indicates the maximum frequency of each gene variant detected in a given population. d, Heatmap showing antimicrobial susceptibilities of mutants carrying Tn insertions in candidate resistance genes identified via experimental evolution. Results indicate the average fold-change in MIC in the Tn-mutants compared to the PAO1 WT strain. cefiderocol, cefiderocol; CAZ, ceftazidime; FEP, cefepime. e, cefiderocol MICs of different clinical isolates recovered from patients with acute and chronic pneumonia that were never treated with cefiderocol (n=40). Each point represents the MIC from one clinical isolate. Dashed line indicates the MIC breakpoint for cefiderocol resistance. f, Increased cefiderocol MIC in paired sequential isolates. Even though no isolates were classified as cefiderocol resistant (MIC > 4 μg/ml) , we paired sequential clinical isolates recovered from the same patient which showed an increase in cefiderocol MIC. g, Heatmap indicating the presence of mutations in genes identified as being under selection during cefiderocol experimental evolution in clinical isolates with reduced cefiderocol susceptibility. Columns and colors represent each clinical isolate. Genomic DNA from clinical isolates were harvested, sequenced and chromosomal mutations were detected using Breseq.
Fig. 2 ∣
Fig. 2 ∣. Cefiderocol resistant populations readily revert to cefiderocol susceptible in cefiderocol-free conditions.
a, cefiderocol-resistant evolved populations (n=8) were continuously propagated for 14 days in cefiderocol-free SCFM2 or SHU. cefiderocol MICs were determined daily using cefiderocol gradient strips. The horizontal dashed line represents the cefiderocol susceptibility breakpoint (MIC < 4 μg/μl) defined by the FDA. b, Heatmaps indicate the genetic mutations the increased or decreased in prevalence after 15 days of propagating populations in cefiderocol-free media.
Fig. 3 ∣
Fig. 3 ∣. Fitness trade-offs evolved in cefiderocol-resistant populations.
a, Antimicrobial susceptibility testing of cefiderocol resistant populations compared with untreated control populations. The resistance profiles were analyzed by broth microdilution assays (n=3). Results indicate mean fold-change in MIC comparing control and evolved populations. b, Growth curves of evolved and untreated control populations in the absence of cefiderocol. Evolved populations were grown in SCFM2 or SHU in the absence of cefiderocol for 24h and growth was measured every 30 min by absorbance at 600 nm (n=3). Doubling times: SCFM2 planktonic evolved 268.42 ± 132.91 m vs control 56.16 ± 13.27 m, p=0.0129; SCFM2 aggregate evolved 394.80 ± 215.8 m vs control 47.39 ± 7.59 m, p=0.0026; paired t-test. doubling times: SHU evolved: 173.83 ± 89.74 m vs SHU control: 91.79 ± 30.16 m, p=0.2827; paired t-test. c, In vitro competition between ancestral and evolved populations. Evolved and ancestral populations were tagged with eYFP and mApple fluorescent proteins, respectively. The fluorescent populations were competed (at 1:1 ratio) in the presence or absence of cefiderocol. CI > 1 indicates that evolved populations outcompeted their ancestors. Experiments were performed in triplicate, in three independent experimental sets (mean ± SD). cefiderocol, cefiderocol; CAZ, ceftazidime; FEP, cefepime; ATM, aztreonam; TOB, tobramycin; COL, colistin; PMB, polymyxin B; CIP, ciprofloxacin.
Fig. 4 ∣
Fig. 4 ∣. Cross-protection evolved in cefiderocol-resistant populations.
a-d, As expected, the in vitro competition assay revealed that most evolved populations outcompeted ancestral populations during competition in SCFM2 under high cefiderocol pressure (64 μg/ml) both in planktonic (a) and in biofilm conditions (b). However, some cefiderocol-resistant evolved populations evolved benevolent social behavior allowing the ancestral cefiderocol-susceptible siblings to survive cefiderocol insult under well-mixed (c) and structured environments (d). Figures (b) and (b) show representative 3D confocal micrographs of non-protective and protective interactions between cefiderocol-resistant evolved populations (green – eYFP) and ancestral susceptible populations (red – mApple) in the presence of cefiderocol (64 μg/μl). To understand which traits drive the protective benevolent behavior, we compared the differential expression profiles associated with benevolent behavior observed during protective and non-protective competition under cefiderocol pressure (64 μg/ml). e, Heatmap showing differential expression in protective and non-protective populations. The gradient from blue to red indicates the relative degree of expression of DEGs (>1.5 log2 fold-change, FDR < 0.05). The outer circle labels represent the gene name or locus tag for each DEG. f, Volcano plot highlighting the differentially expressed genes identified using CLC genomics by comparing the average of protective and non-protective competitions. The red dots represent the DEGs (adjusted P-value < 0.05 with log2 fold-change > 1.5). g, cefiderocol MIC of PAO1 and cpxS variants (mean ± SEM, ANOVA). h, Planktonic competitions of PAO1 and cpxS variants (T163P, S227G, V235A) in SCFM2 with ½ × MIC. The growth of PAO1 was measured by mApple fluorescence area under the curve (AUC). i, Biofilm competition between PAO1 and cpxSS227G in SCFM2 in the absence and presence of 2 μg/ml cefiderocol.

References

    1. Amanatidou E. et al. Biofilms facilitate cheating and social exploitation of β-lactam resistance in Escherichia coli. npj Biofilms Microbiomes 5, 1–10 (2019). - PMC - PubMed
    1. Nadell C. D., Drescher K. & Foster K. R. Spatial structure, cooperation and competition in biofilms. Nat Rev Microbiol 14, 589–600 (2016). - PubMed
    1. Ito A. et al. Siderophore Cephalosporin Cefiderocol Utilizes Ferric Iron Transporter Systems for Antibacterial Activity against Pseudomonas aeruginosa. Antimicrob Agents Chemother 60, 7396–7401 (2016). - PMC - PubMed
    1. Pybus C. A., Felder-Scott C., Obuekwe V. & Greenberg D. E. Cefiderocol Retains Antibiofilm Activity in Multidrug-Resistant Gram-Negative Pathogens. Antimicrobial Agents and Chemotherapy 65, e01194–20 (2021). - PMC - PubMed
    1. Ito A. et al. In Vitro Antibacterial Properties of Cefiderocol, a Novel Siderophore Cephalosporin, against Gram-Negative Bacteria. Antimicrobial Agents and Chemotherapy 62, e01454–17 (2017). - PMC - PubMed

Publication types

LinkOut - more resources