[Preprint]. 2023 Nov 29:2023.05.17.23289772.
doi: 10.1101/2023.05.17.23289772.

Lipidomics for diagnosis and prognosis of pulmonary hypertension

Affiliations

Lipidomics for diagnosis and prognosis of pulmonary hypertension

Natalie Bordag et al. medRxiv. .

Update in

  • Lipid Ratios for Diagnosis and Prognosis of Pulmonary Hypertension.
    Bordag N, Nagy BM, Zügner E, Ludwig H, Foris V, Nagaraj C, Biasin V, Kovacs G, Kneidinger N, Bodenhofer U, Magnes C, Maron BA, Ulrich S, Lange TJ, Eichmann TO, Hoetzenecker K, Pieber T, Olschewski H, Olschewski A. Bordag N, et al. Am J Respir Crit Care Med. 2025 Jul;211(7):1264-1276. doi: 10.1164/rccm.202407-1345OC. Am J Respir Crit Care Med. 2025. PMID: 40343938 Free PMC article.

Abstract

Background: Pulmonary hypertension (PH) poses a significant health threat with high morbidity and mortality, necessitating improved diagnostic tools for enhanced management. Current biomarkers for PH lack functionality and comprehensive diagnostic and prognostic capabilities. Therefore, there is a critical need to develop biomarkers that address these gaps in PH diagnostics and prognosis.

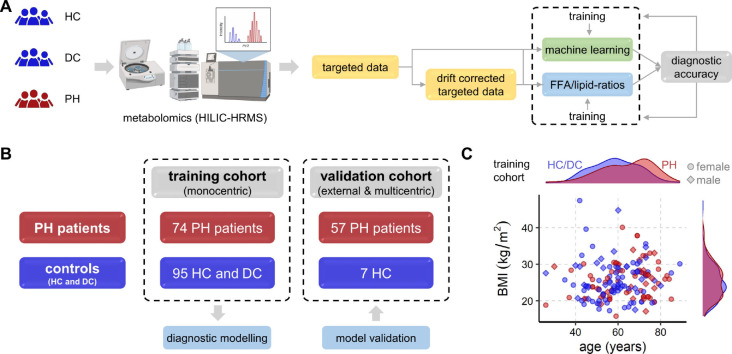
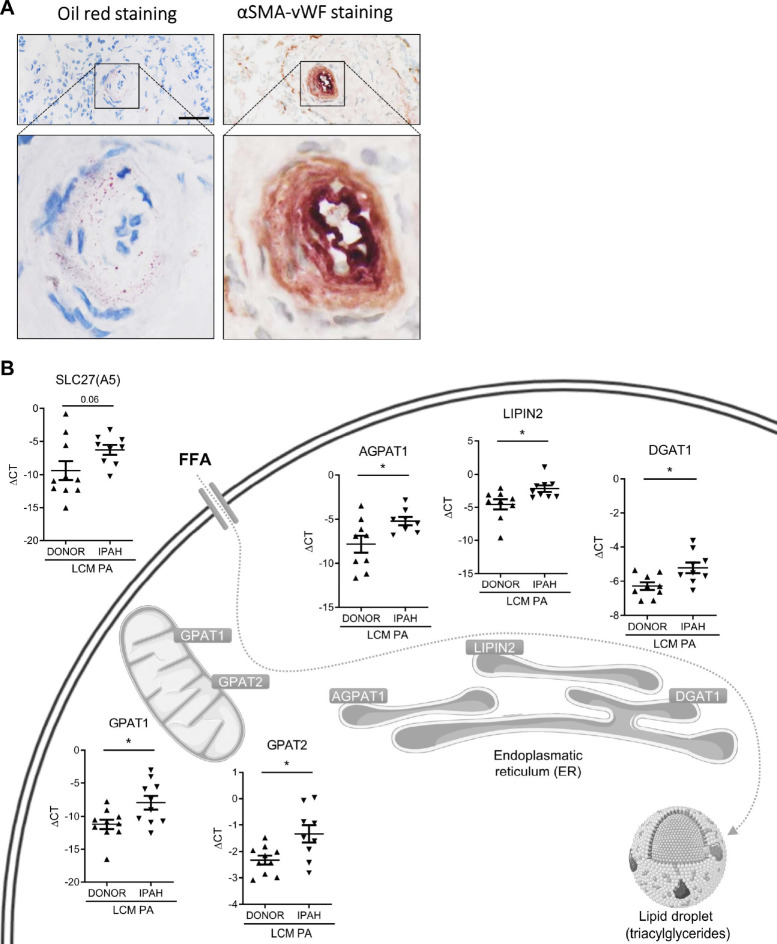
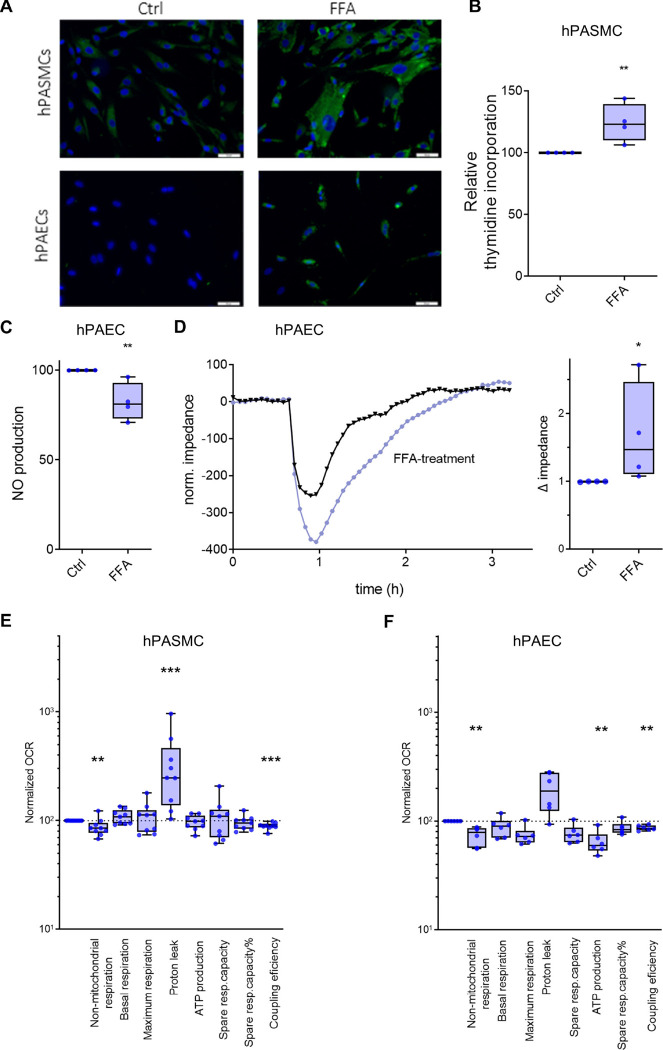
Methods: To address this need, we employed a comprehensive metabolomics analysis in 233 blood based samples coupled with machine learning analysis. For functional insights, human pulmonary arteries (PA) of idiopathic pulmonary arterial hypertension (PAH) lungs were investigated and the effect of extrinsic FFAs on human PA endothelial and smooth muscle cells was tested in vitro.

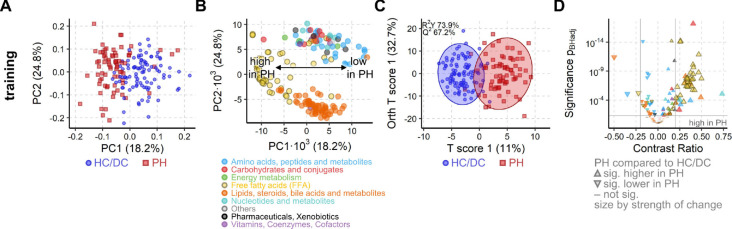
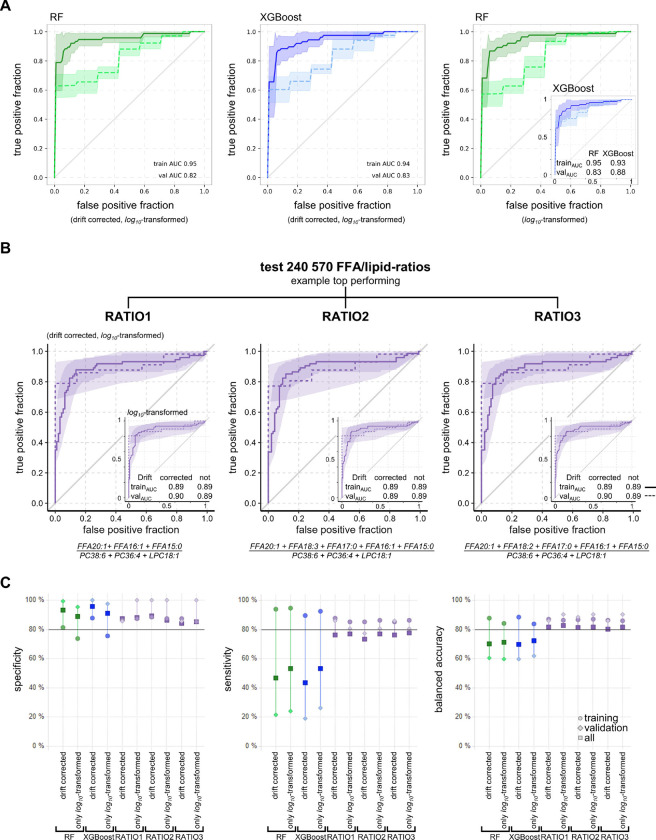
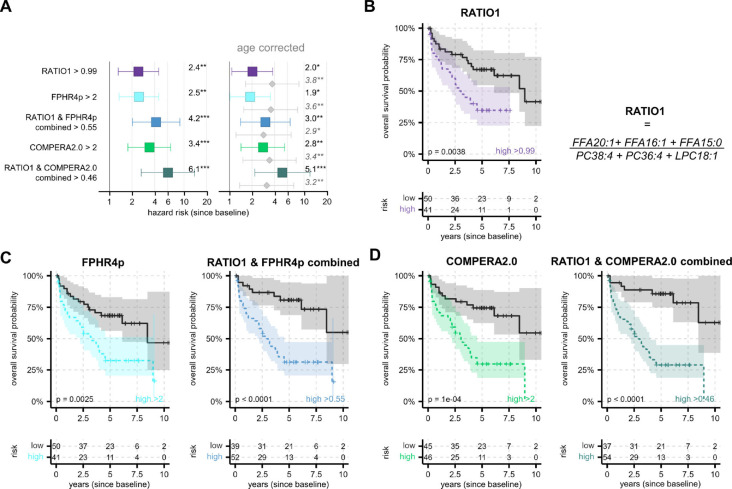
Results: PA of idiopathic PAH lungs showed lipid accumulation and altered expression of lipid homeostasis-related genes. In PA smooth muscle cells, extrinsic FFAs caused excessive proliferation and endothelial barrier dysfunction in PA endothelial cells, both hallmarks of PAH.In the training cohort of 74 PH patients, 30 disease controls without PH, and 65 healthy controls, diagnostic and prognostic markers were identified and subsequently validated in an independent cohort. Exploratory analysis showed a highly impacted metabolome in PH patients and machine learning confirmed a high diagnostic potential. Fully explainable specific free fatty acid (FFA)/lipid-ratios were derived, providing exceptional diagnostic accuracy with an area under the curve (AUC) of 0.89 in the training and 0.90 in the validation cohort, outperforming machine learning results. These ratios were also prognostic and complemented established clinical prognostic PAH scores (FPHR4p and COMPERA2.0), significantly increasing their hazard ratios (HR) from 2.5 and 3.4 to 4.2 and 6.1, respectively.

Conclusion: In conclusion, our research confirms the significance of lipidomic alterations in PH, introducing innovative diagnostic and prognostic biomarkers. These findings may have the potential to reshape PH management strategies.

Keywords: biomarker; blood-based test; fatty acid to lipid ratio; lipidomics; prognosis; pulmonary hypertension.


Conflict of interest statement

Competing interests Several authors (NB, CM, AO, BMN, HO) are inventors of the patent “Biomarker for the diagnosis of pulmonary hypertension (PH)” WO2017153472A1 (priority date 09.03.2016, granted in US, KR, JP, pending in CA, EP, AU) being jointly held by CBmed Gmbh, Joanneum Research Forschungsgesellschaft mbH, Medical University Graz and Ludwig Boltzmann Gesellschaft GmbH. The authors received no personal financial gain from the patent. During work on this publication NB was partially employed at CBmed GmbH. TP is chief scientific officer (CSO) of CBmed GmbH. EZ and CM were employed at Joanneum Research Forschungsgesellschaft mbH. The employing companies provided support in the form of salaries, materials and reagents but did not have any additional role in the study design, data collection and analysis, decision to publish, or preparation of the manuscript. VF received honoraria for lectures, presentations, speakers bureaus, manuscript writing, or educational events from Janssen, Chiesi, BMS, and Boehringer Ingelheim and support for attending meetings, and/or travel from Janssen, MSD, and Boehringer Ingelheim outside the submitted work. CN received support for attending meetings, and/or travel from Boehringer Ingelheim and Inventiva pharma outside the submitted work. BAM reports personal fees from Actelion Pharmaceuticals, Tenax and Regeneron, grants from Deerfield Company, NIH (5R01HL139613-03, R01HL163960, R01HL153502, R01HL155096-01), Boston Biomedical Innovation Center (BBIC), Brigham IGNITE award, Cardiovascular Medical research Education Foundation outside the submitted work. BAM reports patent PCT/US2019/059890 (pending), PCT/US2020/066886 (pending) and #9,605,047 (granted) not licensed and outside the submitted work. SU received grants from the Swiss National Science Foundation, Zürich and Swiss Lung League, EMDO-Foundation, Orpha-Swiss, Janssen and MSD all unrelated to the present work. SU received consultancy fees and travel support from Orpha-Swiss, Janssen, MSD and Novartis unrelated to the present work. TJL reports grants for his institution from Acceleron Pharma, Gossamer Bio, Janssen-Cilag, and United Therapeutics; personal fees and non-financial support from Acceleron Pharma, AstraZeneca, Boehringer Ingelheim, Gossamer Bio, Ferrer, Janssen-Cilag, MSD, Orphacare, and Pfizer outside the submitted work. KH is a consultant at Medtronic Österreich GmbH outside the submitted work. TP reports grants from AstraZeneca, Novo Nordisk, Sanofi paid to the Medical University of Graz outside the submitted work. TP reports personal fees and nonfinancial support from Novo Nordisk and Roche Diagnostics outside the submitted work. HO reports grants from Bayer, Unither, Actelion, Roche, Boehringer Ingelheim, and Pfizer. HO reports personal fees and non-financial support from Medupdate and Mondial, AOP, Astra Zeneca, Bayer, Boehringer Ingelheim, Chiesi, Ferrer, Menarini, MSD, and GSK, Iqvia, Janssen, Novartis, and Pfizer outside the submitted work. AO received honoraria for presentations and support for attending meetings, and/or travel from MSD outside the submitted work. No conflict of interest, financial or otherwise, are declared by the authors HL and UB.

Figures

Fig. 1.
Fig. 1.. Study overview for all cohorts.
(A) Schematic workflow of metabolomics measurement and computational analysis. Created with BioRender.com. (B) Schematic overview of group distribution of all included patients (n = 233) in training and validation cohorts. (C) Scatter plot of BMI vs. age (shape of symbols by sex) in the training cohort with distribution histograms per PH and per HC/DC showing comparable distributions of sex and BMI in PH and HC/DC, avoiding potential confounders by design.
Fig. 2.
Fig. 2.. PH is associated with a strong metabolic shift in the training cohort.
(A) iPCA scores plot representing the metabolic profile of each subject as a dot. The proximity of the dots indicates the similarity of the subjects’ metabolomes. Clear group separation by PH is visible along the first component. (B) Loadings plot corresponding to scores plot in (A). Each dot represents the contribution of the metabolite to the group separation observed in the scores plot. FFAs (yellow circles) strongly drive the group separation and are increased in PH patients. (C) OPLS-DA maximizes the group difference from PH to HC/DC and the resulting scores plot represents, as in A, the metabolome of each subject. Similarly, proximity indicates similarity and ellipses mark the 95% confidence interval of the groups. The difference between the metabolome of PH and HC/DC was significant (Q2 > 50%, p< 0.001 from 1000 random permutation). (D) Volcano plot of univariate analysis showing significant (pBH < 0.05, grey horizontal line) and strong (absolute contrast ratio > 0.25, grey vertical lines) increase in FFAs (yellow triangles). For all methods A-D, 164 known metabolites from the training cohort samples (n = 169) were used (drift corrected, log10-transformed data). Colors as in B.
Fig. 3.
Fig. 3.. Diagnostic accuracy for PH in training and validation cohorts.
(A) ROC plots of RF (green) and XGBoost (blue) trained with data from training cohort predicting class in validation cohort with either drift corrected, log10-transformed data (left, middle) or non-drift corrected log10-transformed data (right) based on 153 metabolites. (B) The ROC plots of the three best FFA/lipid-ratios for training and validation cohort with either drift corrected, log10-transformed data or log10-transformed data with no drift correction (insets). (A-B) Training cohort n = 169 (solid line), validation cohort n = 64 (dashed line), ribbons mark 95% confidence intervals. (C) Plot of model performance metrics sensitivity, specificity and balanced accuracy for RF, XGBoost, and the three best FFA/lipid-ratios when based on either training (circles) or validation (diamonds) cohorts only or all available data (squares). The performance of RF and XGBoost was comparable for all three metabolite subsets with and without drift correction. The performance of the three best FFA/lipid-ratios was consistently more stable and balanced than of RF or XGBoost.
Fig. 4.
Fig. 4.. RATIO1 predicts survival and improves prediction of established clinical scores.
(A) Cox HR analysis for survival from baseline without age as confounder (left side) and with age (right side, age HR shown in grey). Whiskers marks the 95% confidence intervals and statistical significance is coded as: * p < 0.05; ** p < 0.01; *** p < 0.001. Combining RATIO1 with FPHR4P or COMPERA2.0 increased HR compared with either alone. (B, C, D) Kaplan–Meier curves of survival from baseline by (B) RATIO1, (C) FPHR4p, and (D) COMPERA2.0 alone and combined with RATIO1. All cut-offs defining high or low were optimized with maxstat. RATIO1 was based on log10-transformed data without drift correction. RATIO1 was combined scaled 0 to 1 with equal weighing with either each score. FPHR4p was inverted so that higher scores represent higher risk as in COMPERA2.0.
Fig. 5.
Fig. 5.. Presence of lipids and expression of lipid-metabolism genes in IPAH pulmonary arteries.
(A) Visualization of endothelium (von-Willebrand factor, VWF) and smooth muscle cell layer (smooth muscle actin, SMA) together with oil red staining in human IPAH lung serial sections (scale bar: 50 μm). (B) Gene expression of lipid homeostasis-related enzymes in laser-capture microdissected human PA (n = 8–10 patients, respectively). Vertical lines represent means with standard error of mean (SEM). Asterisks mark Mann Whitney test p < 0.05. Cell organelles are adapted from Servier Medical Art (CC BY 2.0 DEED).
Fig. 6.
Fig. 6.. Effects of FFA treatment on hPASMC and hPAEC.
(A) Representative Bodipy fluorescence staining of hPASMC and hPAEC in the absence (Ctrl) or presence of extrinsic FFA (scale bar: 50 μm). (B) Platelet-derived growth factor (PDGF)-BB induced proliferation of primary hPASMC measured with thymidine incorporation, in the absence (Ctrl) or presence of extrinsic FFA (n = 4). Changes are expressed as percentages compared with untreated controls (Ctrl). (C) ACh-induced NO production in primary hPAEC (n = 4). Changes are expressed as percentage compared with untreated controls (Ctrl). (D) TEER, as determined by electrical cell-substrate impedance sensor (ECIS), showed a significant decrease in hPAEC treated with FFA, suggesting endothelial leakage. Representative original curve (left panel) and changes expressed as percent change compared with controls (Ctrl) (n = 4). (E, F) Summarized data from hPASMC and hPAEC using the Seahorse XFe24 Extracellular Flux Analyzer. All measurements were performed on n = 25,000–50,000 cells/well and five wells per cell type. Each experimental group consisted of cell lines from two to three patients. All data were normalized to total protein per well before analysis (n = 9). Mann Whitney test * < 0.05, **< 0.01, ***< 0.001. The boxes extend from the 25th to 75th percentile, the middle line denotes the median and the whiskers mark the minimum and maximum.

References

    1. Humbert M, Kovacs G, Hoeper MM, et al. 2022 ESC/ERS Guidelines for the diagnosis and treatment of pulmonary hypertension. Eur Respir J; 61. Epub ahead of print January 2023. DOI: 10.1183/13993003.00879-2022. - DOI - PubMed
    1. Hoeper MM, Humbert M, Souza R, et al. A global view of pulmonary hypertension. Lancet Respir Med 2016; 4: 306–322. - PubMed
    1. Vachiéry J-L, Tedford RJ, Rosenkranz S, et al. Pulmonary hypertension due to left heart disease. European Respiratory Journal 2019; 53: 1801897.
    1. Nathan SD, Barbera JA, Gaine SP, et al. Pulmonary hypertension in chronic lung disease and hypoxia. Eur Respir J; 53. Epub ahead of print 2019. DOI: 10.1183/13993003.01914-2018. - DOI - PMC - PubMed
    1. Maron BA, Brittain EL, Hess E, et al. Pulmonary vascular resistance and clinical outcomes in patients with pulmonary hypertension: a retrospective cohort study. Lancet Respir Med 2020; 8: 873–884. - PMC - PubMed

Online References

    1. Kovacs G, Avian A, Wutte N, et al. Changes in pulmonary exercise haemodynamics in scleroderma: a 4-year prospective study. Eur Respir J; 50. Epub ahead of print 2017. DOI: 10.1183/13993003.01708-2016. - DOI - PubMed
    1. Kovacs G, Avian A, Bachmaier G, et al. Severe Pulmonary Hypertension in COPD: Impact on Survival and Diagnostic Approach. Chest 2022; 162: 202–212. - PubMed
    1. Haudum CW, Kolesnik E, Colantonio C, et al. Cohort profile: ‘Biomarkers of Personalised Medicine’ (BioPersMed): a single-centre prospective observational cohort study in Graz/Austria to evaluate novel biomarkers in cardiovascular and metabolic diseases. BMJ Open 2022; 12: e058890. - PMC - PubMed
    1. Galiè N, Humbert M, Vachiery J-L, et al. 2015 ESC/ERS Guidelines for the diagnosis and treatment of pulmonary hypertension: The Joint Task Force for the Diagnosis and Treatment of Pulmonary Hypertension of the European Society of Cardiology (ESC) and the European Respiratory Society (ERS): Endorsed by: Association for European Paediatric and Congenital Cardiology (AEPC), International Society for Heart and Lung Transplantation (ISHLT). Eur Respir J 2015; 46: 903–75. - PubMed
    1. Hoffmann J, Wilhelm J, Marsh LM, et al. Distinct differences in gene expression patterns in pulmonary arteries of patients with chronic obstructive pulmonary disease and idiopathic pulmonary fibrosis with pulmonary hypertension. Am J Respir Crit Care Med 2014; 190: 98–111. - PubMed

Publication types

LinkOut - more resources