[Preprint]. 2023 May 17:2023.05.16.541066.
doi: 10.1101/2023.05.16.541066.

Infection-induced epilepsy is caused by increased expression of chondroitin sulfate proteoglycans in hippocampus and amygdala

Affiliations

Infection-induced epilepsy is caused by increased expression of chondroitin sulfate proteoglycans in hippocampus and amygdala

Dipan C Patel et al. bioRxiv. .

Update in

Abstract

Alterations in the extracellular matrix (ECM) are common in epilepsy, yet whether they are cause or consequence of disease is unknow. Using Theiler's virus infection model of acquired epilepsy we find de novo expression of chondroitin sulfate proteoglycans (CSPGs), a major ECM component, in dentate gyrus (DG) and amygdala exclusively in mice with seizures. Preventing synthesis of CSPGs specifically in DG and amygdala by deletion of major CSPG aggrecan reduced seizure burden. Patch-clamp recordings from dentate granule cells (DGCs) revealed enhanced intrinsic and synaptic excitability in seizing mice that was normalized by aggrecan deletion. In situ experiments suggest that DGCs hyperexcitability results from negatively charged CSPGs increasing stationary cations (K+, Ca2+) on the membrane thereby depolarizing neurons, increasing their intrinsic and synaptic excitability. We show similar changes in CSPGs in pilocarpine-induced epilepsy suggesting enhanced CSPGs in the DG and amygdala may be a common ictogenic factor and novel therapeutic potential.


Figures

Fig. 1 |
Fig. 1 |. Increased deposition of CSPGs in dentate gyrus (DG) and amygdala of TMEV-infected mice with acute seizures.
a Comparative images of the coronal brain hemislices obtained from mice treated with saline (Sham) or TMEV (TMEV S− : mice without acute seizures; TMEV S+ : mice with acute seizures) at 5 dpi and stained with the markers for CSPG (WFA, wisteria floribunda agglutinin, in green) and neuron (NeuN, in red). b Enlarged views of hippocampus show substantial increase in the level of CSPGs in the DG from the TMEV S+ group. A lack of CSPGs in the CA1 region is due to loss of CA1 pyramidal neurons common during acute TMEV-induced seizures. CSPG expression pattern and neuronal density in the TMEV S− group are comparable to the Sham group. GL, granular layer of DG; ML, molecular layer of DG. c Enlarged views of amygdala show substantial increase in the level of CSPGs in the TMEV S+ group. CSPG expression pattern in the TMEV S− group is comparable to the Sham group. CeA, central nucleus of amygdala; LA, lateral amygdala; BLA, basolateral amygdala. d-f Image analysis shows a significant increase in mean fluorescence intensity of WFA in the granular and molecular layers of DG (DG-GL (d) and DG-ML (e), respectively) and amygdala (f) from the TMEV S+ group compared to the Sham and the TMEV S− groups. Statistics: One-way ANOVA, Tukey’s multiple comparisons test; n=10–11 brain slices from 4–5 mice per group; **p<0.01, ****p<0.0001. Scale bar displayed in one image applies to all images in that panel.
Fig. 2 |
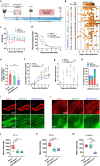
Fig. 2 |. Minocycline treatment significantly reduces TMEV-induced acute seizures and inhibits the changes in expression of CSPGs associated with TMEV-induced acute seizures in DG and amygdala.
a Experimental timeline. Mice were sacrificed at 7 dpi and the brains were either fixed for histology or were dissected into several regions and flash-frozen for biochemical analysis. b Heatmap shows handling-induced acute seizures observed based on their severity score for each mouse between 3–7 dpi. Mice were handled four times a day – during minocycline (MIN) or vehicle (Veh) injections twice daily and during seizure monitoring twice daily – with at least 2 hr of undisturbed period between each handling session. c Percentage of total infected mice in each group that remained seizure-free each day. None of the mice developed seizures before 3 dpi. d Average number of seizures per day between 3–7 dpi plotted for each mouse shows a significant reduction in seizure frequency by minocycline treatment (n=12, unpaired two-tailed t test, **p<0.01). e Average cumulative seizure burden, which is calculated as a mean of the summation of all seizure scores for each mouse up to each dpi, shows a significant reduction in seizure severity from 5 dpi by minocycline treatment (data shown as mean±SEM, n=12, two-way ANOVA, Šidák’s multiple comparisons test, ***p<0.01, ****p<0.0001). f Distribution of seizures based on seizure severity score. g Mean seizure score at each dpi shows significant reduction in TMEV-infected mice treated with minocycline (data shown as mean±SEM, n=12, two-way ANOVA, Šidák’s multiple comparisons test, *p<0.05). h Representative micrographs of the DG comparing the expression of CSPGs and neuronal density between mice infected intracortically with either TMEV (T) or Sham (S) and treated intraperitoneally with either minocycline (M) or vehicle (V). The brains slices were obtained at 7 dpi. i-j Image analysis shows that minocycline treatment significantly reduces an increased deposition of CSPGs (mean fluorescence intensity of WFA) in the granular and molecular layers of DG (DG-GL (b) and DG-ML (c), respectively) from TMEV-infected mice compared to the T+V group. The data from the S+V and S+M groups are combined as minocycline had no effect on the expression of CSPGs and neuronal density in mice infected with sham. k Representative micrographs of amygdala comparing the expression of CSPGs and neuronal density among four groups of mice. The brains slices were obtained at 7 dpi. l Similar to DG, minocycline treatment partially normalizes the expression of CSPGs in amygdala from TMEV-infected mice to the level in the sham group. Statistics (i-j, l): One-way ANOVA or Brown-Forsythe and Welch ANOVA, Tukey’s or Dunnett’s T3 multiple comparisons test; n=12–15 brain slices from 5–6 mice (T+V, T+M), n=8–9 brain slices from 2–3 mice (S+V, S+M); *p<0.05, ****p<0.0001. Scale bar displayed in one image applies to all images in that panel.
Fig. 3 |
Fig. 3 |. Deletion of aggrecan specifically in both DGCs and amygdala significantly reduces TMEV-induced acute seizures.
a Experimental timeline. Acanfl/flPOMC-cre− mice were injected in amygdala bilaterally with AAV9-hSyn-eGFP to get Acan+/+ mice (control), whereas Acanfl/flPOMC-cre+ mice were injected in amygdala bilaterally with AAV9-hSyn-eGFP or AAV9-hSyn-eGFP-Cre to get DG-Acan−/− and DG-AMG-Acan−/− mice, respectively. All mice were infected with TMEV 10–14 days after injections of AAV9 constructs. b Heatmap shows handling-induced acute seizures observed based on their severity score for each mouse between 3–8 dpi. Seizures were induced twice daily by handling the mice with at least 2 hr of undisturbed period between each handling session. c Average weight of mice each day during acute TMEV infection period is not different for all three groups of mice. d Percentage of total infected mice in each group that remained seizure-free each day. None of the mice developed seizures before 3 dpi. e Average number of seizures per day between 3–8 dpi plotted for each mouse shows a significant reduction in seizure frequency in DG-AMG-Acan−/− mice compared to Acan+/+ control mice (n=9–10, One-way ANOVA, Tukey’s multiple comparisons test, **p<0.01). f Average cumulative seizure burden, which is calculated as a mean of the summation of all seizure scores for each mouse up to each dpi, shows a significant reduction in seizure severity between 6–8 dpi in DG-AMG-Acan−/− mice compared to the other groups (data shown as mean±SEM, n=9–10, two-way ANOVA, Bonferroni’s multiple comparisons test; comparisons between DG-AMG-Acan−/− and Acan+/+ are denoted by *, whereas between DG-AMG-Acan−/− and DG-Acan−/− by #; **p<0.01, ****p<0.0001, #p<0.05, ###p<0.001). g Mean seizure score at each dpi shows significant reduction in DG-AMG-Acan−/− mice (data shown as mean±SEM, n=9–10, two-way ANOVA, Šidák’s multiple comparisons test, *p<0.05, **p<0.01, #p<0.05). h Distribution of seizures based on seizure severity score. i Representative micrographs show increased expression of CSPGs in DG at 10 dpi in Acan+/+ mice, but not in DG-Acan−/− and DG-AMG-Acan−/− mice, confirming cre recombinase-mediated deletion of acan gene in DGCs in DG-Acan−/− and DG-AMG-Acan−/− mice. j-k Image analysis shows significantly increased deposition of CSPGs (mean fluorescence intensity of WFA) in the granular and molecular layers of DG (DG-GL (b) and DG-ML (c), respectively) in Acan+/+ mice compared to DG-Acan−/− and DG-AMG-Acan−/− mice. l Representative micrographs of amygdala show increased expression of CSPGs at 10 dpi in Acan+/+ and DG-Acan−/− mice, but not in DG-AMG-Acan−/− mice, confirming cre recombinase-mediated deletion of acan gene in amygdala in DG-AMG-Acan−/− mice. m Mean fluorescence intensity of WFA in amygdala is significantly higher in Acan+/+ and DG-Acan−/− mice compared to DG-AMG-Acan−/− mice. Statistics (j-k, m): One-way ANOVA or Brown-Forsythe and Welch ANOVA, Tukey’s or Dunnett’s T3 multiple comparisons test; n=10–11 brain slices (single slice per mouse); ***p<0.001, ****p<0.0001. Scale bar displayed in one image applies to all images in that panel.
Fig. 4 |
Fig. 4 |. Increased intrinsic and synaptic excitability of DGCs during TMEV-induced acute seizures.
a Representative micrographs of hippocampus from acute brain slices (300 μm thick) used for patch-clamp recordings show an increased level of CSPGs, as stained with WFA (green), in DG and degradation of CSPG in the CA1 region due to neuronal loss from TMEV-infected mice with acute seizures. The scale bar applies to both the images. b Mean resting membrane potential of DGCs is significantly depolarized in the TMEV group (n=36–37 cells from 4–6 mice, unpaired two-tailed t test, ***p<0.001). c Mean input resistance of DGCs is significantly increased in the TMEV group (n=36–37 cells from 4–6 mice, unpaired two-tailed t test, ****p<0.0001). d Mean membrane capacitance of DGCs shows no difference between the sham and TMEV groups. e Representative traces of action potentials recorded from DGCs of sham- and TMEV-infected mice. f Number of action potentials induced by injecting currents of varying strength in DGCs are significantly higher in TMEV-infected mice (data shown as mean±SEM, n=36–37 cells from 4–6 mice, two-way ANOVA, Šidák’s multiple comparisons test; *p<0.05, **p<0.01, ***p<0.001, ****p<0.0001). g A significant increase in mean amplitude (upper left), but not mean frequency (lower left), of sEPSC recorded from DGCs of TMEV-infected mice. Cumulative distributions show a shift toward higher amplitude (upper right) and lower interevent interval (lower right), indicating a higher frequency, of sEPSC from TMEV-infected mice. h No change in mean amplitude (upper left) and frequency (lower left) of sIPSC from TMEV-infected mice. Cumulative distributions of amplitude (upper right) and interevent interval (lower right) of sIPSC from TMEV-infected mice are comparable to the control mice. i A significant increase in mean amplitude (upper left) and mean frequency (lower left) of mEPSC from TMEV-infected mice. Cumulative distributions show a shift toward higher amplitude (upper right) and lower interevent interval (lower right), indicating a higher frequency, of mEPSC from TMEV-infected mice. j A significant increase in mean amplitude (upper left) and mean frequency (lower left) of mIPSC from TMEV-infected mice. Cumulative distributions show a shift toward higher amplitude (upper right) and lower interevent interval (lower right), indicating a higher frequency, of mIPSC from TMEV-infected mice. Statistics (g-j): bar graphs – n=23–28 cells from 4–6 mice (spontaneous), n=17–25 cells from 4–6 mice (miniature), unpaired two-tailed t test or Welch’s t test; cumulative fractions – Kolmogorov-Smirnov test; **p<0.01, ***p<0.001, ****p<0.0001.
Fig. 5 |
Fig. 5 |. Resting membrane potential of DGCs from DG-AMG-Acan−/− mice is hyperpolarized but no change in action potential firing rate and threshold current compared to Acan+/+ mice during acute TMEV infection.
a Representative micrographs of hippocampus from acute brain slices (300 μm thick) used for patch-clamp recordings show a lack of increase in the level of CSPGs, as stained with WFA (green), in the DG from TMEV-infected DG-AMG-Acan−/− mice with acute seizures. The scale bar applies to both the images. b-c Mean input resistance (b) and mean membrane capacitance (c) of DGCs show no difference between Acan+/+ and DG-AMG-Acan−/− mice. d Mean resting membrane potential of the DGCs is significantly lower in DG-AMG-Acan−/− mice (n=26–28 cells from 4–6 mice, unpaired two-tailed t test, *p<0.05). e Representative traces of action potentials recorded from DGCs from Acan+/+ and DG-AMG-Acan−/− mice. f No difference in number of action potentials induced by injecting currents of varying strength in DGCs between Acan+/+ and DG-AMG-Acan−/− mice. g Representative traces of voltage recordings in response to stepwise current injections from 0 to 600 pA (2 pA per step) to identify minimum amount of current needed to generate action potentials consistently (AP threshold current). h No difference in the AP threshold current between Acan+/+ and DG-AMG-Acan−/− mice.
Fig. 6 |
Fig. 6 |. Decreased synaptic excitability of DGCs from DG-AMG-Acan−/− mice compared to Acan+/+ mice during acute TMEV infection period.
a No change in mean amplitude (upper left) and frequency (lower left) of sEPSC between Acan+/+ and DG-AMG-Acan−/− mice. Cumulative distributions show a shift toward lower amplitude (upper right) and higher interevent interval (lower right), indicating a lower frequency, of sEPSC from DG-AMG-Acan−/− mice. b A significant increase in mean amplitude (upper left), but not mean frequency (lower left), of sIPSC recorded from DGCs of TMEV-infected DG-AMG-Acan−/− mice. No difference in cumulative distributions of amplitude (upper right) and interevent interval (lower right) of sIPSC between both groups of mice. c A significant decrease in mean frequency (lower left), but not mean amplitude (upper left), of mEPSC from TMEV-infected DG-AMG-Acan−/− mice. Cumulative distributions similarly show a shift toward higher interevent interval (lower right), indicating a lower frequency, without any changes in amplitude (upper right) of mEPSC from DG-AMG-Acan−/− mice. d A significant decrease in mean frequency (lower left), but not mean amplitude (upper left), of mIPSC from TMEV-infected DG-AMG-Acan−/− mice. Cumulative distributions similarly show a shift toward higher interevent interval (lower right), indicating a lower frequency, without any changes in amplitude (upper right) of mIPSC from DG-AMG-Acan−/− mice. Statistics (a-d): bar graphs – n=17–22 cells from 4–6 mice (spontaneous), n=20–22 cells from 4–6 mice (miniature), unpaired two-tailed t test; cumulative fractions – Kolmogorov-Smirnov test; *p<0.05, ***p<0.001, ****p<0.0001.
Fig. 7 |
Fig. 7 |. Structural heterogeneity of perineuronal ECM differentially influences neuronal physiology.
a Left: Perineuronal ECM around inhibitory interneurons forms a condensed tightly woven lattice-like structure enwrapping soma as well as proximal dendrites. This arrangement of dense ECM in close proximity to the neuronal membrane retards ion diffusion and functions akin to dielectric material or myelin sheath and increases the charge separation between intracellular and extracellular compartments. As a result, it decreases membrane capacitance and allows interneurons to fire at higher frequency. Right: Perineuronal ECM around excitatory neurons is less compact and mostly present around soma. The lower density of ECM allows ionic diffusion and does not increase charge separation across the membrane, and therefore, does not affect the membrane capacitance. Instead, it acts akin to sponge attracting cations, such as K+, and raises their concentration in the extracellular compartment near the membrane. Increased [K+]o consequently causes hyperexcitability by depolarizing the resting membrane potential of excitatory neurons. b Examples of perineuronal ECM surrounding parvalbumin-containing (PV+) inhibitory interneurons from area CA1 and DG from TMEV/sham-injected mice showing a condensed PNN surrounding soma and proximal dendrites. c Examples of perineuronal ECM around excitatory neurons from the DG and amygdala from TMEV-infected mice. The structure of ECM is distinctly different than PNNs around PV+ interneurons. The images shown in panels b and c are maximum intensity projection of z-stack confocal images from the brain slices stained with markers for CSPG (WFA) and neurons (NeuN). Scale bar – 10 μm.

References

    1. Patel D. C., Tewari B. P., Chaunsali L. & Sontheimer H. Neuron-glia interactions in the pathophysiology of epilepsy. Nature reviews. Neuroscience 20, 282–297, doi:10.1038/s41583-019-0126-4 (2019). - DOI - PMC - PubMed
    1. Vezzani A., Balosso S. & Ravizza T. Neuroinflammatory pathways as treatment targets and biomarkers in epilepsy. Nature reviews. Neurology 15, 459–472, doi:10.1038/s41582-019-0217-x (2019). - DOI - PubMed
    1. Purnell B. S., Alves M. & Boison D. Astrocyte-neuron circuits in epilepsy. Neurobiology of disease 179, 106058, doi:10.1016/j.nbd.2023.106058 (2023). - DOI - PMC - PubMed
    1. Nicholson C. & Sykova E. Extracellular space structure revealed by diffusion analysis. Trends Neurosci 21, 207–215, doi:10.1016/s0166-2236(98)01261-2 (1998). - DOI - PubMed
    1. Lau L. W., Cua R., Keough M. B., Haylock-Jacobs S. & Yong V. W. Pathophysiology of the brain extracellular matrix: a new target for remyelination. Nature reviews. Neuroscience 14, 722–729, doi:10.1038/nrn3550 (2013). - DOI - PubMed

Publication types