[Preprint]. 2023 May 17:2023.05.16.540954.
doi: 10.1101/2023.05.16.540954.

Neuropeptide Y signaling regulates recurrent excitation in the auditory midbrain

Affiliations

Neuropeptide Y signaling regulates recurrent excitation in the auditory midbrain

Marina A Silveira et al. bioRxiv. .

Update in

Abstract

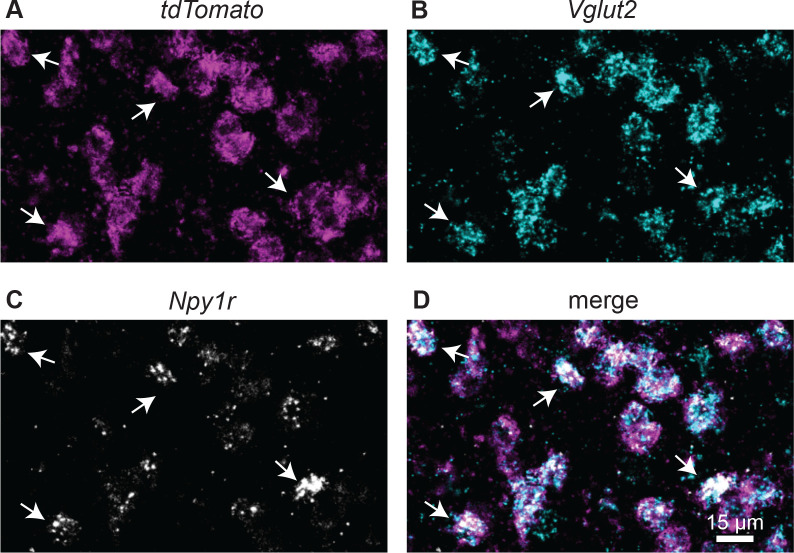
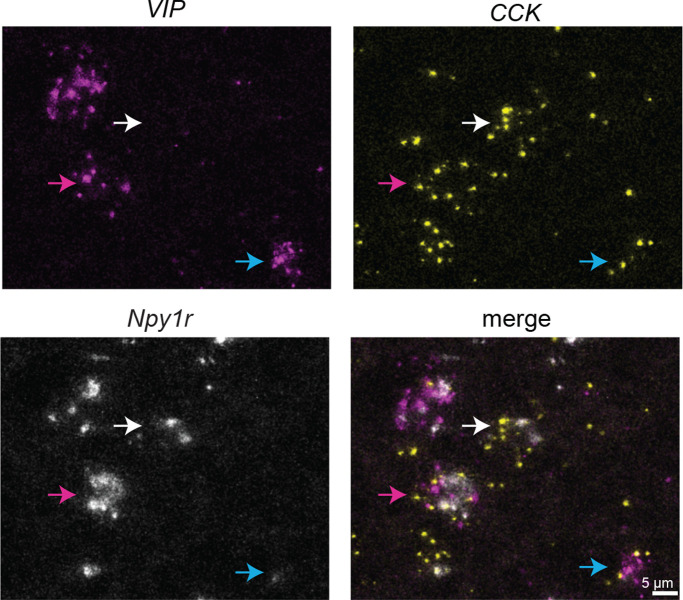
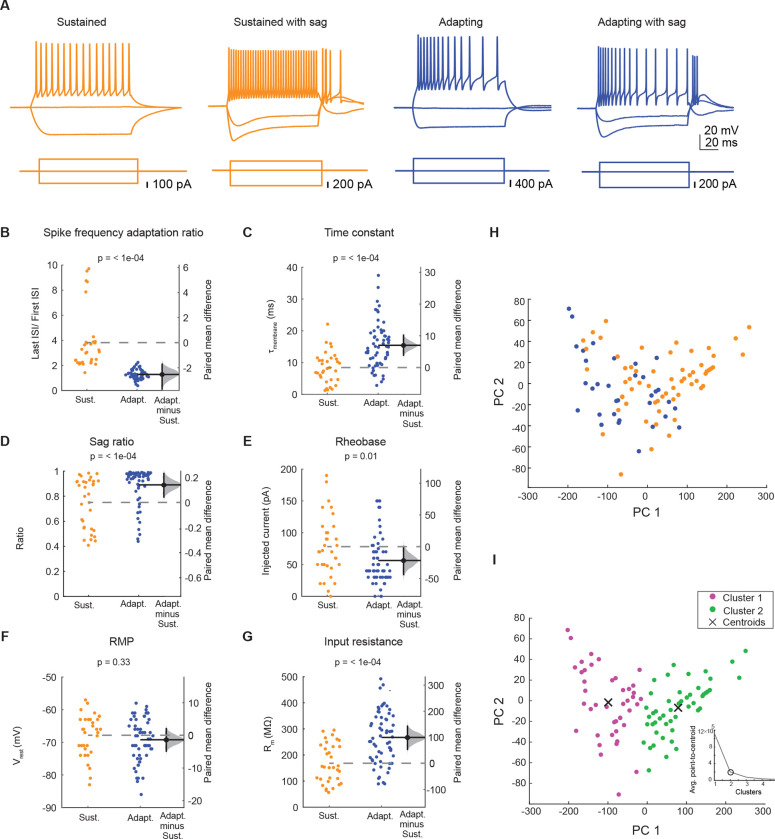
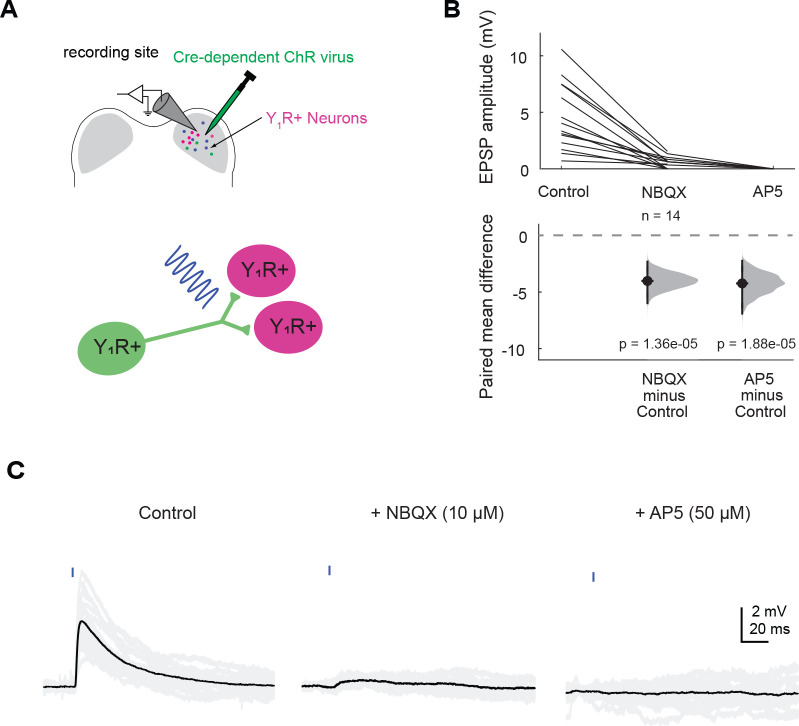
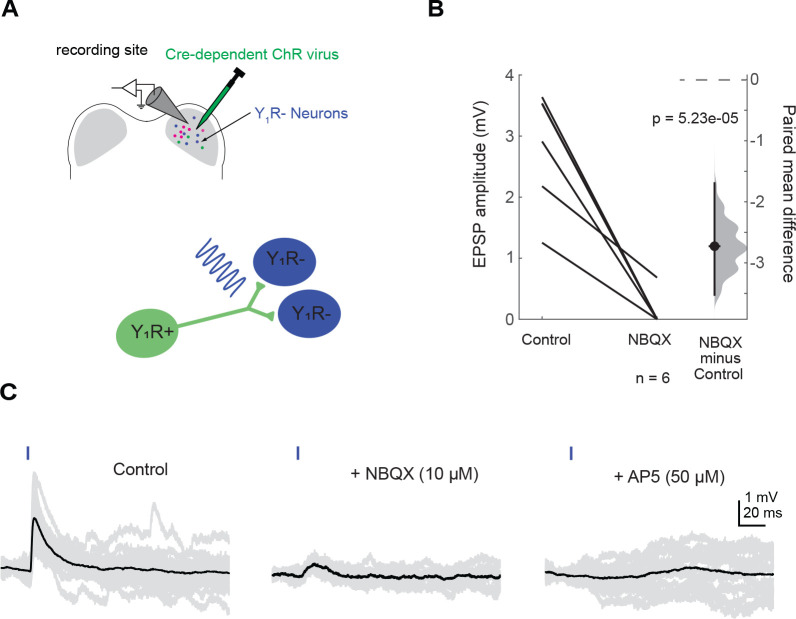
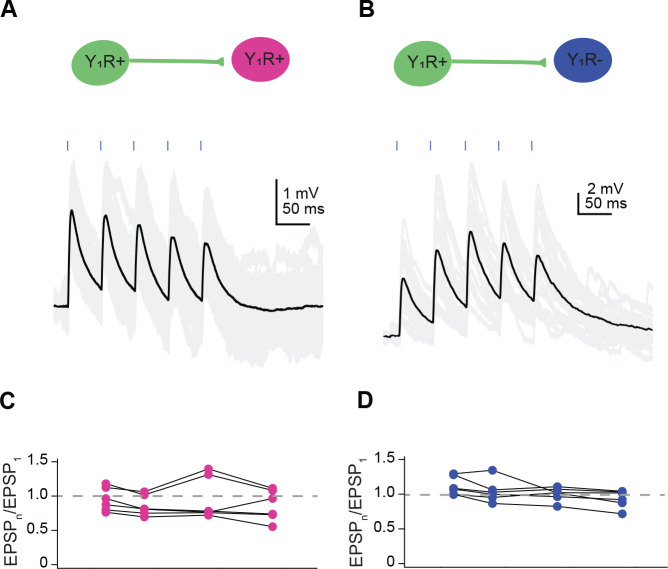
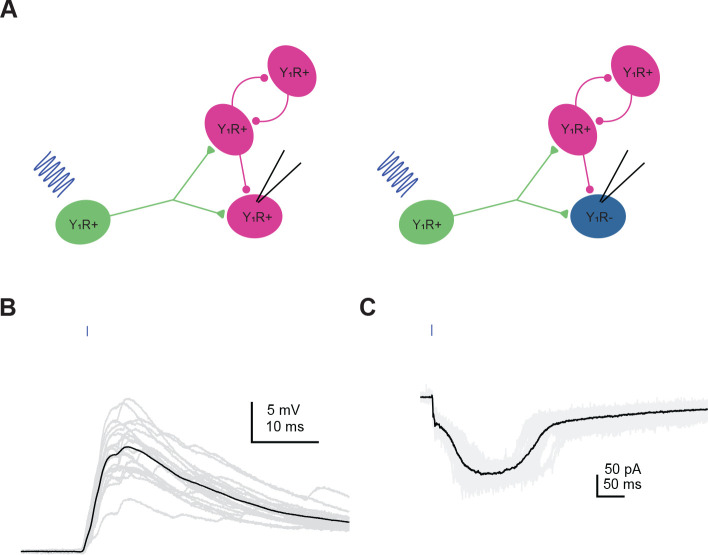
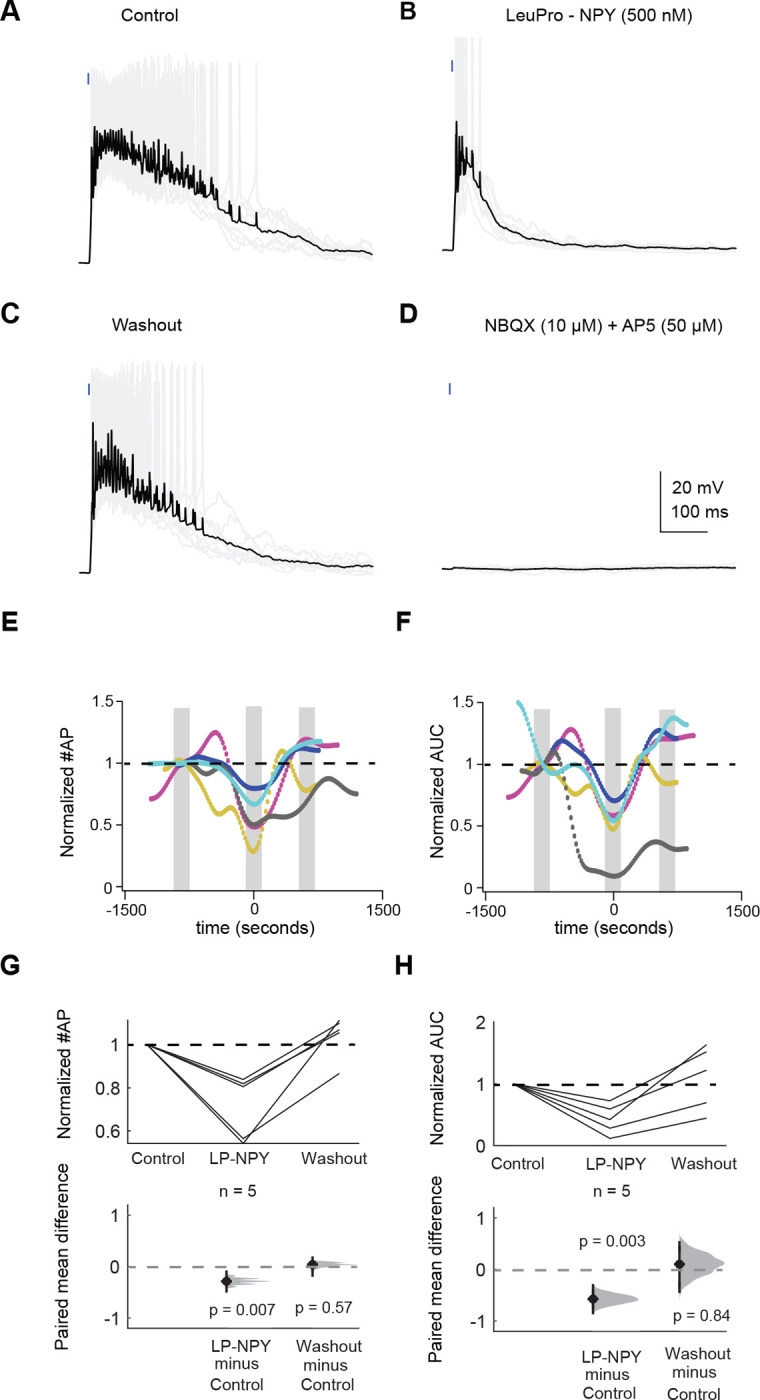
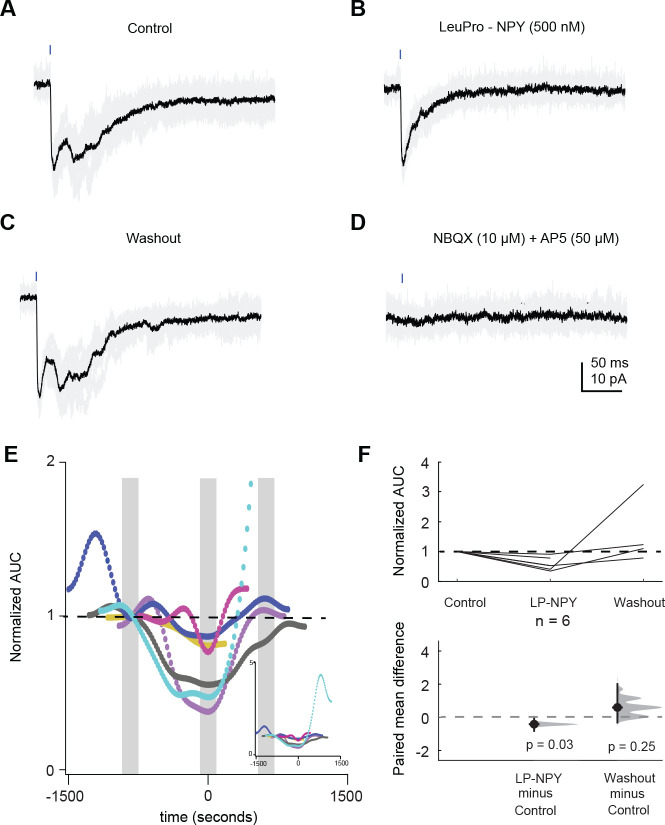
Neuropeptides play key roles in shaping the organization and function of neuronal circuits. In the inferior colliculus (IC), which is located in the auditory midbrain, Neuropeptide Y (NPY) is expressed by a large class of GABAergic neurons that project locally as well as outside the IC. The IC integrates information from numerous auditory nuclei making the IC an important hub for sound processing. Most neurons in the IC have local axon collaterals, however the organization and function of local circuits in the IC remains largely unknown. We previously found that neurons in the IC can express the NPY Y1 receptor (Y 1 R + ) and application of the Y 1 R agonist, [Leu 31 , Pro 34 ]-NPY (LP-NPY), decreases the excitability of Y 1 R + neurons. To investigate how Y 1 R + neurons and NPY signaling contribute to local IC networks, we used optogenetics to activate Y 1 R + neurons while recording from other neurons in the ipsilateral IC. Here, we show that 78.4% of glutamatergic neurons in the IC express the Y1 receptor, providing extensive opportunities for NPY signaling to regulate excitation in local IC circuits. Additionally, Y 1 R + neuron synapses exhibit modest short-term synaptic plasticity, suggesting that local excitatory circuits maintain their influence over computations during sustained stimuli. We further found that application of LP-NPY decreases recurrent excitation in the IC, suggesting that NPY signaling strongly regulates local circuit function in the auditory midbrain. Together, our data show that excitatory neurons are highly interconnected in the local IC and their influence over local circuits is tightly regulated by NPY signaling.


Conflict of interest statement

Conflict of Interest Statement: The authors declare no competing financial interests.

Figures

Figure 1.
Figure 1.
tdTomato+ neurons express Vglut2 and Npy1r mRNA. High magnification confocal images of a coronal IC section from a Y1R-Cre x Ai14 mouse showing that tdTomato+ neurons (A, magenta) co-label with Vglut2 (B, cyan) and Npy1r (C, white; merge in D). White arrows show examples of neurons that co-label. Scale bar applies to all images.
Figure 2.
Figure 2.
Y1R+ neurons can express VIP and/or CCK. High magnification confocal images of a coronal IC section showing VIP (magenta), CCK (yellow), and Npy1r (white) expression. Arrows indicate examples of cells that are VIP+CCK+Y1R (blue arrow); VIPCCK+Y1R+ (white arrows); and VIP+CCK+Y1R+ (magenta arrow). Scale bar applies to all images.
Figure 3.
Figure 3.
Y1R+ neurons exhibit sustained or adapting firing patterns. A. Y1R+ neurons exhibited different combinations of firing patterns and hyperpolarization-induced sag. Orange indicates neurons with a sustained firing pattern with or without voltage-dependent sag and blue indicates neurons with an adapting firing pattern with or without voltage-dependent sag. B – G. Sustained and adapting neurons exhibited heterogenous intrinsic physiological properties. B, Spike frequency adaptation ratio. C, Membrane time constant. D, Voltage-dependent sag ratio. E, Rheobase. F, Resting membrane potential. G, Input resistance. Dashed gray lines represent the level of zero difference in the mean difference plots. H. Principal components analysis showed that the distributions of adapting (blue) and sustained (orange) neurons overlapped. I. Separation of Y1R+ neurons into two clusters using k-means cluster analysis yielded clusters that did not match those predicted from sustained and adapting firing patterns (compare H and I). Magenta and green dots represent the two different clusters. 69.7% of adapting neurons fell into cluster 1 and 65.0 % of sustained neurons fell into cluster 2. The number of clusters used for analysis was defined using the elbow analysis, which showed that the addition of a third cluster did little to improve the separation between cluster centroids (insert graph).
Figure 4.
Figure 4.
Y1R+ neurons synapse onto other Y1R+ neurons. A. Cartoon representing the experimental setup. A Cre-dependent AAV was injected into one side of the IC to drive Chronos expression in Y1R+ neurons. After allowing 2 – 4 weeks for opsin expression, recordings were targeted to Y1R+ neurons in the transfected side of the IC. A brief pulse of blue light was used to activate Y1R+ terminals. B. Light pulses elicited EPSPs of varying amplitudes. These EPSPs were blocked by 10 μM NBQX in 10 out of 14 cells tested. The remaining EPSPs were abolished after application of 50 μM AP5. The dashed gray line indicates the level of zero difference in the paired mean difference plot. C. Example traces of optogenetically evoked EPSPs recorded from a Y1R+ neuron in the IC ipsilateral to the injection site. Black traces represent average responses and gray traces represent individual sweeps.
Figure 5.
Figure 5.
Y1R+ neurons synapse onto other Y1R neurons. A. Cartoon representing the experimental setup. A Cre-dependent AAV was injected into the right IC to drive Chronos expression in Y1R+ neurons. After allowing 2 – 4 weeks for virus expression, recordings were targeted to Y1R neurons in the transfected side of the IC. A brief pulse of blue light was used to activate Y1R+ terminals. B. Light pulses elicited EPSPs of varying amplitudes. Application of 10 μM NBQX abolished EPSPs in 5 out of 6 cells tested. In the sixth cell, the remaining EPSP was abolished with application of 50 μM AP5 (data not shown on graph). C. Example traces of optogenetically evoked EPSPs recorded from a Y1R neuron in the IC ipsilateral to the injection site. EPSPs are from the only Y1R neuron that exhibited an NMDA component in its response. Black traces represent average responses and gray traces represent individual sweeps.
Figure 6.
Figure 6.
Y1R+ synapses exhibit moderate short-term synaptic plasticity. A,B. Example traces from a Y1R+ neuron (A) and a Y1R neuron (B) showing EPSPs evoked by 20 Hz trains of light pulses. Black traces represent average responses and gray traces represent individual sweeps. C,D. Plots of the paired pulse ratios (PPR) for Y1R+ synapses onto Y1R+ neurons (C) and Y1R neurons (D) reveal little short-term plasticity. Each dot represents (average EPSPn)/(average EPSP1) for an individual cell. Dashed gray lines indicate PPR of one.
Figure 7.
Figure 7.
Activation of Y1R+ neurons elicits recurrent excitation in the IC. A. Cartoon showing experimental design. Viruses expressing Chronos or ChroME were used to transfect Y1R+ neurons. In the presence of inhibitory synaptic blockers (5 μM gabazine and 1 μM strychnine), optogenetic activation of Y1R+ neurons elicited prolonged periods of recurrent excitation. Recordings were targeted both to Y1R+ and Y1R neurons. B,C. Examples of recurrent excitation from a current-clamp recording (B) and a voltage clamp recording (C). Example trace in B is from a Y1R+ neuron and example trace in C is from a Y1R neuron.
Figure 8.
Figure 8.
Application of LP-NPY decreases action potentials elicited by recurrent excitation. A-D. In a recording from a Y1R+ neuron, activation of other Y1R+ neurons using a brief light pulse elicited recurrent excitation that resulted in action potentials (A). Bath application of the Y1R agonist, LP-NPY (500 nM), decreased recurrent excitation resulting in a decrease in action potential number (B). This effect was reversed during washout (C). Recurrent excitation was completely abolished by application of 10 μM NBQX and 50 μM D-AP5 (D). E. Graph shows normalized action potential number across the total duration of the recordings. Data were normalized to the most negative point during LP-NPY application. Grey bars indicate the data points that were analyzed for baseline, LP-NPY application and washout. Black dashed line represents the level of one. Each color represents one individual cell, and each dot represents a single trial. Trails were run at 20 second intervals. F. Graph showing normalized area under the curve across the recorded cells. Colors correspond to cells in E. Data were normalized to the most negative point during LP-NPY application. Grey bars represent the data points that were analyzed for baseline, LP-NPY application and washout. Black dashed line represents the level of one. G,H. Application of LP-NPY decreased the number of action potentials (G) and the area under the curve (H) observed in response to light pulses, indicating that LP-NPY inhibited recurrent excitation. Black dashed lines represent the level of one, and dashed gray lines represent the level of zero difference for the paired mean difference plots.
Figure 9.
Figure 9.
Application of LP-NPY decreases recurrent excitatory current. A-D. Activation of Y1R+ neurons by a brief light pulse elicited recurrent excitatory currents in an example recording from a Y1R+ neuron (A). Bath application of LP-NPY (500 nM) decreased recurrent excitation (B). This effect was reversed during washout (C). The recurrent excitatory current was abolished by 10 μM NBQX and 50 μM D-AP5 (D). E. Graph showing normalized area under the curve across 6 cells. Each dot represents one trial, with trial responses collected at 20 second intervals. Data were normalized to the most negative point during LP-NPY application. Grey bars indicate the data points that were analyzed for baseline, LP-NPY application and washout. Black dashed line represents the level of one. Each color represents one individual. The graph was truncated along the y-axis to better show the changes observed, removing some of the later responses for the cell in cyan, which ran-up during the washout period. The insert graph shows the full y-axis. E. Graph of normalized data showing that application LP-NPY (500 nM) decreased the area under the curve. Black dashed line represents the level of one, and the dashed gray line represents the level of zero difference for the paired mean difference plot.

Similar articles

References

    1. Adams JC (1979) Ascending projections to the inferior colliculus. J Comp Neurol 183:519–538. - PubMed
    1. Anair JD, Silveira MA, Mirjalili P, Beebe NL, Schofield BR, Roberts MT (2022) Inhibitory NPY Neurons Provide a Large and Heterotopic Commissural Projection in the Inferior Colliculus. Front Neural Circuits 16:871924. - PMC - PubMed
    1. Bacci A, Huguenard JR, Prince DA (2002) Differential modulation of synaptic transmission by neuropeptide Y in rat neocortical neurons. Proc Natl Acad Sci 99:17125–17130. - PMC - PubMed
    1. Barri A, Wiechert MT, Jazayeri M, DiGregorio DA (2022) Synaptic basis of a sub-second representation of time in a neural circuit model. Nat Commun 13:7902. - PMC - PubMed
    1. Bates, Mächler M, Bolker B, Waker S (2015) Fitting Linear Mixed-Effects Models Using lme4. J Stat Soft 67:1–48.

Publication types