[Preprint]. 2023 May 26:2023.05.26.542397.
doi: 10.1101/2023.05.26.542397.

Viral modulation of type II interferon increases T cell adhesion and virus spread

Affiliations

Viral modulation of type II interferon increases T cell adhesion and virus spread

Carina Jürgens et al. bioRxiv. .

Update in

  • Viral modulation of type II interferon increases T cell adhesion and virus spread.
    Jacobsen C, Plückebaum N, Ssebyatika G, Beyer S, Mendes-Monteiro L, Wang J, Kropp KA, González-Motos V, Steinbrück L, Ritter B, Rodríguez-González C, Böning H, Nikolouli E, Kinchington PR, Lachmann N, Depledge DP, Krey T, Viejo-Borbolla A. Jacobsen C, et al. Nat Commun. 2024 Jun 22;15(1):5318. doi: 10.1038/s41467-024-49657-4. Nat Commun. 2024. PMID: 38909022 Free PMC article.

Abstract

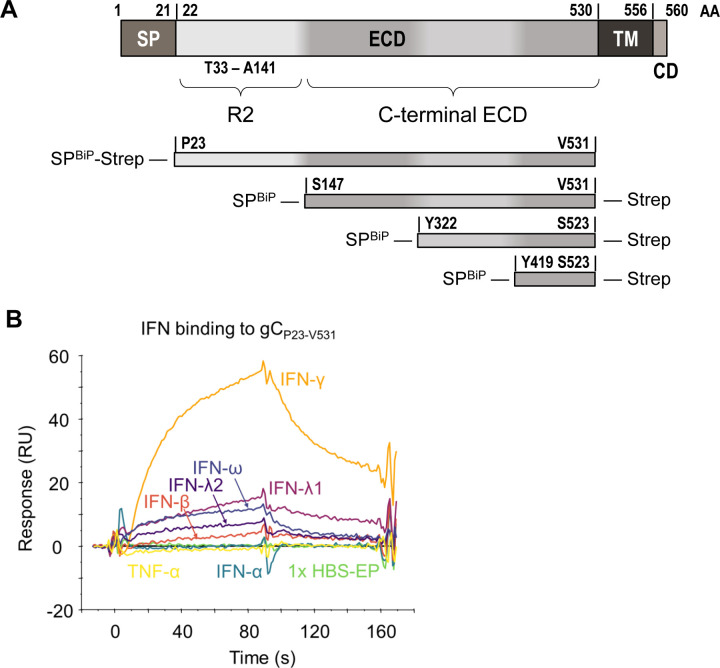
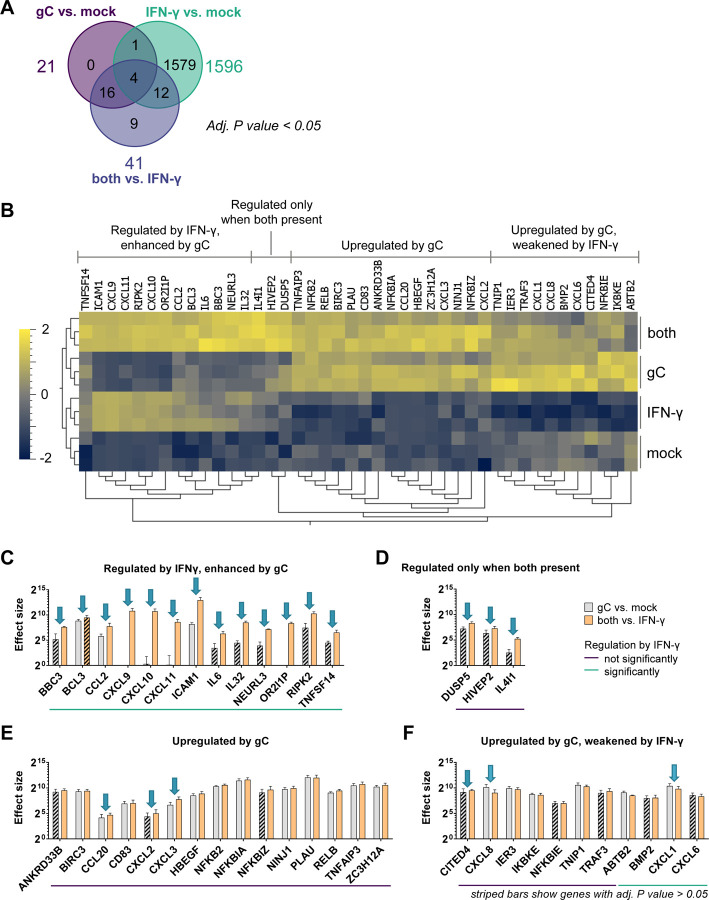
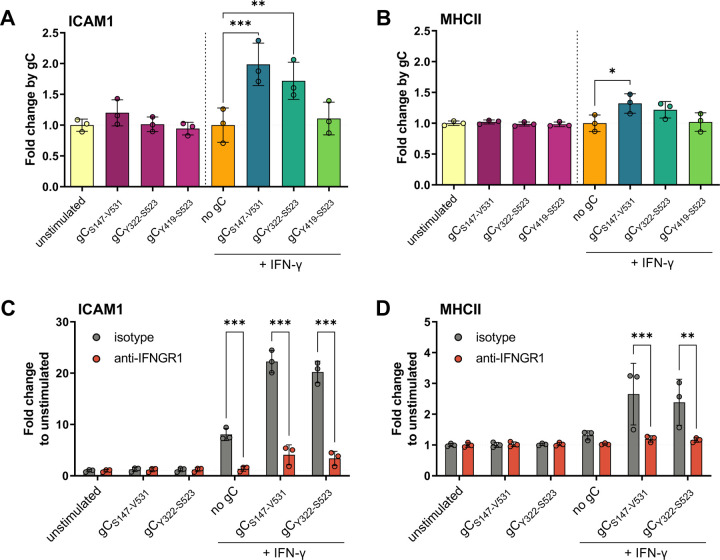
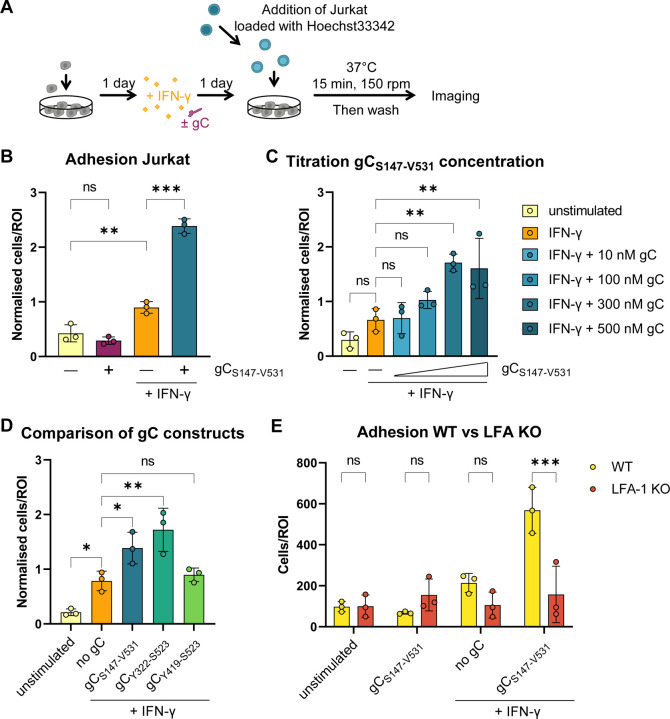
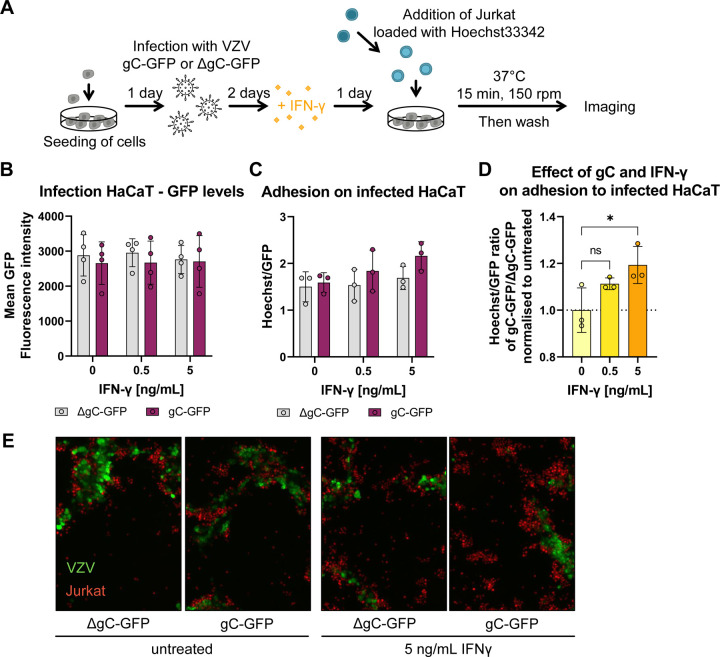
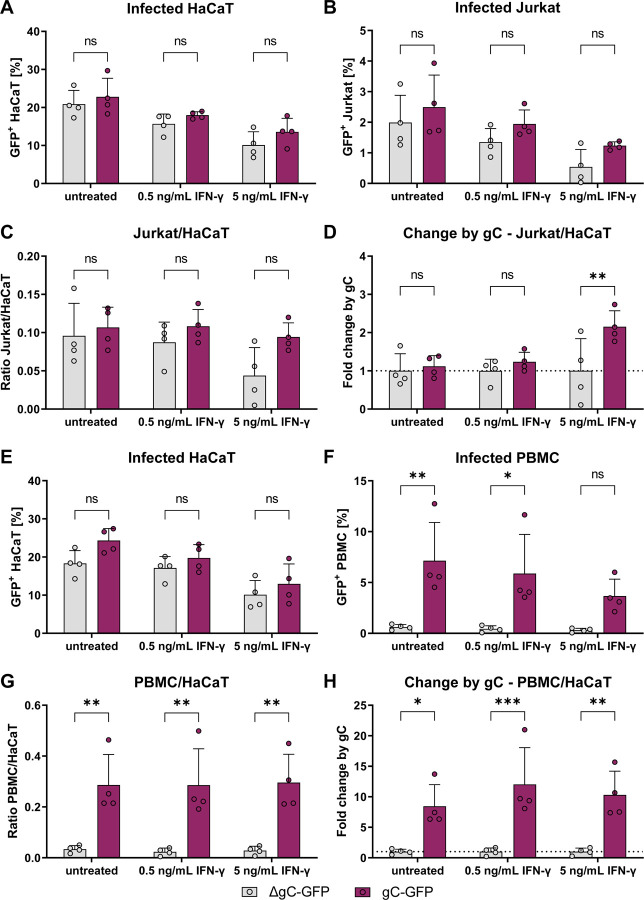
During primary infection, varicella zoster virus (VZV) infects epithelial cells in the respiratory lymphoid organs and mucosa. Subsequent infection of lymphocytes, T cells in particular, causes primary viremia allowing systemic spread throughout the host, including the skin. This results in the expression of cytokines, including interferons (IFNs) which partly limit primary infection. VZV also spreads from skin keratinocytes to lymphocytes prior to secondary viremia. How VZV infects lymphocytes from epithelial cells while evading the cytokine response has not been fully established. Here, we show that VZV glycoprotein C (gC) binds IFN-γ and modifies its activity. Transcriptomic analysis revealed that gC in combination with IFN-γ increased the expression of a small subset of IFN-stimulated genes (ISGs), including intercellular adhesion molecule 1 (ICAM1), as well as several chemokines and immunomodulatory genes. The higher ICAM1 protein level at the plasma membrane of epithelial cells resulted in lymphocyte function-associated antigen 1 (LFA-1)-dependent T cell adhesion. This gC activity required a stable interaction with IFN-γ and signalling through the IFN-γ receptor. Finally, the presence of gC during infection increased VZV spread from epithelial cells to peripheral blood mononuclear cells. This constitutes the discovery of a novel strategy to modulate the activity of IFN-γ, inducing the expression of a subset of ISGs, leading to enhanced T cell adhesion and virus spread.

Keywords: ICAM1; Interferon gamma; LFA-1; T cell adhesion; biased signaling; immunomodulation; varicella zoster virus; virus spread.


Figures

Figure 1.
Figure 1.. VZV gC binds type II IFN.
(A) Schematic representation of VZV gC (top) and recombinant soluble gC constructs that were used in this study (below). All constructs contain a BiP signal peptide at the N-terminus and a Twin-Strep-tag. The first and last gC residue is indicated in each construct. The numbering of amino acid residues corresponds to the sequence of the Dumas strain. Abbreviations: AA = amino acid, SP = signal peptide, ECD = extracellular domain, TM = transmembrane domain, CD = cytoplasmic domain, R2 = repeated domain 2, IgD = immunoglobulin-like domain, BiP = Drosophila immunoglobulin binding chaperone protein signal sequence, Strep = Twin-Strep-tag with enterokinase site for optional removal of tag. (B) Sensorgram showing the results of a binding screening between VZV gC and cytokines using the Biacore X100 system. Recombinant purified VZV gCP23-V531 was immobilized on a CM5 chip (3,600 RU). IFNs and TNFα were injected at 100 nM with a flow rate of 10 μL/min. Abbreviations: s = seconds, RU = resonance units.
Figure 2.
Figure 2.. VZV gC induces biased IFN-γ-induced gene expression.
HaCaT cells were stimulated with IFN-γ, gCS147-V531, both or mock treated for 4 h. RNA was isolated and further processed for RNAseq. (A) Venn diagram showing the number of genes, whose expression was modified in a statistically significant manner (P value < 0.05) for the three depicted comparisons. Differential gene expression analysis was performed comparing the different treatment conditions. (B) Normalized counts of genes with an adjusted (adj.) P value < 0.05 for either the comparison ‘gC vs. mock’ or ‘both vs. IFN-γ’ were plotted as heatmap after calculating the log2 and normalising (mean = 0, variance = 1) using Qlucore Omics Explorer 3.8. Hierarchical clustering was applied to sort for genes with a similar behaviour among the treatment conditions. Genes were classified in four different groups based on their expression change upon stimulation with IFN-γ, gC or both. (C-F) Genes with an adj. P value < 0.05 for either the comparison ‘gC vs. mock’ or ‘both vs. IFN-γ’ were sorted into the four groups identified in the heatmap and the effect sizes were calculated and plotted. Arrows indicate genes that show more than a 1.5-fold change in their effect sizes between both comparisons. The coloured lines below the graphs indicate which genes were significantly regulated by IFN-γ alone. Striped bars indicate that the respective effect size was calculated from a not statistically significant regulated gene in that specific comparison. Panel (C) shows the genes regulated by IFN-γ and enhanced by gC. Panel (D) shows genes that were regulated when both were present. Panel (E) depicts genes mainly upregulated by gC alone and panel (F) includes genes that were upregulated by gC and weakened by IFN-γ.
Figure 3.
Figure 3.. gC enhances IFN-γ-induced ICAM1 and MHCII protein levels at the plasma membrane via IFNGR.
(A, B) HaCaT cells were mock-stimulated or stimulated with 5 ng/mL IFN-γ, 300 nM VZV gC constructs or both for 24 h and then labelled with antibodies binding ICAM1, MHCII, and stained with Zombie-NIR dye. Cells were analysed by flow cytometry and median fluorescence intensities were determined after gating on single alive cells. Bar charts show the fold-change of ICAM1 (A) or MHCII (B) surface protein levels induced by gC constructs to either unstimulated or IFN-γ baseline. (C, D) HaCaT cells were pre-treated with 2 μg/mL IFNGR1-neutralizing antibody or isotype control for 2 h followed by mock-stimulation or stimulation with 5 ng/mL IFN-γ, 300 nM gC or both in the presence of neutralizing antibody or isotype control for 24 h and labelled with antibodies detecting ICAM1, MHCII, and stained with Zombie-NIR dye. Cells were analysed by flow cytometry and median fluorescence intensities were determined after gating on alive single cells. Bar charts showing the fold change of ICAM1 (C) or MHCII (D) levels compared to unstimulated cells. One-way ANOVA, followed by Šídák’s multiple comparisons was performed (comparing condition with gC to baseline without gC (A, B) and comparing between isotype and neutralizing antibody (C, D)). Non-significant comparisons are not depicted. * = P <0.033; ** = P <0.002; *** = P <0.001.
Figure 4.
Figure 4.. Co-stimulation of HaCaT cells with IFN-γ and gC increases adhesion of Jurkat cells.
(A) Schematic representation of the assay. HaCaT cells were seeded one day prior to mock-stimulation or stimulation with IFN-γ, gC or both. 24 h after stimulation, Hoechst-labelled Jurkat cells were added and allowed to adhere during 15 min at 37 °C with shaking at 150 rpm. Then, non-adhered cells were washed off and two randomly selected regions of interest (ROI) were imaged per well (triplicate per condition) using an automated microscope (Cytation3, BioTek). The nuclei from adhered cells were quantified using a CellProfiler pipeline. (B-D) Adhered Jurkat cells per ROI plotted in a bar chart after normalization to the overall mean of adhered cells from each assay. Depicted are the comparisons between the four treatment conditions (B), the titration of the gC concentration (C), and the comparison of the different gC constructs (D). If not stated otherwise, 5 ng/mL IFN-γ and 300 nM gC were used. Shown is the mean ± SD. Filled circles represent the values from each independent assay (n=3). Ordinary one-way ANOVA followed by Šídák’s multiple comparisons test (B, to test for preselected pairs) or followed by Dunnett’s multiple comparisons test (C and D, to test each against a control = IFN-γ) were performed. (E) Adhesion assay comparing wild type (WT) Jurkat cells to LFA-1 KO Jurkat cells. Adhered cells per ROI are plotted in a bar chart. Shown is the mean ± SD. Filled circles represent the mean values from each independent assay (n=3, performed in triplicates with 2 ROI per well). Two-way ANOVA followed by Šídák’s multiple comparisons test (to test between the two cell types) was performed. ns = not significant; * = P <0.033; ** = P <0.002; *** = P <0.001.
Figure 5.
Figure 5.. Jurkat cells adhere better to cells infected with VZV-gC-GFP virus than with VZV-ΔgC-GFP.
(A) Schematic representation of the assay. HaCaT cells were seeded 24 h prior to infection with VZV pOka expressing GFP fused to gC (gC-GFP) or expressing GFP instead of gC (ΔgC-GFP). 48 h after infection, the cells were stimulated with IFN-γ or mock-treated. The next day, Hoechst-labelled Jurkat cells were added and allowed to adhere during 15 min at 37 °C on a shaking platform at 150 rpm. Then, non-adhered cells were washed off and two randomly selected regions of interest (ROI) were imaged per well (triplicate per condition) using an automated microscope (Cytation3, BioTek) and the mean Hoechst and GFP intensities were determined. (B-D) Each circle corresponds to one experiment. Shown are the mean ± SD of the independent experiments. (B) Graph showing mean GFP fluorescence intensity obtained from HaCaT cells infected with VZV-gC-GFP or VZV-ΔgC-GFP and incubated or not with IFN-γ. (C) Bar chart showing the amount of adhered Jurkat cells normalised to the amount of infected HaCaT cells (Hoechst/GFP ratio) in the presence or absence of IFN-γ. (D) Graph showing the Hoechst/GFP ratio from HaCaT cells infected with VZV-gC-GFP divided by that of HaCaT cells infected with VZV-ΔgC-GFP and normalised to the mock-treated condition. Ordinary one-way ANOVA followed by Dunnett’s multiple comparisons test (to test each against a control = no IFN-γ). ns = not significant; * = P <0.033; ** = P <0.002; *** = P <0.001. (E) Representative fluorescence microscopy images of Jurkat and HaCaT cells in the four experimental conditions. The GFP signal corresponding to productive infection is depicted in green, whereas the adhered Hoechst positive cells are shown in red.
Figure 6.
Figure 6.. VZV-gC-GFP spreads more efficiently from HaCaT cells to lymphocytes than VZV-ΔgC-GFP.
Quantification of infected HaCaT, Jurkat cells and PBMCs by flow cytometry. Magenta indicates cultures infected with VZV-gC-GFP, grey indicates VZV-ΔgC-GFP infected cultures. (A, B) Percentages of GFP+ HaCaT cells (A) and GFP+ Jurkat cells (B) after co-culture are plotted as bar charts. (C) Ratio of GFP+ Jurkat cells to GFP+ HaCaT cells is plotted as bar chart. (D) The fold change attributed to the presence of gC is plotted as bar chart. (E, F) Percentages of GFP+ HaCaT cells (E) and GFP+ PBMCs (F) after co-culture are plotted as bar charts. (G) Ratio of GFP+ PBMCs to GFP+ HaCaT cells is plotted as bar chart. (H) The fold change attributed to the presence of gC is plotted as bar chart. Two-way ANOVA followed by Šídák’s multiple comparisons test (to test between the two viruses) was performed. ns = not significant; * = P <0.033; ** = P <0.002; *** = P <0.001.

References

    1. Ku CC, Padilla JA, Grose C, Butcher EC, Arvin AM. Tropism of varicella-zoster virus for human tonsillar CD4(+) T lymphocytes that express activation, memory, and skin homing markers. Journal of virology 76, 11425–11433 (2002). - PMC - PubMed
    1. Moffat JF, Stein MD, Kaneshima H, Arvin AM. Tropism of varicella-zoster virus for human CD4+ and CD8+ T lymphocytes and epidermal cells in SCID-hu mice. Journal of virology 69, 5236–5242 (1995). - PMC - PubMed
    1. Abendroth A, Morrow G, Cunningham AL, Slobedman B. Varicella-zoster virus infection of human dendritic cells and transmission to T cells: implications for virus dissemination in the host. Journal of virology 75, 6183–6192 (2001). - PMC - PubMed
    1. Sen N, et al. Single-cell mass cytometry analysis of human tonsil T cell remodeling by varicella zoster virus. Cell reports 8, 633–645 (2014). - PMC - PubMed
    1. Ku CC, Zerboni L, Ito H, Graham BS, Wallace M, Arvin AM. Varicella-zoster virus transfer to skin by T Cells and modulation of viral replication by epidermal cell interferon-alpha. The Journal of experimental medicine 200, 917–925 (2004). - PMC - PubMed

Publication types