[Preprint]. 2023 May 23:2023.05.16.23290059.
doi: 10.1101/2023.05.16.23290059.

Distinct T cell functional profiles in SARS-CoV-2 seropositive and seronegative children associated with endemic human coronavirus cross-reactivity

Affiliations

Distinct T cell functional profiles in SARS-CoV-2 seropositive and seronegative children associated with endemic human coronavirus cross-reactivity

Ntombi S B Benede et al. medRxiv. .

Update in

Abstract

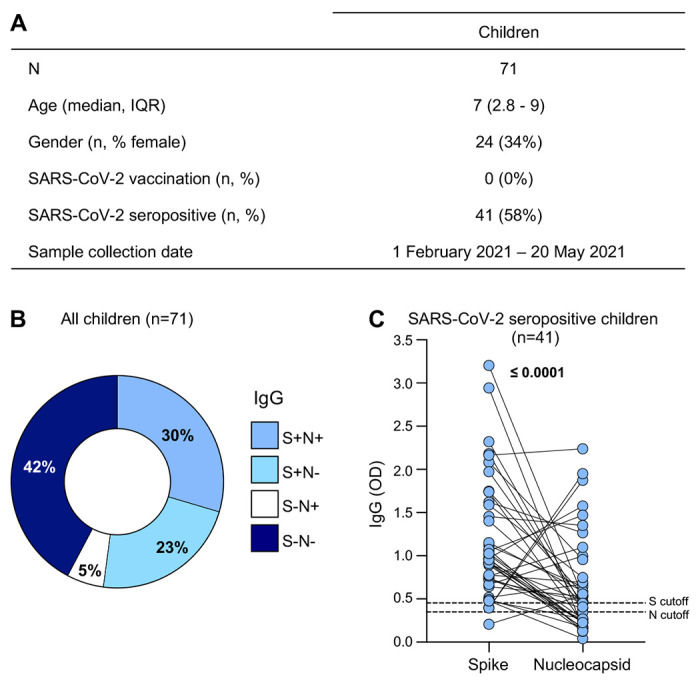
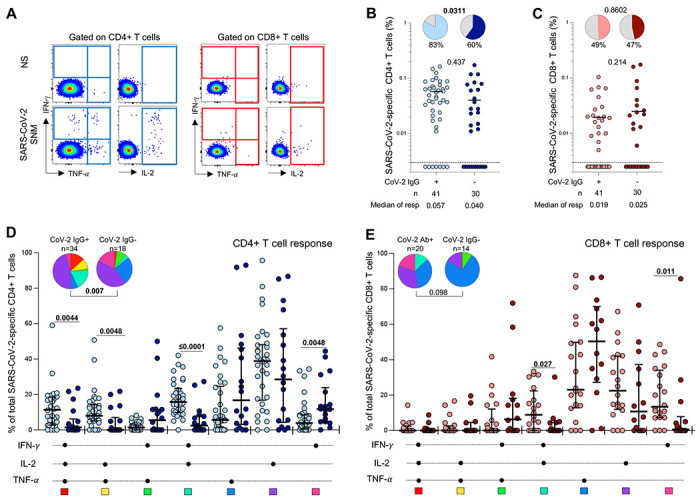
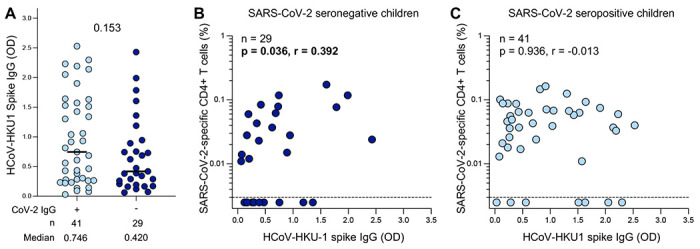
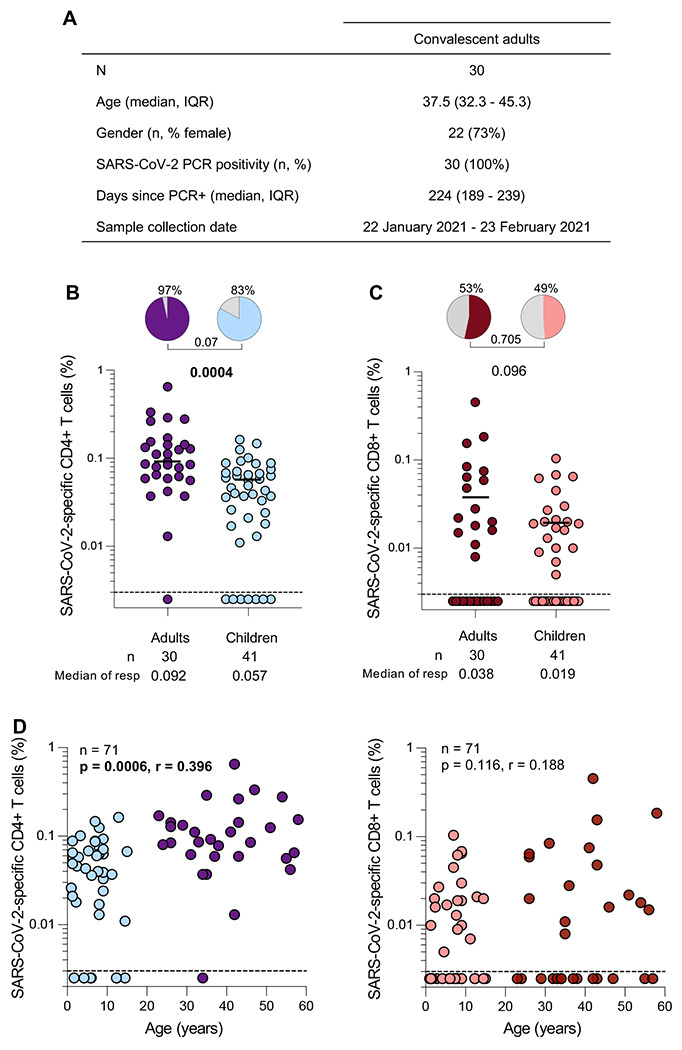
SARS-CoV-2 infection in children typically results in asymptomatic or mild disease. There is a paucity of studies on antiviral immunity in African children. We investigated SARS-CoV-2-specific T cell responses in 71 unvaccinated asymptomatic South African children who were seropositive or seronegative for SARS-CoV-2. SARS-CoV-2-specific CD4+ T cell responses were detectable in 83% of seropositive and 60% of seronegative children. Although the magnitude of the CD4+ T cell response did not differ significantly between the two groups, their functional profiles were distinct, with SARS-CoV-2 seropositive children exhibiting a higher proportion of polyfunctional T cells compared to their seronegative counterparts. The frequency of SARS-CoV-2-specific CD4+ T cells in seronegative children was associated with the endemic human coronavirus (HCoV) HKU1 IgG response. Overall, the presence of SARS-CoV-2-responding T cells in seronegative children may result from cross-reactivity to endemic coronaviruses and could contribute to the relative protection from disease observed in SARS-CoV-2-infected children.

Keywords: Children; IgG responses; Polyfunctional profile; SARS-CoV-2; T cell response; endemic HCoV.


Conflict of interest statement

DECLARATION OF INTERESTS The authors have no competing interests.

Figures

Figure 1:
Figure 1:. SARS-CoV-2-specific antibody responses in children
(A) The demographic characteristics of 71 unvaccinated children included in this study. Age, gender, SARS-CoV-2 vaccination status, SARS-CoV-2 serology and collection date are shown. (B) Proportion of children exhibiting antibody responses to SARS-CoV-2 spike (S) and nucleocapsid (N) proteins. (C) The magnitude of SARS-CoV-2 S and N IgG antibodies (OD490nm) measured by ELISA in seropositive children (n=41). The dotted lines indicate the cut-off for positivity which was calculated as the mean optical density of COVID-19 prepandemic control samples. Statistical analysis was performed using the Wilcoxon signed rank test; p values <0.05 were considered statistically significant and are bolded.
Figure 2:
Figure 2:. SARS-CoV-2-specific T cell responses in children
(A) Representative flow cytometry plots of SARS-CoV-2-specific interferon-γ (IFN-γ), tumor necrosis factor-α (TNF-α) and interleukin-2 (IL-2) cytokine production from CD4+ (left) and CD8+ (right) T cells in response to SARS-CoV-2 peptide stimulation. NS: no stimulation, SNM: combined peptide pool of SARS-CoV-2-spike, nucleocapsid and membrane proteins. (B) Frequency of SARS-CoV-2-specific CD4+ T cells producing any of the measured cytokines (IFN-γ, IL-2 or TNF-α). Children were grouped according to SARS-CoV-2 serostatus (light blue: n=41 SARS-CoV-2 seropositive; dark blue: n=30 SARS-CoV-2 seronegative). Bars represent the median of the responders, and median values are indicated. The pie charts represent the proportion of responders with detectable T cell response to SARS-CoV-2 SNM peptides. (C) Frequency of SARS-CoV-2-specific CD8+ T cells producing any of the measured cytokines (IFN-γ, IL-2 or TNF-α). Children were grouped according to SARS-CoV-2 serostatus (light red: n=41 SARS-CoV-2 seropositive children; dark red: n=30 SARS-CoV-2 seronegative children). Statistical comparisons in (B) and (C) were performed using the Mann-Whitney test between seropositive and seronegative children and the Chi-square test to compare the percentage of responders; p values <0.05 were considered statistically significant and are bolded. (D) Polyfunctional profile of SARS-CoV-2-specific CD4+ and (E) CD8+ T cells in seropositive and seronegative unvaccinated children. The x-axis illustrates each combination which is indicated with a black circle for the presence of IFN-γ, IL-2 and TNF-α. The medians and interquartile range are shown. Each response pattern (any possible combination of IFN-γ, IL-2 and TNF-α production) is color coded and summarized in the pie charts, with each pie slice representing the median contribution of each combination to the total SARS-CoV-2 responses. The permutation test was used to compare the statistical differences between the pie charts and the Mann Whitney Sum Test to compare response patterns between seropositive and seronegative children; p values <0.05 were considered statistically significant and are bolded.
Figure 3:
Figure 3:. SARS-CoV-2 cross-reactivity to endemic beta-HCoV in children
(A) The magnitude of HCoV-HKU-1 spike IgG levels were measured by ELISA in SARS-CoV-2 seropositive (light blue; n=41) and seronegative (dark blue; n=29) children. Plasma sample was insufficient for one seronegative child therefore OD for HCoV-HKU1 was not measured for this participant. The bars represent the median values. A statistical comparison was performed using the Mann-Whitney test between seropositive and seronegative children; a p value <0.05 was considered statistically significant. (B) Correlation between the frequency of SARS-CoV-2-specific CD4+ T cells and HCoV-HKU-1-spike IgG levels in SARS-CoV-2 seronegative children (n=29). One participant had insufficient sample available to be included in this assay. (C) Correlation between the frequency of SARS-CoV-2-specific CD4+ T cells and HCoV-HKU-1-spike IgG levels in SARS-CoV-2 seropositive children (n=41). Statistical comparisons for (B) and (C) were performed using a two-tailed non-parametric Spearman rank tests; p values <0.05 were considered statistically significant and are bolded and correlation coefficients values are shown.
Figure 4:
Figure 4:. SARS-CoV-2-specific T cell responses in children compared to convalescent adults
(A) The demographic characteristics of 30 unvaccinated convalescent adults included in this study. Age, sex, SARS-CoV-2 PCR-positivity, days since PCR test and collection date are shown. (B) Frequency of SARS-CoV-2-specific CD4+ T cells producing any of the measured cytokines (IFN-γ, TNF-α, or IL-2) in SARS-CoV-2 convalescent HCW (purple; n=30) and seropositive children (light blue; n=41). The pie charts represent the proportion of responders with a detectable T cell response to SARS-CoV-2 SNM combined peptide pools. Bars represent median of the responders. (C) Frequency of SARS-CoV-2-specific CD8+ T cells producing any of the measured cytokines (IFN-γ, TNF-α, or IL-2) in SARS-CoV-2 convalescent HCW (dark red; n=30) and seropositive children (light red; n=41). The bars represent the median of the responders and median values are indicated. Statistical comparisons were performed using the Mann-Whitney test between seropositive children and adults and the Chi-square test was used to compare the percentage of responders; p values <0.05 were considered statistically significant and are bolded. (D) Correlations between SARS-CoV-2-specific CD4+ or CD8+ T cells and age in convalescent HCW (purple and dark red; n=30) and seropositive (light blue and light red; n=41) children. Statistical comparisons were performed using a two-tailed non-parametric Spearman rank tests; p values <0.05 were considered statistically significant and are bolded and correlation coefficients are shown.

References

    1. Aleebrahim-Dehkordi E, Soveyzi F, Deravi N, Rabbani Z, Saghazadeh A, Rezaei N. Human coronaviruses SARS-CoV, MERS-CoV, and SARS-CoV-2 in children. J Pediatr Nurs. 2021;56:70–79. doi: 10.1016/j.pedn.2020.10.020 - DOI - PMC - PubMed
    1. Chou J, Thomas PG, Randolph AG. Immunology of SARS-CoV-2 infection in children. Nat Immunol. 2022;23(2):177–185. doi: 10.1038/s41590-021-01123-9 - DOI - PMC - PubMed
    1. UNICEF. COVID-19 confirmed cases and deaths, age and sex-disaggregated data. Published April 2023. https://data.unicef.org/resources/covid-19-confirmed-cases-and-deaths-da.... Accessed April 27, 2023.
    1. Kim L, Whitaker M, Kambhampati A, et al. Hospitalization Rates and Characteristics of Children Aged <18 Years Hospitalized with Laboratory-Confirmed COVID-19 — COVID-NET, 14 States, March 1–July 25, 2020. 2020;69(32):1081–1088. https://www.cdc.gov/coronavirus/2019-ncov/covid-data/covidview/purpose- - PMC - PubMed
    1. COVID-NET. COVID-19-Associated Hospitalization Surveillance Network, Centers for Disease Control and Prevention. Published April 2023. https://gis.cdc.gov/grasp/covidnet/covid19_5.html. Accessed April 27, 2023

Publication types