[Preprint]. 2023 May 15:rs.3.rs-2846437.
doi: 10.21203/rs.3.rs-2846437/v1.

BAX activation in mouse retinal ganglion cells occurs in two temporally and mechanistically distinct steps

Affiliations

BAX activation in mouse retinal ganglion cells occurs in two temporally and mechanistically distinct steps

Margaret E Maes et al. Res Sq. .

Update in

Abstract

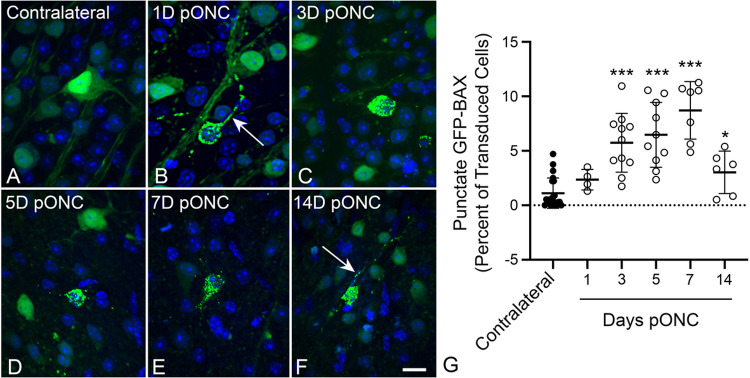
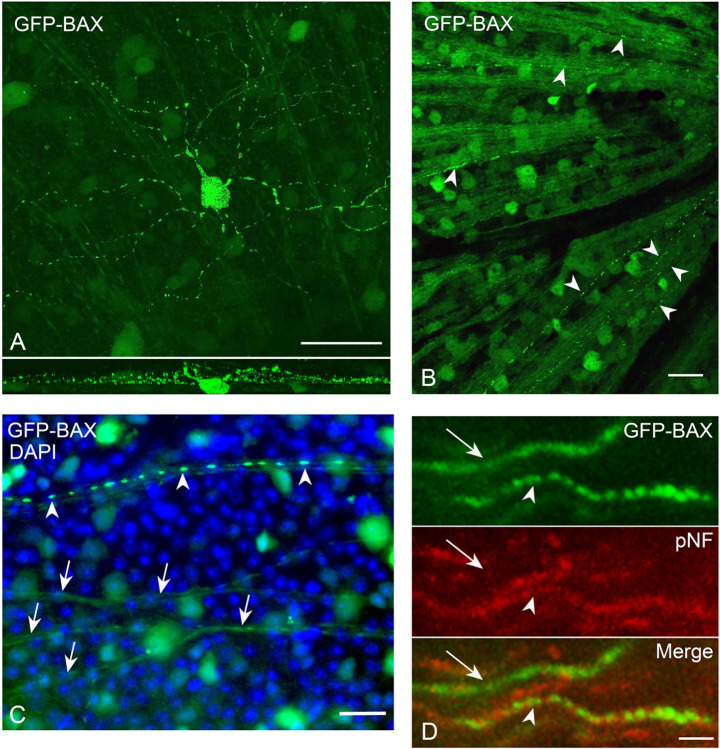
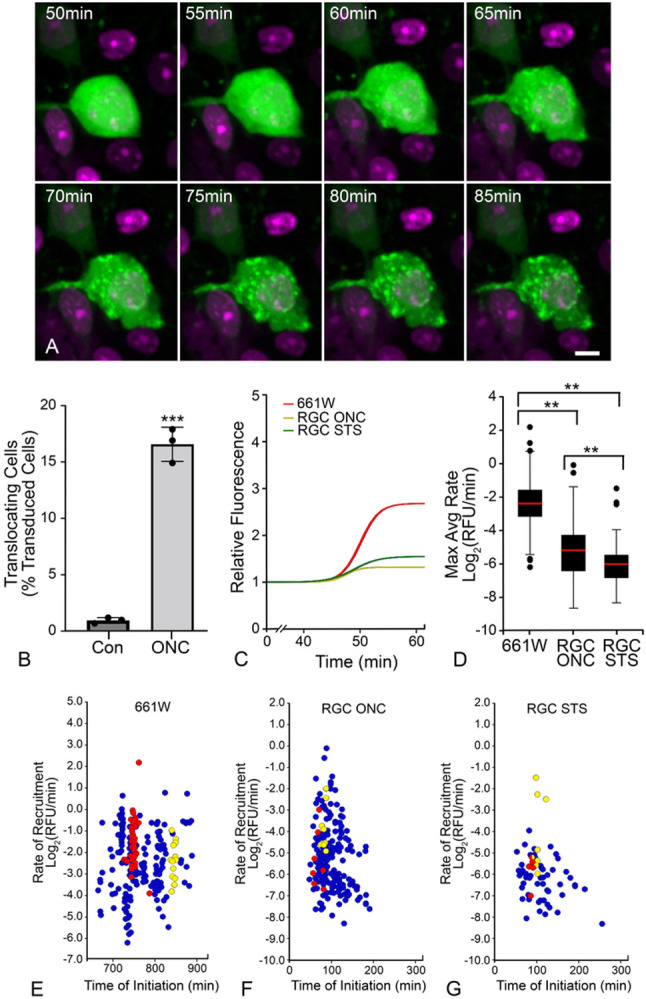
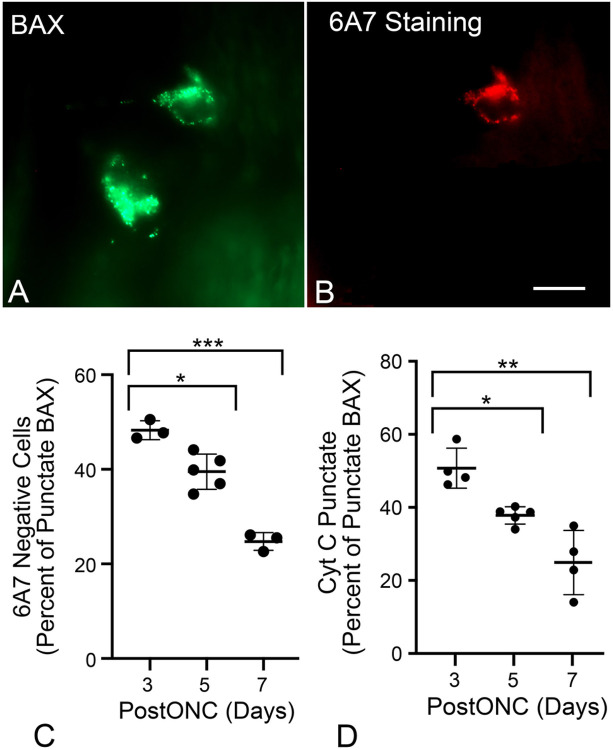
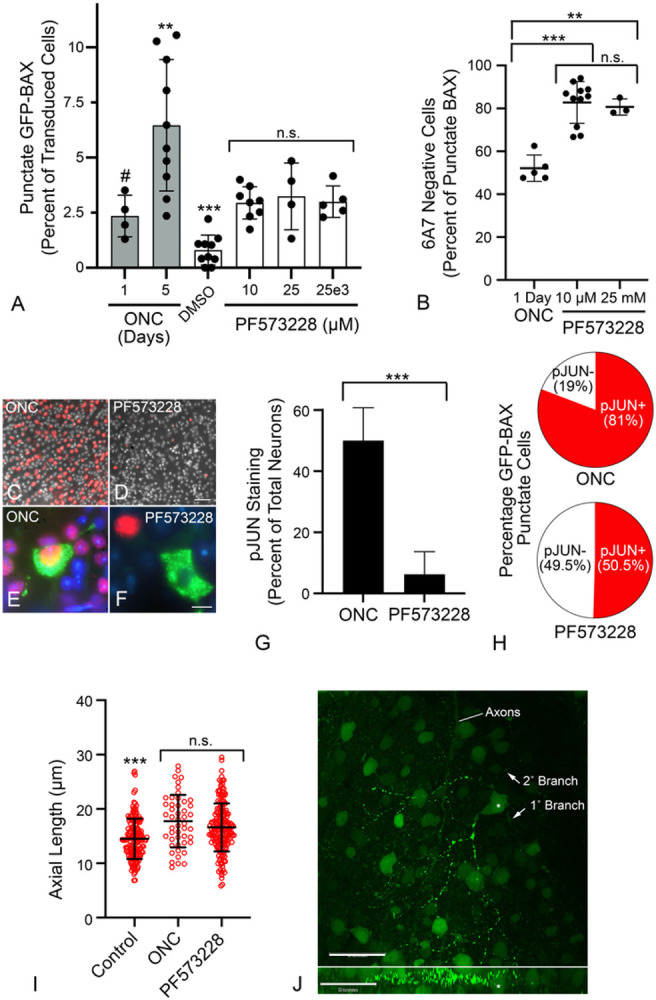
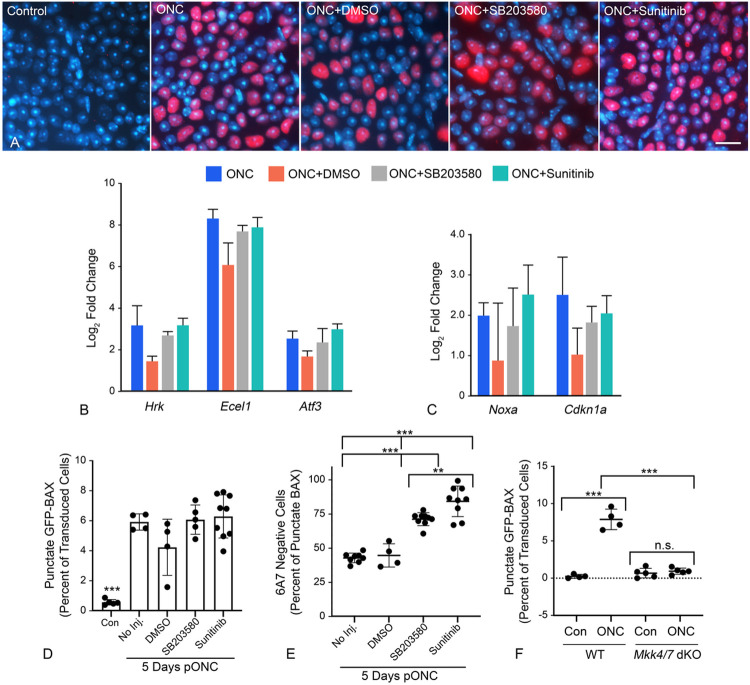
Background Pro-apoptotic BAX is a central mediator of retinal ganglion cell (RGC) death after optic nerve damage. BAX activation occurs in two stages including translocation of latent BAX to the mitochondrial outer membrane (MOM) and then permeabilization of the MOM to facilitate the release of apoptotic signaling molecules. As a critical component of RGC death, BAX is an attractive target for neuroprotective therapies and an understanding of the kinetics of BAX activation and the mechanisms controlling the two stages of this process in RGCs is potentially valuable in informing the development of a neuroprotective strategy. Methods The kinetics of BAX translocation were assessed by both static and live-cell imaging of a GFP-BAX fusion protein introduced into RGCs using AAV2-mediated gene transfer in mice. Activation of BAX was achieved using an acute optic nerve crush (ONC) protocol. Live-cell imaging of GFP-BAX was achieved using explants of mouse retina harvested 7 days after ONC. Kinetics of translocation in RGCs were compared to GFP-BAX translocation in 661W tissue culture cells. Permeabilization of GFP-BAX was assessed by staining with the 6A7 monoclonal antibody, which recognizes a conformational change in this protein after MOM insertion. Assessment of individual kinases associated with both stages of activation was made using small molecule inhibitors injected into the vitreous either independently or in concert with ONC surgery. The contribution of the Dual Leucine Zipper-JUN-N-Terminal Kinase cascade was evaluated using mice with a double conditional knock-out of both Mkk4 and Mkk7 . Results ONC induces the translocation of GFP-BAX in RGCs at a slower rate and with less intracellular synchronicity than 661W cells, but exhibits less variability among mitochondrial foci within a single cell. GFP-BAX was also found to translocate in all compartments of an RGC including the dendritic arbor and axon. Approximately 6% of translocating RGCs exhibited retrotranslocation of BAX immediately following translocation. Unlike tissue culture cells, which exhibit simultaneous translocation and permeabilization, RGCs exhibited a significant delay between these two stages, similar to detached cells undergoing anoikis. Translocation, with minimal permeabilization could be induced in a subset of RGCs using an inhibitor of Focal Adhesion Kinase (PF573228). Permeabilization after ONC, in a majority of RGCs, could be inhibited with a broad spectrum kinase inhibitor (sunitinib) or a selective inhibitor for p38/MAPK14 (SB203580). Intervention of DLK-JNK axis signaling abrogated GFP-BAX translocation after ONC. Conclusions A comparison between BAX activation kinetics in tissue culture cells and in cells of a complex tissue environment shows distinct differences indicating that caution should be used when translating findings from one condition to the other. RGCs exhibit both a delay between translocation and permeabilization and the ability for translocated BAX to be retrotranslocated, suggesting several stages at which intervention of the activation process could be exploited in the design of a therapeutic strategy.


Figures

Figure 1
Figure 1
Static imaging of GFP-BAX expressing cells in BALB/cByJ mice showing the time course for GFP-BAX translocation as a function of time after optic nerve crush (ONC). Previously, we have documented that the translocated GFP-BAX forms puncta localized to mitochondria in these cells (25). (A-F) Static imaging of GFP-BAX expressing cells in retinal whole mounts at times post-ONC (pONC) showing localization changes from diffuse to punctate distribution of the fusion protein. In some cells, punctate GFP-BAX is also evident in the axon originating from the cell (arrows in B, F). Scale bar = 20 μm. (G) Graph showing the change in percentage of GFP-BAX transduced cells that exhibit punctate labeling pONC. A significant increase in punctate cells is evident at 3, 5, 7 and 14 days pONC relative to contralateral eyes (*P=0.012, ***P<0.0001, individual t-tests). This pattern is consistent with descriptions of BAX accumulation in cells of the ganglion cell layer after optic nerve damage in rats and mice reported by others (25, 32, 48, 50).
Figure 2
Figure 2
GFP-BAX is translocated in all compartments of retinal ganglion cells (RGCs). (A) A confocal image of a RGC displaying punctate GFP-BAX translocation throughout the dendritic arbor and soma (the intraretinal axon was not conclusively identified in this image) after optic nerve crush (ONC). The lower panel shows the Z-plane of the stack. Given the size and arbor stratification, this likely represents an a-ON sustained RGC. Scale Bar = 50 μm. (B) Retinal whole mount showing intraretinal axons filled with GFP-BAX near the optic nerve head (right). Several axons exhibit punctate localization of GFP-BAX (arrowheads). Scale bar = 20 μm. (C) Higher magnification of a whole mounted retina comparing diffusely labeled axons (arrows) and a punctate labeled axon (arrowheads). Punctate labeled intraretinal axons could be identified in retinas at all time points after ONC examined. Scale bar = 25 μm. (D) Punctate labeling of GFP-BAX in axons of the optic nerve distal to the optic nerve head. Cell death in this experiment was induced by intravitreal injection of staurosporine 24 hrs previously in order to preserve axon integrity with the RGC soma. An axon with diffuse GFP-BAX (arrow) is compared to an axon with punctate GFP-BAX (arrowhead). Note that the axon with punctate GFP-BAX also counterstains with an antibody against phosphorylated neurofilament (pNF) consistent with reports that degenerating neurons, including RGCs, accumulate this antigen (54, 126). Scale bar = 4 μm.
Figure 3
Figure 3
Ex vivo live cell imaging of GFP-BAX translocation in retinal ganglion cells (RGCs) of retinal explants. (A) Still images of a GFP-BAX expressing RGC going punctate during a live-cell imaging session (see supplemental video S1). The time stamp refers to the elapsed time from the initiation of the imaging session. DRAQ5 counterstaining was used to highlight nuclei. Scale bar = 5 μm. (B) Graph showing the conversion of imaged cells going from diffuse to punctate in retinas from optic nerve crush eyes (ONC) relative to contralateral eyes (Con). Significantly more cells converted to punctate GFP-BAX in the ONC retinas compared to contralateral retinas during the imaging period (***P>0.001, t-test), indicating that initiation of GFP-BAX translocation was primarily reliant on previous ONC. (C) Graph showing the median curves of GFP-BAX translocation comparing RGCs after ONC, naïve RGCs exposed to 1 μM staurosporine (STS) during the imaging session and differentiated retinal precursor tissue culture cells (661W) induced for apoptosis by the expression of histone deacetylase 3 (HDAC3) (31). The time scale (X-axis) has been normalized to show a common time for initiation of BAX accumulation. Raw accumulation curves are shown in supplemental Figure S1. (D) Box and Whisker (5% and 95% limits shown in bars) plots of the maximum rates of GFP-BAX accumulation for all groups shown in (C). The rate of GFP-BAX accumulation in RGC somas is slowest after STS exposure (**P<0.001, t-test), but both STS and ONC induce a slower rate of accumulation than that observed in 661W cells (**P<0.001, individual t-tests). Of note, 661W cells exhibit a rate of BAX accumulation that is consistent with multiple different lines of tissue culture cells undergoing apoptosis (Table 1). (E-G) Scatter plots showing the max rate versus time of initiation for individual BAX puncta in the 3 groups. The time scale for graph (E) indicates the time after transfection of differentiated cells with a plasmid expressing human HDAC3. The time scale for graphs (F and G) was set to “0” when imaging of the explant began. Foci from 2 individual cells are plotted as red and yellow circles, respectively. The more stacked the alignment of points relative to the X-axis is indicative of simultaneous initiation of GFP-BAX translocation at all sites within a cell. The broad range of points relative to the Y-axis is indicative of variable rates of translocation at different mitochondrial foci within a single cell. Analysis of the coefficient of variation for both initiation and rate indicate that RGCs exhibit greater variability in initiation times and less variability of the intracellular rates, than 661W cells (see Supplemental Figure S2).
Figure 4
Figure 4
Ex vivo imaging shows some RGCs exhibit translocation followed by retrotranslocation. (A) Still images from a RGC that exhibited retrotranslocation during a live-cell imaging session (see supplementary video S2). The time stamp refers to the elapsed time from the initiation of the imaging session. DRAQ5 counterstaining was used to highlight nuclei. Scale bar = 10 μm. (B) Median curves of all data showing that “ON” rates (maximum linear slope) are equal between RGCs with stable translocation and retrotranslocating RGCs. The hashed green line shows the actual median curve of the OFF retrotranslocation data, while the solid green line is the same data that has been flipped on the vertical axis to better highlight the maximum rate compared to the ON rates. The “OFF” rate is slower implying a distinct mechanism driving the retrotranslocation. (C) Box and whisker plot of all rates. The “ON” rates of GFP-BAX translocation is the same comparing stable RGCs and RGCs that exhibit retrotanslocation (P=0.21). The “OFF” rate of GFP-BAX in these cells, however, is significantly slower than both “ON” rates (***P<0.0001, ANOVA). (D) Box and whisker plot of final relative fluorescence showing that stable cells and retrotranslocating cells accumulate similar levels of BAX, while the amount of BAX retrotranslocated is equal to the amount of BAX that was originally translocated in these cells.
Figure 5
Figure 5
Translocated BAX exhibits a delay before being activated. (A,B) Image of 2 cells exhibiting punctate localization of GFP-BAX induced by ONC and counterstained with the 6A7 monoclonal antibody that recognizes an epitope of BAX that is exposed after activation. Only 1 of the 2 cells is clearly labeled by the antibody. Scale bar = 15 μm. (C) Quantification of the percentage of punctate GFP-BAX cells that are negative for 6A7-staining at times after optic nerve crush (postONC). The mean percentages of cells that are paused for GFP-BAX activation are 48.27% at 3 days after ONC, which decreases to 39.51% at 5 days and 24.73% at 7 days. (D) Scatter plot showing the percentage of cells with punctate mCherry-BAX that also have punctate cytochrome c (Cyt C)-GFP (see Supplemental Figure S3) at days 3, 5, and 7 after ONC. The percentage of paused cells is 50.91% at 3 days after ONC and drops to 38.01% and 25.16% on days 5 and 7, respectively. (*P<0.001, **P=0.0025, ***P<0.0001).
Figure 6
Figure 6
Characteristics of BAX translocation and activation in cells after direct inhibition of Focal Adhesion Kinase (FAK) with PF573228. (A) Quantification of the percentage of GFP-BAX cells that translocate BAX 1 day after intravitreal injection of PF573228. Data are compared to percentages of cells induced by optic nerve crush (ONC) shown in Figure 1 (grey bars). PF573228 induces an increase in the formation of punctate cells that is significantly greater than DMSO vehicle injections alone (***P<0.001), but the level is irrespective of the dose of PF573228 injected (n.s., not significant). PF573228 induces a similar level of translocation observed 1 day after ONC (#P=0.6404, ANOVA), but less than observed 5 days after ONC (**P=0.0031). (B) Translocated BAX induced by PF573228 is predominantly in the paused state (6A7 staining negative) 1 day after injection, at levels significantly exceeding those observed 1 day after ONC (**P=0.0004, ***P<0.0001, individual t-tests). (C,D) Retinal whole mounts 1 day after ONC (C) or PF573228 injection (D) stained for pJUN (red). Both treatments induce pJUN accumulation in cells of the ganglion cell layer, although they are more abundant in ONC. Scale bar = 60 μm. DAPI counterstain. (E, F) High magnification of two RGCs exhibiting punctate GFP-BAX (green) and exhibiting robust pJUN accumulation (E) or absence of pJUN accumulation (F). Scale bar = 7 μm. DAPI counterstain. (G) Histogram showing the mean percentage of total neurons expressing pJUN 1 d after ONC compared to 1 d after PF573228 injection (mean ± SD, n=3 and 4 retinas, respectively). (***P<0.0001, t-test). (H) Pie charts showing the distribution of cells with punctate GFP-BAX that exhibit pJUN accumulation (red sectors) in both ONC and PF573228 retinas (n=3 and 4 retinas, respectively). Significantly more cells in ONC retinas with BAX translocation were also pJUN positive (P<0.0001, c2 test). (I) Scatter plots of maximal axial length of GFP-BAX transduced cells. Both ONC and PF573228 induce BAX translocation in larger cells relative to the population of transduced cells with diffuse BAX in control retinas, 1 day after ONC or injection (ANOVA, ***P<0.0003). There was no significant difference (n.s., t-test, P=0.119) between cell sizes in the two experimental groups. Cohorts contained between 48-361 cells measured from retinas of minimum of 3 mice per group. (J) Confocal Z-stack of a cell with partial GFP-BAX translocation in its dendritic arbor induced by PF573228 injection (Z plane shown in lower panel). An asterisk indicates the cell soma. Translocation is observed in regions of the arbor but is not fully extended to the soma, other primary branches and some secondary branches from a branch that is punctate. Axons from different labeled RGCs are indicated. Scale bars = 50 μm.
Figure 7
Figure 7
The effect of kinase inhibitors on the processes of BAX translocation and activation. Two inhibitors that are predicted to affect elements of the DLK signaling axis (SB2035580 to inhibit p38/MAPK14 and Sunitinib as a broad spectrum inhibitor) were injected into eyes immediately after optic nerve crush (ONC) surgery. (A) Immunostaining for nuclear accumulation of pJUN, 1 day after ONC surgery, shows both inhibitors have no effect on this surrogate for JUN activation. Scale bar = 15 μm. (B, C) Quantitative PCR analysis of pJUN (B) and p53 (C) target genes 5 days after ONC. Similar to pJUN staining results, neither of the inhibitors prevented normal increases in transcript abundance from both transcription factors. (D) Quantification of the percentage of transduced cells exhibiting GFP-BAX translocation at 5 days after ONC. Neither inhibitor suppressed the translocation response, which were significantly increased relative to contralateral eyes (Con) (***P<0.0001 for each ONC group in individual comparisons by t-test). (E) Analysis of BAX activation by 6A7-immunostaining showed that both inhibitors suppressed permeabilization of translocated BAX relative to ONC alone or ONC with DMSO vehicle injection (ANOVA, ***P<0.0001). Notably, Sunitinib significantly reduced BAX permeabilization relative to SB203580 (t test, **P=0.0053) even though it is not reported as a p38/MAPK14 inhibitor (73). (F) Quantification of the percentage of transduced cells exhibiting GFP-BAX translocation 5 days after ONC, comparing Mkk4fl;Mkk7fl Tg mice without prior introduction of Cre recombinase by AAV2-mediated gene transduction (considered wild type, WT) with Mkk4fl;Mkk7fl mice exposed to AAV2-Cre prior to crush surgery (Mkk4/7 dKO). WT mice exhibit an ONC-induced increase in cells showing translocation relative to contralateral eyes (***P<0.0001). Mice conditionally lacking function MKK4 and MKK7 exhibit significantly fewer punctate cells after ONC, relative to WT animals (***P<0.0001) and no discernable change in translocating cells relative to contralateral eyes (n.s., not significant).

References

    1. Edlich F, Banerjee S, Suzuki M, Cleland MM, Amoult D, Wang C, et al. Bcl-XL retrotranslocates Bax from the mitochondria into the cytosol. Cell. 2011;145:104–16. - PMC - PubMed
    1. Todt F, Reichenbach F, Youle RJ, Edlich F. The C-terminal helix of Bcl-X mediates Bax retrotranslocation from the mitochondria. Cell Death Differ. 2013;20:333–42. - PMC - PubMed
    1. Todt F, Cakir Z, Reichenbach F, Emschermann F, Lauterwasser J, Kaiser A, et al. Differential retrotranslocation of mitochondrial Bax and Bak. EMBO J. 2014;34:67–80. - PMC - PubMed
    1. Gavathiotis E, Reyna DE, Davis ML, Bird GH, Walensky LD. BH3-triggered structural reorganization drives the activation of proapoptotic BAX. Mol Cell. 2010;40:481–92. - PMC - PubMed
    1. Happo L, Strasser A, Cory S. BH3-only proteins in apoptosis at a glance. J Cell Sci. 2012;125:1081–7. - PMC - PubMed

Publication types