[Preprint]. 2023 Jun 6:2023.06.02.543519.
doi: 10.1101/2023.06.02.543519.

Rapid and sensitive detection of genome contamination at scale with FCS-GX

Affiliations

Rapid and sensitive detection of genome contamination at scale with FCS-GX

Alexander Astashyn et al. bioRxiv. .

Update in

  • Rapid and sensitive detection of genome contamination at scale with FCS-GX.
    Astashyn A, Tvedte ES, Sweeney D, Sapojnikov V, Bouk N, Joukov V, Mozes E, Strope PK, Sylla PM, Wagner L, Bidwell SL, Brown LC, Clark K, Davis EW, Smith-White B, Hlavina W, Pruitt KD, Schneider VA, Murphy TD. Astashyn A, et al. Genome Biol. 2024 Feb 26;25(1):60. doi: 10.1186/s13059-024-03198-7. Genome Biol. 2024. PMID: 38409096 Free PMC article.

Abstract

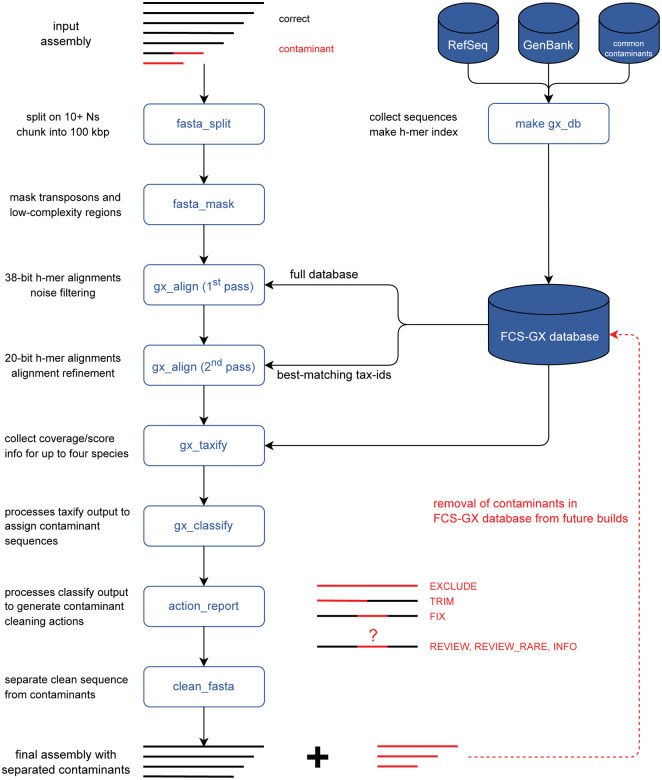
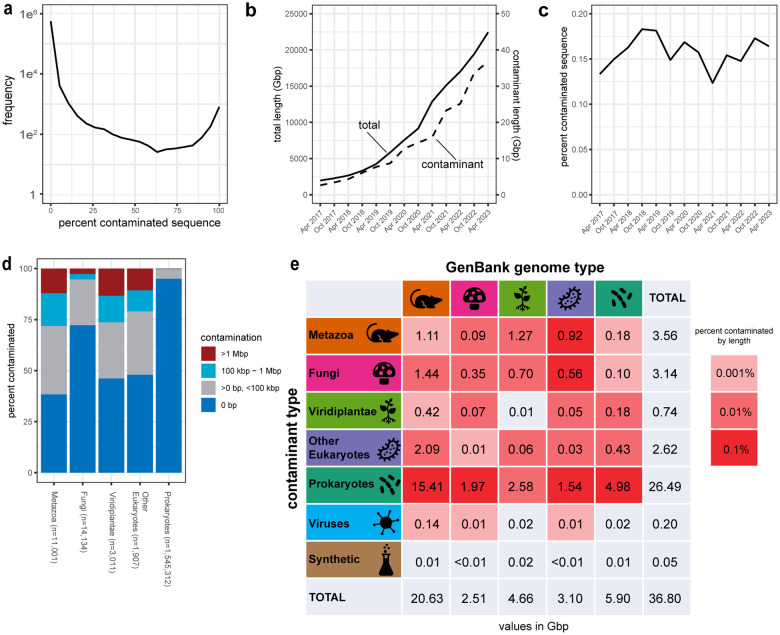
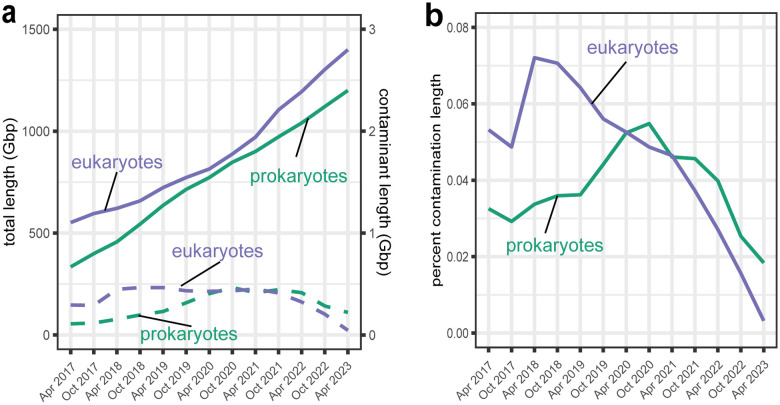
Assembled genome sequences are being generated at an exponential rate. Here we present FCS-GX, part of NCBI's Foreign Contamination Screen (FCS) tool suite, optimized to identify and remove contaminant sequences in new genomes. FCS-GX screens most genomes in 0.1-10 minutes. Testing FCS-GX on artificially fragmented genomes demonstrates sensitivity >95% for diverse contaminant species and specificity >99.93%. We used FCS-GX to screen 1.6 million GenBank assemblies and identified 36.8 Gbp of contamination (0.16% of total bases), with half from 161 assemblies. We updated assemblies in NCBI RefSeq to reduce detected contamination to 0.01% of bases. FCS-GX is available at https://github.com/ncbi/fcs/.

Keywords: GenBank; Genome assembly; Genome contamination; Genome quality; RefSeq; Software.


Conflict of interest statement

Competing interests The authors declare that they have no competing interests.

Figures

Fig. 1
Fig. 1
Overview of FCS-GX pipeline. FCS-GX splits genome assembly scaffolds into contigs and chunks contigs into 100 kbp subsequences for processing. FCS-GX performs repeat detection and masking in eukaryote assemblies. The GX aligner operates in two passes using modified k-mers (h-mers) to align query sequences first to the entire indexed reference database and second to sequences corresponding to the tax-id sets providing best matches for alignment refinement. After collecting coverage and score information FCS-GX assigns likely contaminant sequences by comparing the taxonomic assignment calculated for each sequence by the user-specified tax-id. The final output from FCS-GX is a cleaned FASTA alongside an action report that details contaminant cleaning actions taken (FCS-GX actions EXCLUDE, TRIM, FIX) as well as details for additional sequences warranting manual review but are not automatically cleaned (FCS-GX actions REVIEW, REVIEW_RARE, INFO). See Methods for descriptions of FCS-GX action categories. FCS-GX uses a custom reference database totaling 709 Gbp of sequence data from assemblies and common contaminants used in current NCBI screening. Assemblies contributing to the database were screened by FCS-GX while excluding self-hits. High-confidence contaminants were removed in order to use the database for screening new genomes.
Fig. 2
Fig. 2
Sensitivity and specificity of FCS-GX contamination detection. a Distributions of sensitivity measurements. Distributions are shown for artificially fragmented genomes in five “kingdom” groups. Sensitivity is shown for genomes fragmented at three different window sizes (1 kbp, 10 kbp, 100 kbp). For each window size, sensitivity is shown for FCS-GX runs while including the same species tax-ids as the source genome during the alignment stage (+) and while excluding same species tax-ids (−). b Distributions of specificity measurements for the same set of fragmented genomes in a. The dotplot shows an enlarged view of the upper limit of specificity (98–100%). The full dotplot including ten outliers not visualized here is available at Additional file 1: Fig. S4. See Additional file 2: Table S1 for complete sensitivity and specificity score data.
Fig. 3
Fig. 3
FCS-GX detection of contamination in NCBI databases. a Distribution of the proportion of contaminated sequence per genome detected by FCS-GX in the NCBI GenBank database. Genome counts (frequency) were computed in 5% intervals. b Aggregate length of total genome sequence (solid line) and contaminated sequence detected by FCS-GX (dashed line) in the NCBI GenBank database from 2017 to 2023. c Percentage of contaminated sequence detected by FCS-GX (dashed line) in the NCBI GenBank database from 2017 to 2023, i.e., the quotient of the contaminant amount divided by the total amount displayed in b. See Additional file 2: Table S6 for supporting numerical data. D Percentage of contaminated genomes in GenBank and RefSeq. Total numbers of screened genomes are shown for five taxonomic “kingdom” groups: Metazoa (animals), Fungi, Viridiplantae (green plants), Other eukaryotes, and Prokaryotes (Bacteria + Archaea). Within each group, genomes are placed into four bins corresponding to the amount of contamination per genome and percentages are calculated for the count of genomes in each bin divided by total screened genomes. E Aggregate contamination lengths identified in genomes from five “kingdom” groups. Colors of grid squares indicate aggregate contamination lengths from seven sources (five kingdoms, plus virus and synthetic) that correspond to percentages of total assembly length for each GenBank kingdom group. See Additional file 2: Table S5 for supporting numerical kingdom contamination summary data.
Fig. 4
Fig. 4
FCS-GX detection of contamination in the NCBI RefSeq database. A Aggregate length of total genome sequence (solid line) and contaminated sequence detected by FCS-GX (dashed line) in NCBI RefSeq from 2017 to 2023. B Contaminant fraction detected by FCS-GX (dashed line) in NCBI RefSeq database from 2017 to 2023, i.e., the quotient of the contaminant amount divided by the total amount displayed in a. See Additional file 2: Table S14 for supporting numerical Refseq contamination summary data.

References

    1. Sayers EW, Cavanaugh M, Clark K, Pruitt KD, Schoch CL, Sherry ST, Karsch-Mizrachi I. GenBank. Nucleic Acids Res. 2022; 50:D161–d164. - PMC - PubMed
    1. Cornet L, Baurain D. Contamination detection in genomic data: more is not enough. Genome Biol. 2022; 23:60. - PMC - PubMed
    1. Lu J, Salzberg SL. Removing contaminants from databases of draft genomes. PLoS Comput Biol. 2018; 14:e1006277. - PMC - PubMed
    1. van der Valk T, Vezzi F, Ormestad M, Dalén L, Guschanski K. Index hopping on the Illumina HiseqX platform and its consequences for ancient DNA studies. Mol Ecol Resour. 2020; 20:1171–1181. - PubMed
    1. Sinha R, Stanley G, Gulati GS, Ezran C, Travaglini KJ, Wei E, Chan CK, Nabhan AN, Su T, Morganti RM. Index switching causes “spreading-of-signal” among multiplexed samples in Illumina HiSeq 4000 DNA sequencing. BioRxiv. 2017; 10.1101/125724. - DOI

Publication types