

This is a preprint.
Explicit Ion Modeling Predicts Physicochemical Interactions for Chromatin Organization
- PMID: 37293007
- PMCID: PMC10245791
- DOI: 10.1101/2023.05.16.541030
Explicit Ion Modeling Predicts Physicochemical Interactions for Chromatin Organization
Update in
- This article has been published with doi: 10.7554/eLife.90073.3
-
Explicit ion modeling predicts physicochemical interactions for chromatin organization.Elife. 2024 Jan 30;12:RP90073. doi: 10.7554/eLife.90073. Elife. 2024. PMID: 38289342 Free PMC article.
Abstract
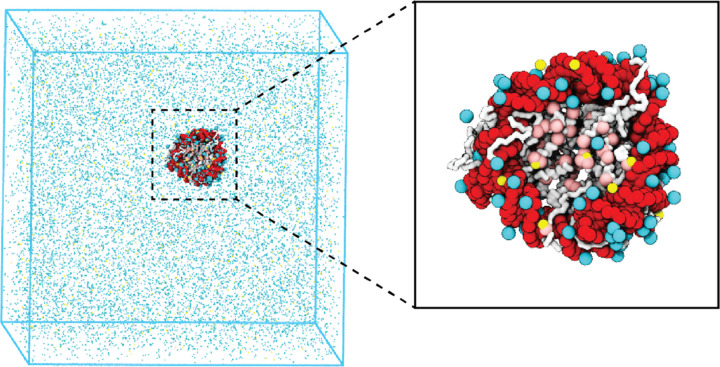
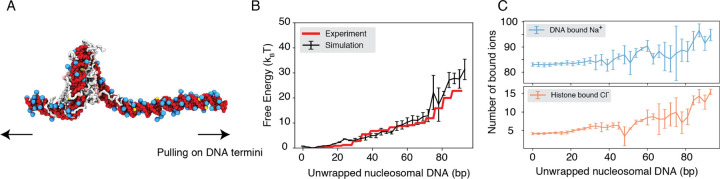
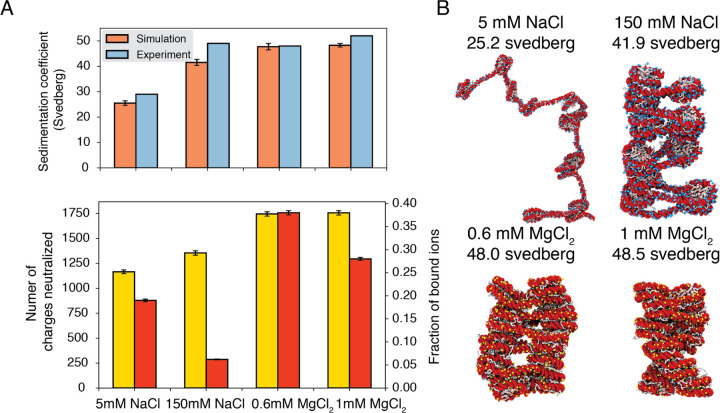
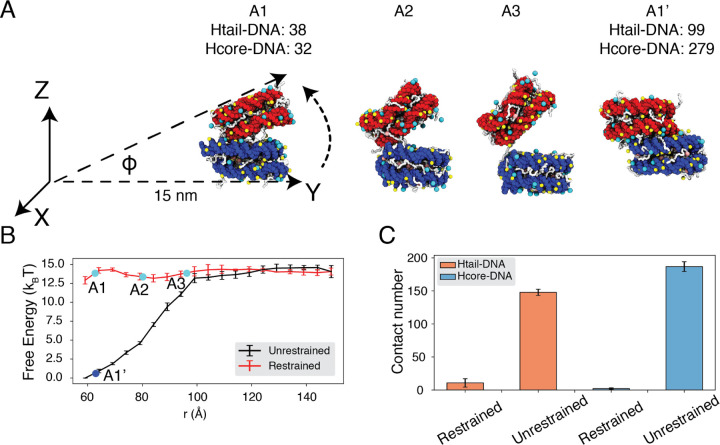
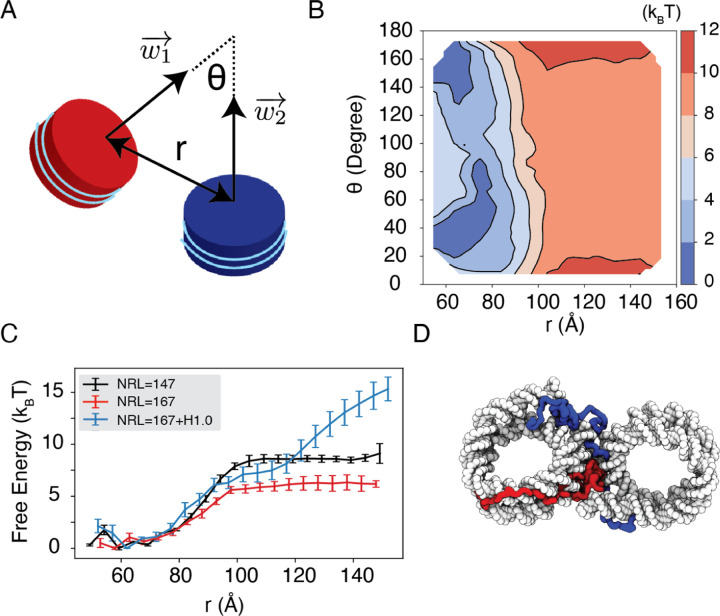
Molecular mechanisms that dictate chromatin organization in vivo are under active investigation, and the extent to which intrinsic interactions contribute to this process remains debatable. A central quantity for evaluating their contribution is the strength of nucleosome-nucleosome binding, which previous experiments have estimated to range from 2 to 14 kBT. We introduce an explicit ion model to dramatically enhance the accuracy of residue-level coarse-grained modeling approaches across a wide range of ionic concentrations. This model allows for de novo predictions of chromatin organization and remains computationally efficient, enabling large-scale conformational sampling for free energy calculations. It reproduces the energetics of protein-DNA binding and unwinding of single nucleosomal DNA, and resolves the differential impact of mono and divalent ions on chromatin conformations. Moreover, we showed that the model can reconcile various experiments on quantifying nucleosomal interactions, providing an explanation for the large discrepancy between existing estimations. We predict the interaction strength at physiological conditions to be 9 kBT, a value that is nonetheless sensitive to DNA linker length and the presence of linker histones. Our study strongly supports the contribution of physicochemical interactions to the phase behavior of chromatin aggregates and chromatin organization inside the nucleus.
Figures
Similar articles
-
Explicit ion modeling predicts physicochemical interactions for chromatin organization.Elife. 2024 Jan 30;12:RP90073. doi: 10.7554/eLife.90073. Elife. 2024. PMID: 38289342 Free PMC article.
-
Nucleosome condensate and linker DNA alter chromatin folding pathways and rates.bioRxiv [Preprint]. 2024 Nov 16:2024.11.15.623891. doi: 10.1101/2024.11.15.623891. bioRxiv. 2024. PMID: 39605526 Free PMC article. Preprint.
-
Chromatin ionic atmosphere analyzed by a mesoscale electrostatic approach.Biophys J. 2010 Oct 20;99(8):2587-96. doi: 10.1016/j.bpj.2010.08.023. Biophys J. 2010. PMID: 20959100 Free PMC article.
-
Chromatin Compaction Multiscale Modeling: A Complex Synergy Between Theory, Simulation, and Experiment.Front Mol Biosci. 2020 Feb 25;7:15. doi: 10.3389/fmolb.2020.00015. eCollection 2020. Front Mol Biosci. 2020. PMID: 32158765 Free PMC article. Review.
-
Unraveling the multiplex folding of nucleosome chains in higher order chromatin.Essays Biochem. 2019 Apr 23;63(1):109-121. doi: 10.1042/EBC20180066. Print 2019 Apr 23. Essays Biochem. 2019. PMID: 31015386 Review.
References
-
- Bonev B.; Cavalli G. Organization and function of the 3D genome. Nat Rev Genet 2016, 17, 661–678. - PubMed
Publication types
Grants and funding
LinkOut - more resources
Full Text Sources