[Preprint]. 2023 May 31:2023.05.23.542006.
doi: 10.1101/2023.05.23.542006.

Assessing Fairness of AlphaFold2 Prediction of Protein 3D Structures

Affiliations

Assessing Fairness of AlphaFold2 Prediction of Protein 3D Structures

Usman Abbas et al. bioRxiv. .

Abstract

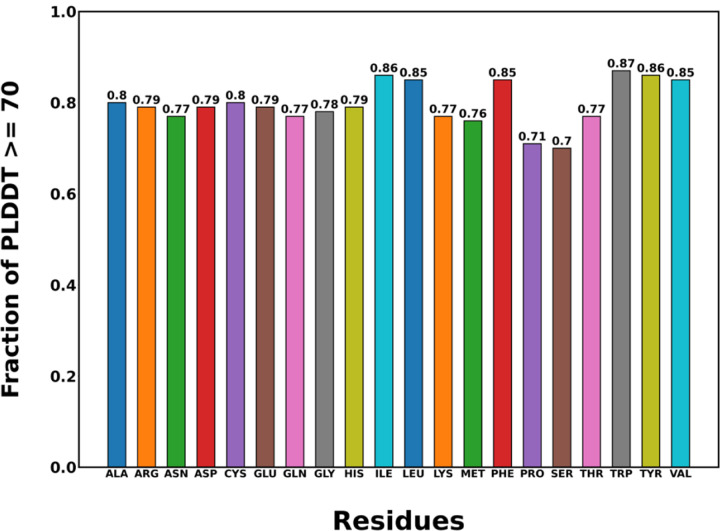
AlphaFold2 is reshaping biomedical research by enabling the prediction of a protein's 3D structure solely based on its amino acid sequence. This breakthrough reduces reliance on labor-intensive experimental methods traditionally used to obtain protein structures, thereby accelerating the pace of scientific discovery. Despite the bright future, it remains unclear whether AlphaFold2 can uniformly predict the wide spectrum of proteins equally well. Systematic investigation into the fairness and unbiased nature of its predictions is still an area yet to be thoroughly explored. In this paper, we conducted an in-depth analysis of AlphaFold2's fairness using data comprised of five million reported protein structures from its open-access repository. Specifically, we assessed the variability in the distribution of PLDDT scores, considering factors such as amino acid type, secondary structure, and sequence length. Our findings reveal a systematic discrepancy in AlphaFold2's predictive reliability, varying across different types of amino acids and secondary structures. Furthermore, we observed that the size of the protein exerts a notable impact on the credibility of the 3D structural prediction. AlphaFold2 demonstrates enhanced prediction power for proteins of medium size compared to those that are either smaller or larger. These systematic biases could potentially stem from inherent biases present in its training data and model architecture. These factors need to be taken into account when expanding the applicability of AlphaFold2.

Keywords: AI fairness; AlphaFold; protein structures.


Figures

Figure 1.
Figure 1.
The population distribution of the 20 amino acid types in batch 1.
Figure 2.
Figure 2.
The population distribution of the 8 secondary structures in batch 1.
Figure 3.
Figure 3.
The population distribution of the 20 amino acid types as a function of protein size N in batch 1. (a) N < 100 amino acids, (b) 500 ≤ N < 600 amino acids, (c) 600 ≤ N < 700 amino acids, (d) N > 1000 amino acids.
Figure 4.
Figure 4.
The population distribution of secondary structure types as a function of protein size N in batch 1. (a) N < 100 amino acids, (b) 500 ≤ N < 600 amino acids, (c) 600 ≤ N < 700 amino acids, (d) N > 1000 amino acids.
Figure 5.
Figure 5.
The distribution of PLDDT with the 20 amino acid types in batch 1. Starting from bottom whisker, the boxplots show 10th, 25th, 50th, 75th and 90th percentiles. The horizontal line is at PLDDT = 70 for medium prediction confidence.
Figure 6.
Figure 6.
The difference in the median value of PLDDT scores for amino acid pairs in batch 1.
Figure 7.
Figure 7.
The fraction of each amino acid type with PLDDT ≥ 70 in batch 1.
Figure 8.
Figure 8.
The distribution of PLDDT scores with secondary structure in batch 1.
Figure 9.
Figure 9.
The difference in median value of PLDDT scores between secondary structure pairs in batch 1.
Figure 10.
Figure 10.
The percentage of each secondary structure with PLDDT ≥ 70 in batch 1.
Figure 11.
Figure 11.
The distribution of PLDDT with the 20 amino acid types as a function of N in batch 1. (a) ILE, and (b) SER. Proteins are grouped in bins of 100 amino acids. SER-0: N < 100 amino acids, SER-1: 100 ≤ N < 200 amino, SER-10: N > 1000 amino acids.
Figure 12.
Figure 12.
The difference in median value of PLDDT scores for amino acid pairs as a function of protein size N in batch 1. (a) N < 100 amino acids, (b) 500 ≤ N < 600 amino acids, (c) 600 ≤ N < 700 amino acids, (d) N > 1000 amino acids.
Figure 13.
Figure 13.
The fraction of each amino acid with PLDDT ≥ 70 as a function of protein size in batch 1. (a) ILE, (b) SER.
Figure 14.
Figure 14.
The distribution of PLDDT with the secondary structure as a function of protein size N in batch 1. (a) alpha-helix, (b) beta-sheet, (c) coil. Grouping is done in bins of 100 amino acids. coil-0: N < 100 amino acids, coil-1: 100 ≤ N < 200 amino, coil-10: N > 1000 amino acids.
Figure 15.
Figure 15.
The difference in median value of PLDDT scores between secondary structure pairs as a function of protein size N in batch 1. a) N < 200 amino acids, (b) 500 ≤ N < 600 amino acids, (c) 600 ≤ N < 700 amino acids, (d) N > 1000 amino acids.
Figure 16.
Figure 16.
The percentage of each secondary structure with PLDDT ≥ 70 as a function of protein size in batch 1. (a) alpha helix, (b) beta sheet and, (c) coil.

References

    1. Anfinsen C.B., Principles that govern the folding of protein chains. Science, 1973. 181. - PubMed
    1. Pearce R. and Zhang Y., Deep learning techniques have significantly impacted protein structure prediction and protein design. Curr Opin Struct Biol, 2021. 68: p. 194–207. - PMC - PubMed
    1. Perrakis A. and Sixma T.K., AI revolutions in biology: The joys and perils of AlphaFold. EMBO Rep, 2021. 22(11): p. e54046. - PMC - PubMed
    1. Pinheiro F., Santos J., and Ventura S., AlphaFold and the amyloid landscape. J Mol Biol, 2021. 433(20): p. 167059. - PubMed
    1. Fleishman S.J. and Horovitz A., Extending the New Generation of Structure Predictors to Account for Dynamics and Allostery. J Mol Biol, 2021. 433(20): p. 167007. - PubMed

Publication types