

This is a preprint.
ARCH: Large-scale Knowledge Graph via Aggregated Narrative Codified Health Records Analysis
- PMID: 37293026
- PMCID: PMC10246054
- DOI: 10.1101/2023.05.14.23289955
ARCH: Large-scale Knowledge Graph via Aggregated Narrative Codified Health Records Analysis
Update in
-
ARCH: Large-scale knowledge graph via aggregated narrative codified health records analysis.J Biomed Inform. 2025 Feb;162:104761. doi: 10.1016/j.jbi.2024.104761. Epub 2025 Jan 23. J Biomed Inform. 2025. PMID: 39863245
Abstract
Objective: Electronic health record (EHR) systems contain a wealth of clinical data stored as both codified data and free-text narrative notes, covering hundreds of thousands of clinical concepts available for research and clinical care. The complex, massive, heterogeneous, and noisy nature of EHR data imposes significant challenges for feature representation, information extraction, and uncertainty quantification. To address these challenges, we proposed an efficient Aggregated naRrative Codified Health (ARCH) records analysis to generate a large-scale knowledge graph (KG) for a comprehensive set of EHR codified and narrative features.
Methods: The ARCH algorithm first derives embedding vectors from a co-occurrence matrix of all EHR concepts and then generates cosine similarities along with associated -values to measure the strength of relatedness between clinical features with statistical certainty quantification. In the final step, ARCH performs a sparse embedding regression to remove indirect linkage between entity pairs. We validated the clinical utility of the ARCH knowledge graph, generated from 12.5 million patients in the Veterans Affairs (VA) healthcare system, through downstream tasks including detecting known relationships between entity pairs, predicting drug side effects, disease phenotyping, as well as sub-typing Alzheimer's disease patients.
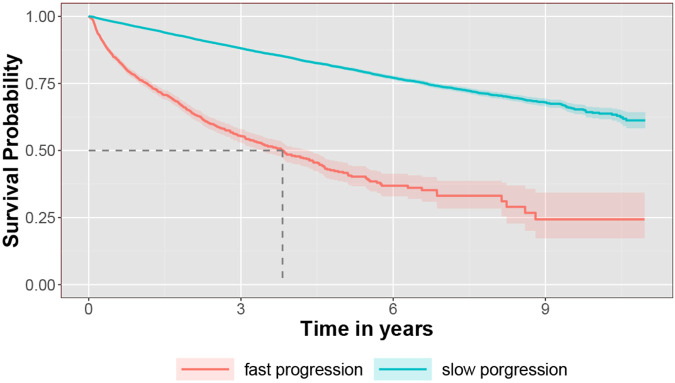
Results: ARCH produces high-quality clinical embeddings and KG for over 60,000 EHR concepts, as visualized in the R-shiny powered web-API (https://celehs.hms.harvard.edu/ARCH/). The ARCH embeddings attained an average area under the ROC curve (AUC) of 0.926 and 0.861 for detecting pairs of similar EHR concepts when the concepts are mapped to codified data and to NLP data; and 0.810 (codified) and 0.843 (NLP) for detecting related pairs. Based on the -values computed by ARCH, the sensitivity of detecting similar and related entity pairs are 0.906 and 0.888 under false discovery rate (FDR) control of 5%. For detecting drug side effects, the cosine similarity based on the ARCH semantic representations achieved an AUC of 0.723 while the AUC improved to 0.826 after few-shot training via minimizing the loss function on the training data set. Incorporating NLP data substantially improved the ability to detect side effects in the EHR. For example, based on unsupervised ARCH embeddings, the power of detecting drug-side effects pairs when using codified data only was 0.15, much lower than the power of 0.51 when using both codified and NLP concepts. Compared to existing large-scale representation learning methods including PubmedBERT, BioBERT and SAPBERT, ARCH attains the most robust performance and substantially higher accuracy in detecting these relationships. Incorporating ARCH selected features in weakly supervised phenotyping algorithms can improve the robustness of algorithm performance, especially for diseases that benefit from NLP features as supporting evidence. For example, the phenotyping algorithm for depression attained an AUC of 0.927 when using ARCH selected features but only 0.857 when using codified features selected via the KESER network[1]. In addition, embeddings and knowledge graphs generated from the ARCH network were able to cluster AD patients into two subgroups, where the fast progression subgroup had a much higher mortality rate.
Conclusions: The proposed ARCH algorithm generates large-scale high-quality semantic representations and knowledge graph for both codified and NLP EHR features, useful for a wide range of predictive modeling tasks.
Keywords: Electronic health records; knowledge graph; natural language processing; representation learning.
Figures


References
-
- Jin B. et al. Predicting the risk of heart failure with ehr sequential data modeling. IEEE Access 6, 9256–9261 (2018).
Publication types
Grants and funding
LinkOut - more resources
Full Text Sources