[Preprint]. 2023 May 19:2023.05.19.540391.
doi: 10.1101/2023.05.19.540391.

A Hypothalamic Circuit Underlying the Dynamic Control of Social Homeostasis

Affiliations

A Hypothalamic Circuit Underlying the Dynamic Control of Social Homeostasis

Ding Liu et al. bioRxiv. .

Update in

  • A hypothalamic circuit underlying the dynamic control of social homeostasis.
    Liu D, Rahman M, Johnson A, Amo R, Tsutsui-Kimura I, Sullivan ZA, Pena N, Talay M, Logeman BL, Finkbeiner S, Qian L, Choi S, Capo-Battaglia A, Abdus-Saboor I, Ginty DD, Uchida N, Watabe-Uchida M, Dulac C. Liu D, et al. Nature. 2025 Apr;640(8060):1000-1010. doi: 10.1038/s41586-025-08617-8. Epub 2025 Feb 26. Nature. 2025. PMID: 40011768 Free PMC article.

Abstract

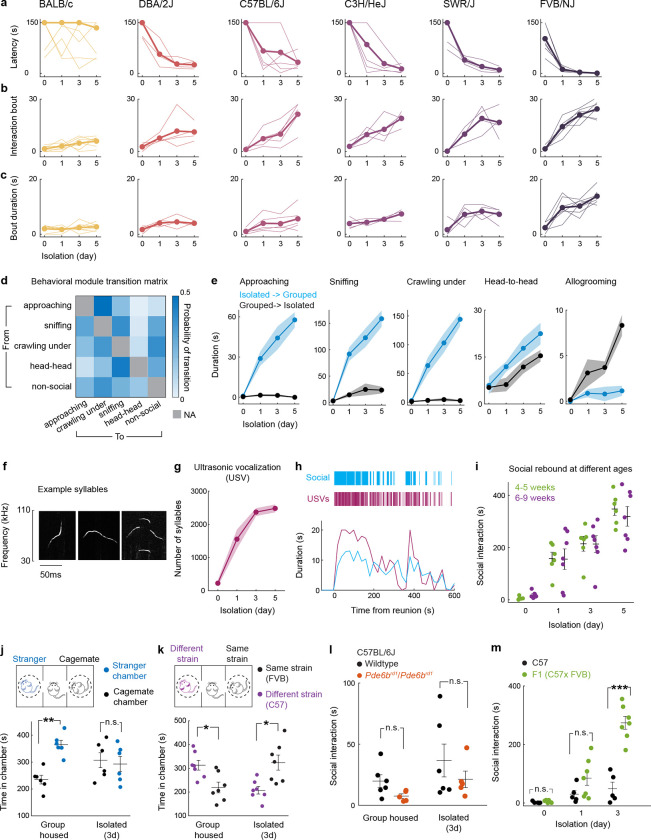
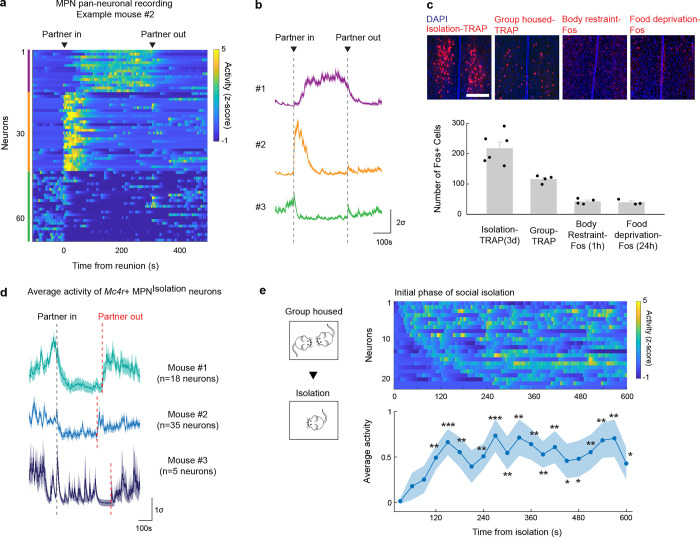
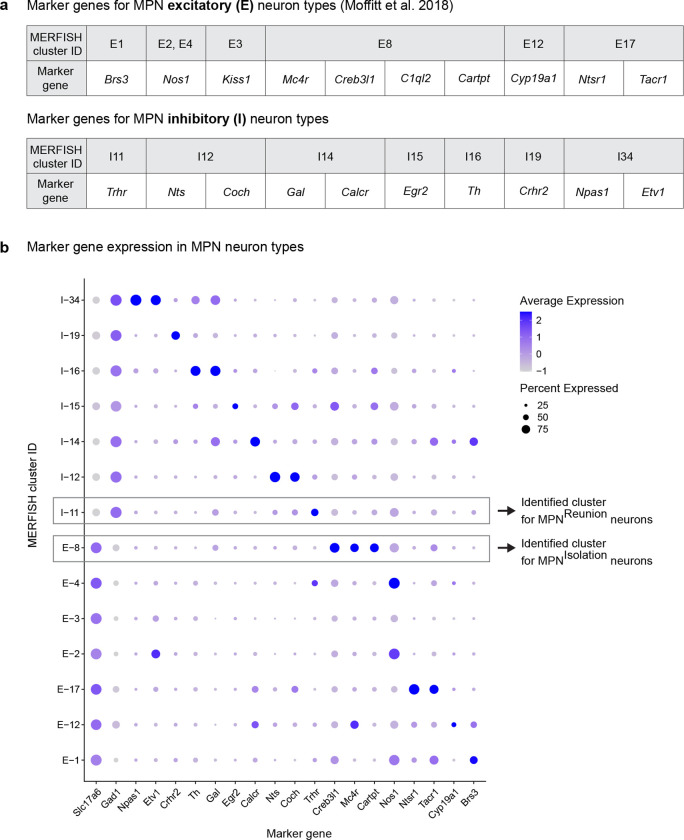
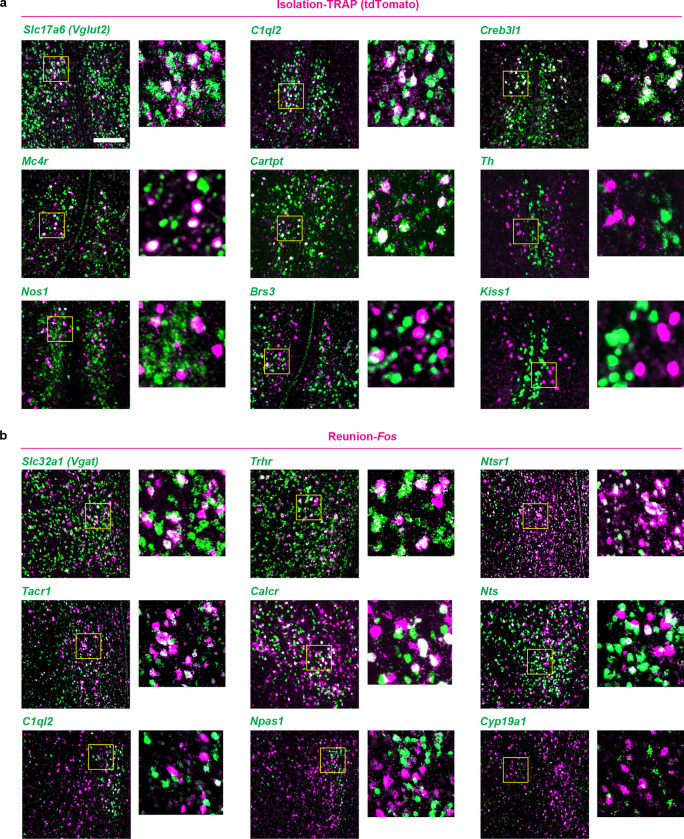
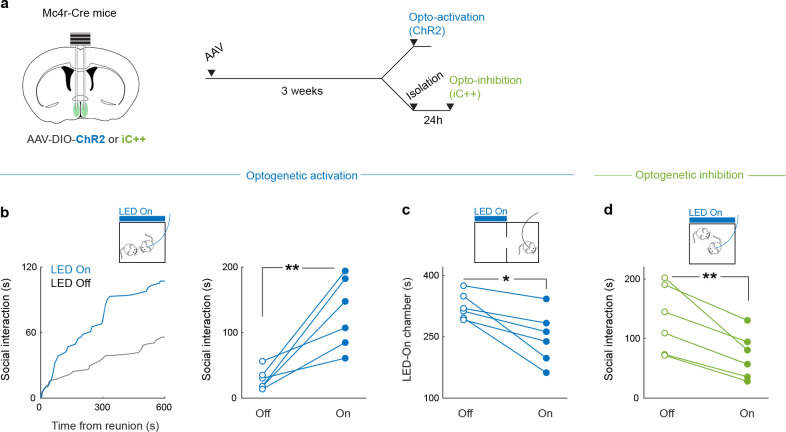
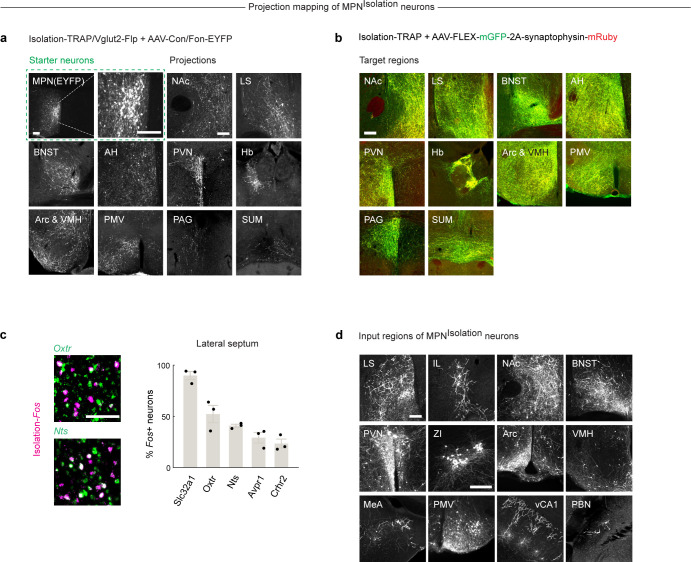
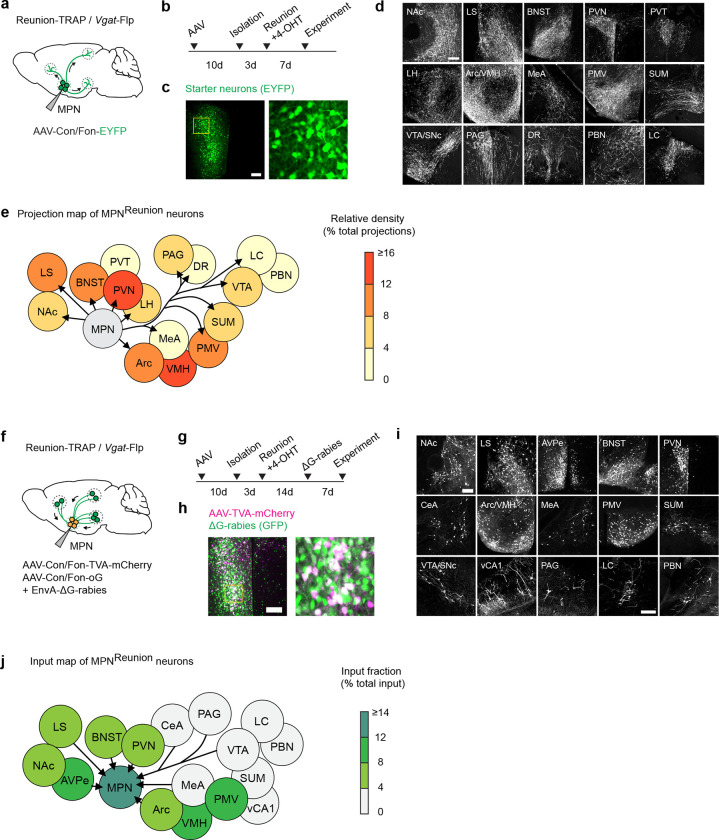
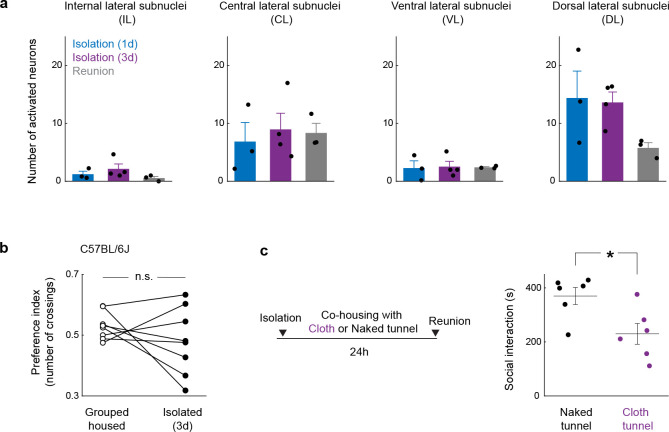
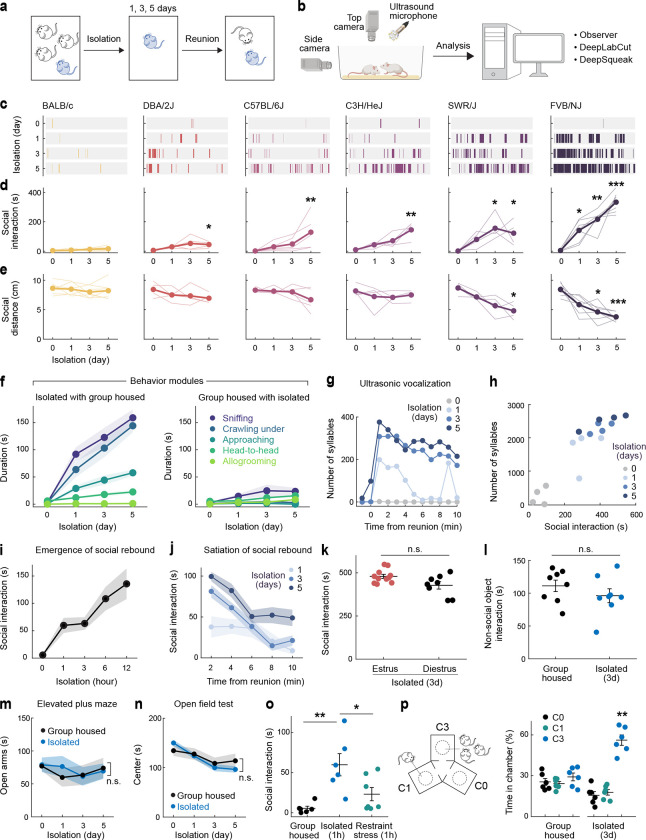
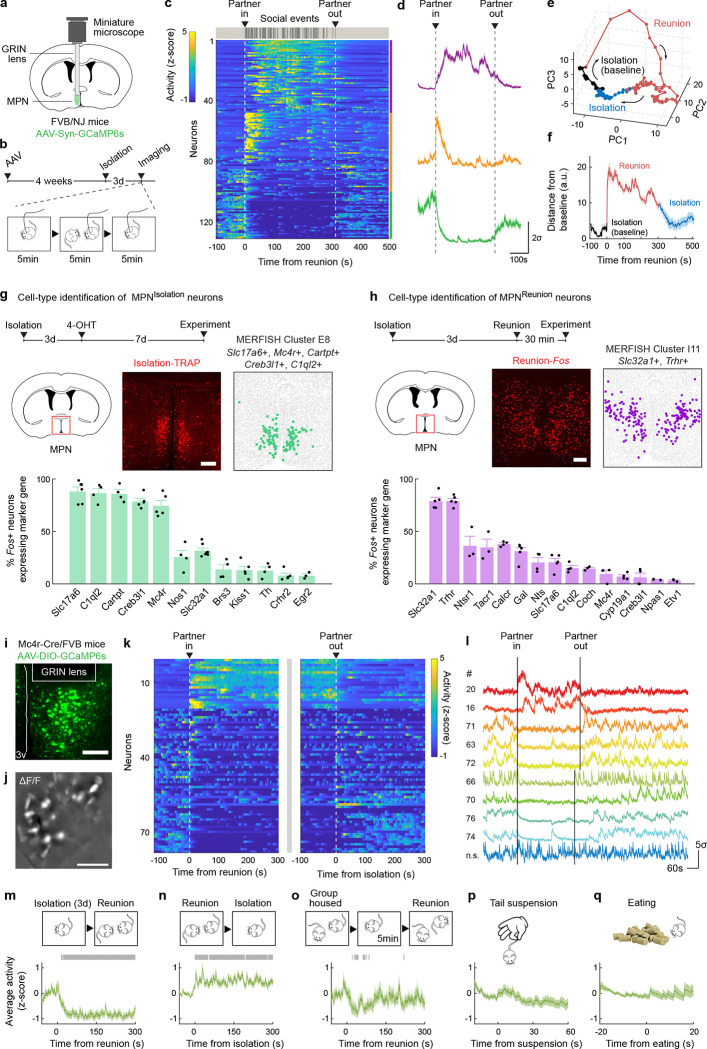
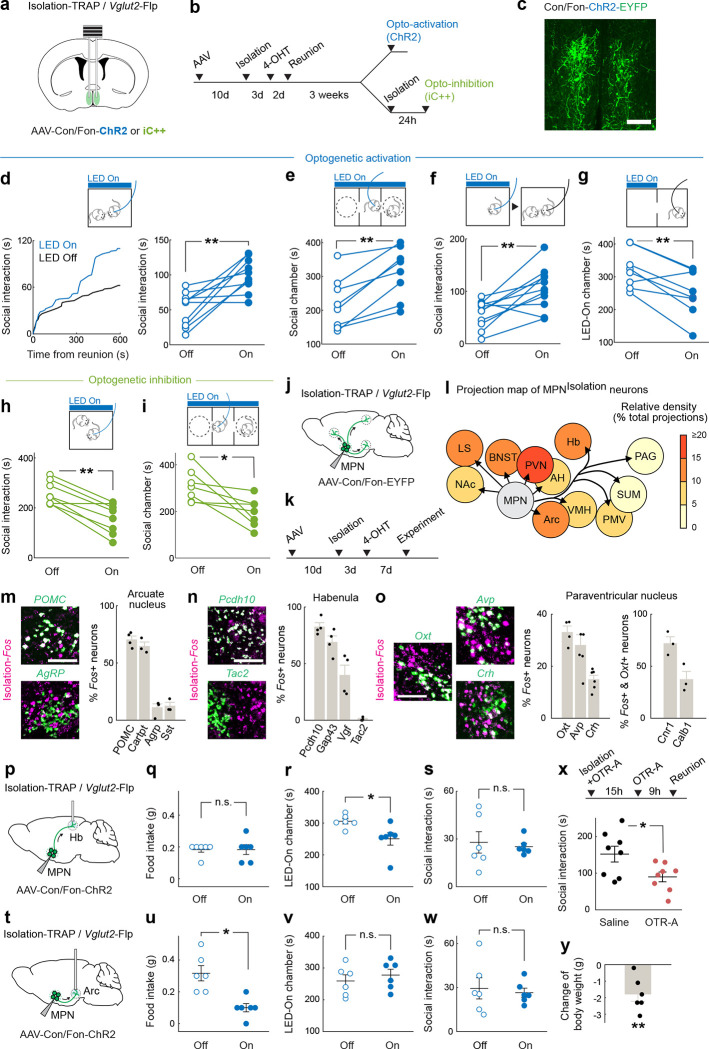
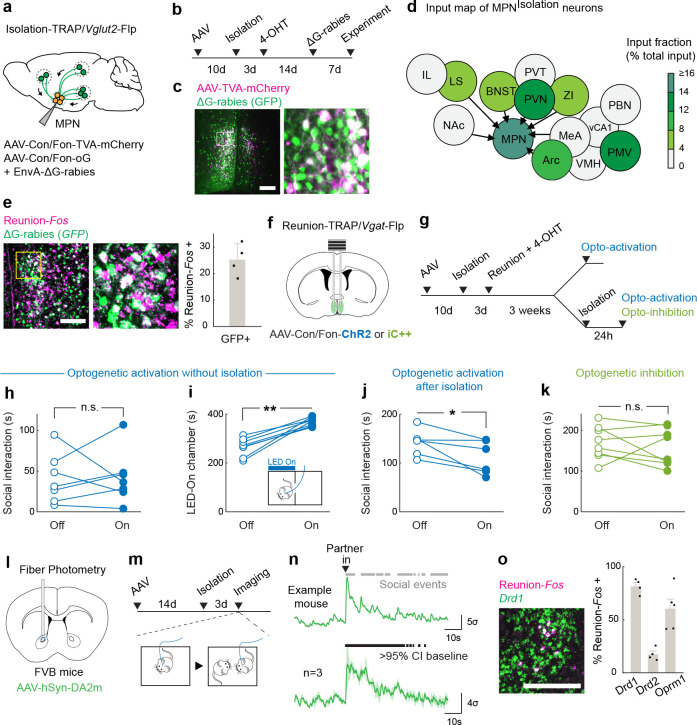
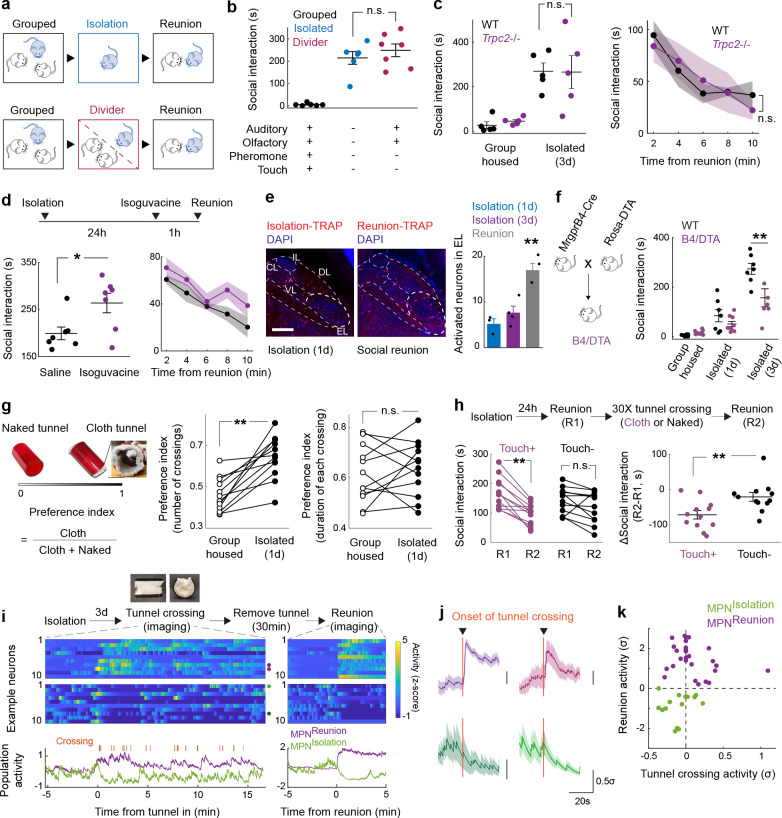
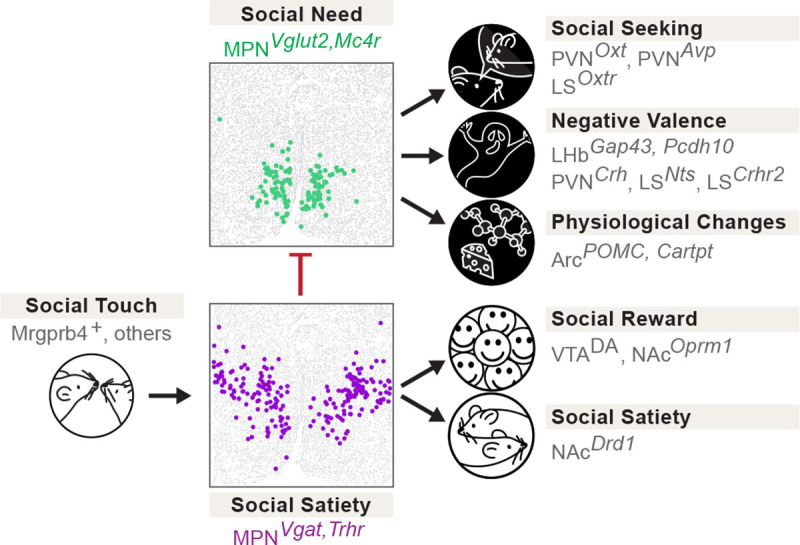
Social grouping increases survival in many species, including humans1,2. By contrast, social isolation generates an aversive state (loneliness) that motivates social seeking and heightens social interaction upon reunion3-5. The observed rebound in social interaction triggered by isolation suggests a homeostatic process underlying the control of social drive, similar to that observed for physiological needs such as hunger, thirst or sleep3,6. In this study, we assessed social responses in multiple mouse strains and identified the FVB/NJ line as exquisitely sensitive to social isolation. Using FVB/NJ mice, we uncovered two previously uncharacterized neuronal populations in the hypothalamic preoptic nucleus that are activated during social isolation and social rebound and that orchestrate the behavior display of social need and social satiety, respectively. We identified direct connectivity between these two populations of opposite function and with brain areas associated with social behavior, emotional state, reward, and physiological needs, and showed that animals require touch to assess the presence of others and fulfill their social need, thus revealing a brain-wide neural system underlying social homeostasis. These findings offer mechanistic insight into the nature and function of circuits controlling instinctive social need and for the understanding of healthy and diseased brain states associated with social context.


Conflict of interest statement

Competing interests. The authors declare no competing interests.

Figures

Extended Data Figure 1.
Extended Data Figure 1.. Behavioral characterization of social rebound.
a-c, Social interaction latency, bout number and mean bout duration during social reunion. Thin lines represent individual mice, thick lines are cohort average (BALB/c n=7, DBA/2J n=4, C57BL/6J n=5, C3H/HeJ n=4, SWR/J n=4, FVB/NJ n=7). d, Probability matrix of transitions between behavioral modules during social rebound. e, Display of specific behavioral modules in paired isolated with group housed (blue) vs group housed with isolated (black) FVB mice, n=7. f, Example ultrasonic vocalization (USV) syllables of FVB mice recorded during social reunion. g, Number of USV syllables during social reunion in FVB mice after various lengths of isolation, n=4. h, Time course of social events and USVs from example FVB mouse. i, Social rebound in FVB mice of different ages, 4–5 weeks, n=6; 6–9 weeks, n=7. j, Three-chamber preference test between cage mate and stranger, in group housed vs isolated FVB mice, n=6. k, Preference test between mice from same (FVB) or different (C57) strain, n=7. l. Social interaction in group housed and isolated wildtype (n=6) vs Pde6brd1/Pde6brd1(n=5) C57BL/6J mice. m, Social interactions in C57BL/6J (C57, n=5) and in offspring of FVB/NJ x C57BL/6J mice (F1, n=7). f, Mann–Whitney U test; h, Friedman test; j, k, Wilcoxon signed-rank tests; l, m, Mann–Whitney U test; n.s., not significant; *p<0.05, **p<0.01, ***p<0.001. All shaded areas and error bars represent the mean ± s.e.m.
Extended Data Figure 2.
Extended Data Figure 2.. Microendoscopy Calcium imaging in MPN.
a,b Second example mouse with MPN pan-neuronal calcium imaging during social isolation and social reunion, and 3 clusters of neurons displaying distinct activity patterns during reunion. c. Number of activated MPN neurons during social isolation, group housing, restraint stress (1h) and food deprivation (24h), n=3–6. Scale bar, 200μm. d. Average calcium activity of MPNMc4r+ neurons that were inhibited during reunion, n=3. e. Calcium imaging of MPNIsolation neurons in the initial phase of social isolation. Data below represent average activity across 27 neurons pooled from 2 mice. Wilcoxon signed-rank tests were used to estimate statistical significance of enhanced neuronal activity in each time bin (30s) vs the first time bin, *p<0.05, **p<0.01, ***p<0.001.
Extended Data Figure 3.
Extended Data Figure 3.. Marker genes of MPN cell types.
A, Marker genes for different MPN excitatory and inhibitory neuronal populations based on Moffitt et al. 2018. b, Expression patterns of marker genes in different MPN clusters based on MERFISH experiments. Boxes identify clusters that are best matched with MPNIsolation and MPNReunion neurons.
Extended Data Figure 4.
Extended Data Figure 4.. Cell type identification of MPNIsolation and MPNReunion neurons.
a, b Representative images of marker gene expression of distinct MPN cell-type cluster and overlap with MPNIsolation (a) and MPNReunion (b) neurons using in situ hybridization. Green: marker genes for specific neuron types, magenta: Fos expression during social isolation (a) or social reunion (b). Scale bar, 200μm (all images). Zoom-in box, 150μm × 150μm.
Extended Data Figure 5.
Extended Data Figure 5.. Optogenetic manipulation of MPNMc4r+ neurons.
a, Strategy to target MPNMc4r+ neurons for optogenetic manipulations. b-c, Behavioral effects of optogenetic activation of MPNMc4r+ neurons during social interaction and real-time place preference test, n=6. d. Behavioral effects of optogenetic inhibition of MPNMc4r+ neurons during social reunion, n=6. b-d, Wilcoxon signed-rank tests; *p<0.05, **p<0.01.
Extended Data Figure 6.
Extended Data Figure 6.. Circuit tracing from MPNIsolation neurons.
a-b, Representative images showing downstream targets of MPNIsolation neurons using intersectional (Cre/Flp, a) and TRAP (b) methods, n=2–3. All scale bars, 200μm. c, Cell type identification of LS neurons activated during isolation n=3. Scale bar, 100μm. c, Representative images of input regions of MPNIsolation neurons. Both scale bars, 200μm. Images without scale bars have same scale as LS image.
Extended Data Figure 7.
Extended Data Figure 7.. Circuit tracing from MPNReunion neurons.
a,b, Viral tracing strategy to map target brain regions of MPNReunion neurons. c, Representative images of MPNReunion starter neurons. d, Representative images of projections from MPNReunion neurons. e, Schematic summary of projections from MPNReunion neurons and relative projection density. f,g, Viral tracing strategy to map input brain regions of MPNReunion neurons. h, Representative images of MPNReunion starter neurons in retrograde tracing. i, Representative images of input regions of MPNReunion neurons. j, Schematic summary of input brain regions of MPNReunion neurons and their relative input intensity. All scale bars, 200μm. Images without scale bars in d and i have same scales as in NAc images. Abbreviations: MPN, medial preoptic nucleus. NAc, nucleus accumbens. LS, lateral septum. AVPe, anteroventral periventricular nucleus. BNST, bed nucleus of the stria terminalis. PVN, paraventricular nucleus of hypothalamus. PVT, paraventricular thalamus. LH, lateral hypothalamus. CeA, central amygdala. Arc, arcuate nucleus. VMH, ventromedial hypothalamus. MeA, medial amygdala. PMV, ventral premammillary nucleus. SUM, supramammillary nucleus. VTA, ventral tegmental area. SNc, substantia nigra pars compacta. vCA1, ventral hippocampal CA1. PAG, periaqueductal gray. DR, dorsal raphe nucleus. PBN, parabrachial nucleus. LC, locus coeruleus.
Extended Data Figure 8.
Extended Data Figure 8.. Modulation of social need by touch.
a, Quantification of activated neurons in PBN subnuclei during social isolation and reunion, n=3–4 in each condition. Kruskal-Wallis test. b, Two-choice touch preference test in C57BL/6J mouse strain. Preference index is ratio of number of crossings through cloth tunnel over total number of crossings, n=7. Wilcoxon signed-rank tests; n.s., not significant. c, Behavioral effects of co-housing with cloth or naked tunnel during isolation on reunion social interaction, n=6. Mann–Whitney U test, *p<0.05. All error bars represent the mean ± s.e.m.
Figure 1.
Figure 1.. Social rebound as behavior manifestation of social homeostasis.
a, b Short-term social isolation/reunion behavioral paradigm and analysis pipeline. c, Raster plots of social events during reunion on example mouse from each strain. d, e Total duration of social interaction and average distance between two mice (social distance) during 10 min social reunion. Thin lines represent individual mice, thick lines are cohort average (BALB/c n=7, DBA/2J n=4, C57BL/6J n=5, C3H/HeJ n=4, SWR/J n=4, FVB/NJ n=7). f, Behavioral modules displayed during social rebound by previously isolated (left) versus paired group housed FVB mice (right), n=7 pairs. g, Ultrasonic vocalization (USV) during social reunion from example FVB mouse. h, Correlation between duration of social interaction and number of USV syllables during social reunion. Each dot represents a mouse, n=4. i, Emergence of social rebound in FVB mice following increasing time in isolation, n=6. j, Satiation of social rebound after various lengths of isolation, n=7. k, Social rebound in different phases of the estrous cycle, estrus phase n=11, diestrus phase n=8. l, Investigation of non-social object in group housed versus isolated FVB mice, n=8. m, n, Elevated plus maze test (n=5) and open field test (n=9) in isolated vs group housed FVB mice. o, Social interaction in FVB mice after 1h of social isolation, n=6 or body restraint stress, n=7. p, Preference test among empty (C0), one-mouse (C1) and 3-mice chambers (C3), n=6. d, e, Friedman test between baseline (day 0) and each isolation day; k, l, o, Mann–Whitney U test; m, n, Two-way ANOVA; p, Friedman test; n.s., not significant; *p<0.05, **p<0.01, ***p<0.001. All shaded areas and error bars represent the mean ± s.e.m.
Figure 2.
Figure 2.. Identification of neuron types underlying social homeostasis.
a, Microendoscopy calcium imaging in the hypothalamic medial preoptic nucleus (MPN). b, Behavioral and calcium imaging paradigm. c, MPN pan-neuronal activity during social isolation and reunion. Heatmap of activity in example mouse, n=3 mice. d, Average activity of neuronal populations from c with distinct activity patterns during isolation and reunion. e, Principal component analysis of population activity in c. Bin size = 5s. f, Distance from each PCA time point to the mean of baseline. Bin size = 1s. g,h, Cell type identification of MPNIsolation (g) and MPNReunion (h) neurons based on overlap between activity induced Fos and expression of neuron-type marker genes, n=3–6 for each marker gene. i, Representative image showing MPNMc4r+ neurons expressing GCaMP6s. j, Example imaging field of GRIN lens, represented as ΔF/F. k, MPNMc4r+ neuronal activity during social isolation and social reunion. n=78 significantly modulated neurons pooled from 3 mice. l, Calcium activity of 10 example MPNMc4r+ neurons. m-q, Average calcium activity of reunion-inhibited MPNMc4r+ neurons in distinct behavioral regimes. Gray bars indicate significance of activity above or below 95% confidence interval of baseline. All shaded areas and error bars represent the mean ± s.e.m. unless otherwise noted. All scale bars, 200μm.
Figure 3.
Figure 3.. Functional characterization of MPNIsolation neurons.
a, Intersectional (Cre/Flp) strategy to target MPNIsolation neurons for optogenetic manipulations. b, Experimental paradigms. c, Representative image of ChR2-expressing MPNIsolation neurons. Scale bar, 200μm. d-g, Behavioral effects of optogenetic activation of MPNIsolation neurons in different conditions: real-time stimulation in social environment, n=10 (d); three-chamber social preference test (e), n=8; pre-reunion stimulation (f), n=11; and real-time conditioned place preference test (g), n=8. h-i, Optogenetic inhibition of MPNIsolation neurons during social reunion (h), n=8 and three-chamber social preference test (i), n=7. j-k, Viral tracing strategy to map projections from MPNIsolation neurons. l, Projection map of MPNIsolation neurons (NAc, nucleus accumbens. LS, lateral septum. BNST, bed nucleus of the stria terminalis. AH, anterior hypothalamus. PVN, paraventricular nucleus of hypothalamus. Hb, habenula. Arc, arcuate nucleus. VMH, ventromedial hypothalamus. PMV, ventral premammillary nucleus. PAG, periaqueductal gray. SUM, supramammillary nucleus). m-o, Identification of activated neurons in target regions of MPNIsolation neurons. m: Arc, n: Hb and o: PVN. Green: marker genes, magenta: Fos expression following social isolation, n=3–6 for each marker gene. All scale bars, 100μm. P-w Behavioral effects of optogenetic activation of MPNIsolation->Arc and MPNIsolation->Hb projections on eating, real-time place preference and social behaviors, n=6. x, Effect of oxytocin receptor antagonist injection (i.p.) during social isolation on subsequent reunion. y, Changes in mouse body weight during isolation compared to group housed controls, n=6. e-i, q-s, u-w, y, Wilcoxon signed-rank tests; x, Mann–Whitney U test; n.s., not significant; *p<0.05, **p<0.01. All error bars represent the mean ± s.e.m.
Figure 4.
Figure 4.. MPNReunion neurons modulate social satiety.
a-b, Intersectional (Cre/Flp) viral tracing strategy to map input brain regions of MPNIsolation neurons. c-d, Representative image of MPNisolation starter neurons (c) and input brain regions (d). (LS, lateral septum. IL, infralimbic cortex. NAc, nucleus accumbens. BNST, bed nucleus of the stria terminalis. PVN, paraventricular nucleus of hypothalamus. ZI, zona incerta. Arc, arcuate nucleus. VMH, ventromedial hypothalamus. MeA, medial amygdala. PMV, ventral premammillary nucleus. vCA1, ventral hippocampal CA1. PBN, parabrachial nucleus) e, Representative image and quantification of MPNReunion neurons input into MPNIsolation neurons, n=4. f-g, Intersectional (Cre/Flp) strategy to target MPNReunion neurons for optogenetic manipulations. h-j, Behavioral effects of optogenetic activation of MPNReunion neurons in different conditions: without isolation (h), n=7; after isolation (j), n=6; and real-time place preference test (i), n=7. k, Behavioral effects of optogenetic inhibition of MPNReunion neurons during social reunion, n=8. l-m, Experimental strategy to record dopamine release in NAc during social reunion. n, Dopamine release in NAc upon social reunion, n=3. Gray bars (upper) indicate social events and black bars (lower) indicate the significance of enhanced activity above 95% confidence interval (CI) of the baseline. o, Cell type identification of NAc neurons activated during reunion, n=4–5. h-k, Wilcoxon signed-rank tests; n.s., not significant; *p<0.05, **p<0.01. Shaded areas and all error bars represent the mean ± s.e.m. All scale bars, 200μm.
Figure 5.
Figure 5.. Sensory basis of social need and social satiety.
a-b, Sensory contribution to social rebound, n=6 for standard isolation, n=7 for divider experiments, “+” and “−” indicate the presence and the absence of a given sensory modality, respectively. c, Social rebound and satiation in Trpc2−/− mice, n=5. d. Total time of social interaction following isolation with acute inhibition of touch sensation following i.p. injection of isoguvacine before social reunion, n=7. e, Representative images and quantification of neuronal activity in PBN subnuclei (EL, external lateral; IL, Internal lateral; CL, central lateral; VL, ventral lateral; DL, dorsal lateral) during social isolation and social reunion, n=3–4 in each condition. Scale bar, 200μm. f, Effect of genetic ablation of Mrgprb4 neurons using DTA on total time of social interaction following various durations of isolation, n=6–8 for each condition. g, Preference of mice for crossing cloth over naked tunnels during group housing or following isolation, n=12. h, Effect of cloth or naked tunnel crossing on social rebound, n=12. i, Gentle touch modulates the activity of MPNReunion (n=27) MPNIsolation neurons (n=15), n=2 mice. Purple and green curves represent average activity of MPNIsolation and MPNReunion neurons, respectively. j, Example neurons that are activated (n=2, upper) or inhibited (n=2, lower) by cloth tunnel crossing. k, Neuronal activity (z-scored) during social reunion and cloth tunnel crossing. Dots represent single neurons. b, e, Kruskal-Wallis test; c left, d left, f, h right, Mann–Whitney U test; c right, d right, Two-way ANOVA; d left, g, h left, Wilcoxon signed-rank tests; n.s., not significant; *p<0.05, **p<0.01. All shaded areas and error bars represent the mean ± s.e.m.
Figure 6.
Figure 6.. Model: neural circuits underlying dynamic control of social need.
Gentle touch associated with social interaction leads to the activation of MPNReunion neurons, the recruitment of social reward circuits, inhibition of MPNIsolation neurons and social satiety. Conversely, absence of social touch input during isolation inactivates MPNReunion neurons and in turn dis-inhibits (activates) MPNIsolation neurons, which enhances social motivation, negative valence and other physiological functions that constitute the isolation state.

References

    1. Krause J. & Ruxton G. D. Living in groups. (Oxford University Press, 2002).
    1. Zhu P. et al. Correlated evolution of social organization and lifespan in mammals. Nat Commun 14, 372, doi:10.1038/s41467-023-35869-7 (2023). - DOI - PMC - PubMed
    1. Panksepp J. & Beatty W. W. Social deprivation and play in rats. Behavioral and neural biology 30, 197–206 (1980). - PubMed
    1. Niesink R. J. & van Ree J. M. Short-term isolation increases social interactions of male rats: a parametric analysis. Physiol Behav 29, 819–825, doi:10.1016/0031-9384(82)90331-6 (1982). - DOI - PubMed
    1. Cacioppo J. T., Cacioppo S., Capitanio J. P. & Cole S. W. The neuroendocrinology of social isolation. Annu Rev Psychol 66, 733–767, doi:10.1146/annurev-psych-010814-015240 (2015). - DOI - PMC - PubMed

References (Methods)

    1. Allen W. E. et al. Thirst-associated preoptic neurons encode an aversive motivational drive. Science 357, 1149–1155, doi:10.1126/science.aan6747 (2017). - DOI - PMC - PubMed
    1. Chung S. et al. Identification of preoptic sleep neurons using retrograde labelling and gene profiling. Nature 545, 477–481, doi:10.1038/nature22350 (2017). - DOI - PMC - PubMed
    1. Dolen G., Darvishzadeh A., Huang K. W. & Malenka R. C. Social reward requires coordinated activity of nucleus accumbens oxytocin and serotonin. Nature 501, 179–184, doi:10.1038/nature12518 (2013). - DOI - PMC - PubMed
    1. Hung L. W. et al. Gating of social reward by oxytocin in the ventral tegmental area. Science 357, 1406–1411, doi:10.1126/science.aan4994 (2017). - DOI - PMC - PubMed
    1. Gunaydin L. A. et al. Natural neural projection dynamics underlying social behavior. Cell 157, 1535–1551, doi:10.1016/j.cell.2014.05.017 (2014). - DOI - PMC - PubMed

Publication types