[Preprint]. 2024 Mar 8:2023.05.18.541379.
doi: 10.1101/2023.05.18.541379.

Neurophysiological trajectories in Alzheimer's disease progression

Affiliations

Neurophysiological trajectories in Alzheimer's disease progression

Kiwamu Kudo et al. bioRxiv. .

Update in

Abstract

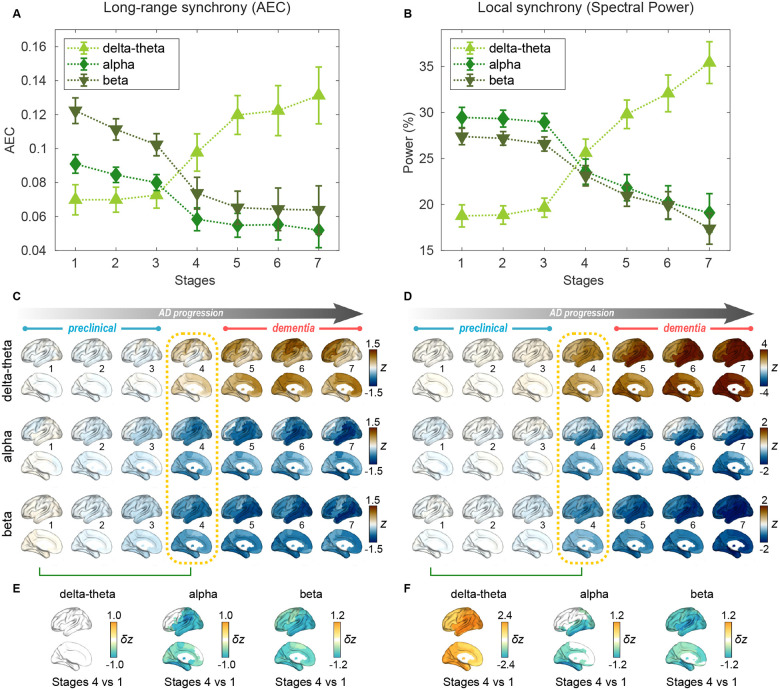
Alzheimer's disease (AD) is characterized by the accumulation of amyloid-β and misfolded tau proteins causing synaptic dysfunction, and progressive neurodegeneration and cognitive decline. Altered neural oscillations have been consistently demonstrated in AD. However, the trajectories of abnormal neural oscillations in AD progression and their relationship to neurodegeneration and cognitive decline are unknown. Here, we deployed robust event-based sequencing models (EBMs) to investigate the trajectories of long-range and local neural synchrony across AD stages, estimated from resting-state magnetoencephalography. The increases in neural synchrony in the delta-theta band and the decreases in the alpha and beta bands showed progressive changes throughout the stages of the EBM. Decreases in alpha and beta band synchrony preceded both neurodegeneration and cognitive decline, indicating that frequency-specific neuronal synchrony abnormalities are early manifestations of AD pathophysiology. The long-range synchrony effects were greater than the local synchrony, indicating a greater sensitivity of connectivity metrics involving multiple regions of the brain. These results demonstrate the evolution of functional neuronal deficits along the sequence of AD progression.


Conflict of interest statement

Competing interests K.K. and H.M. are employees of Ricoh Company, Ltd. The authors declare that no other competing interests exist. The other authors declare no competing financial conflicts of interest to disclose.

Figures

Figure 1.
Figure 1.. Atrophy-cognition EBM staging of AD progression.
(A) Histogram of PHG volume loss z-scores, zPHG. (B) Histogram of MMSE-decline z-scores, zMMSE. The z-scores for PHG volume loss and MMSE were standardized by the adjusted scores of the control group and sign-inverted so that higher z-scores denote more severity. (C) Posterior probabilities, pj(k), that a subject j belongs to a stage k evaluated by the AC-EBM. (D) The ratio of subjects classified to each stage; blue: Control (CDR 0), orange: MCI due to AD (CDR 0.5), pink: mild AD dementia (CDR 1), and red: moderate AD dementia (CDR 2). (E) Distribution of the stages in the space spanned by PHG volume loss and MMSE score. Each subject j was distinctly assigned to one of the stages with the highest posterior probability, argmaxkpj(k). The colors of the dots denote the seven stages. A star symbol denotes the probability-based weighted means of zPHG and MMSE scores at stage 4: zPHG = 1.33 (±0.258) and MMSE= 26.3 (±0.82). The values in parentheses denote the standard error (SE; Equation 5) of the weighted means. (F) Trajectories of PHG volume loss and MMSE score as a function of the seven stages. Probability-based weighted means (± SE) are shown. The initial and final z-scores used in the AC-EBM were: (zinitial, zfinal) = (−1.372, 3.804) for PHG volume loss and (−0.902, 12.712) for MMSE decline, respectively. (G) Progression of GM volume loss (z-scores) from stage 1 to 7. Regional GM atrophy in the predicted stage of MCI (stage 4) was circled with a dotted line. Figure 1—figure supplement 1. Steps for computing metric trajectories. Figure 1—figure supplement 2. An example of positional variance diagram of z-score events. Figure 1—figure supplement 3. Group comparisons of PHG volumes and MMSE scores. Figure 1—figure supplement 4. Group comparison of GM volumes.
Figure 2.
Figure 2.. Profiles of neural synchrony as a function of the AD stages estimated by AC-EBM.
(A,B) Profiles of AEC (A) and spectral power (B) as a function of the seven stages, showing probability-based weighted means (± SE). Neural synchrony increased monotonously with AD progression in the delta-theta band and decreased monotonously in the alpha and beta bands. (C,D) Regional AEC (C) and spectral power (D) as a function of the seven stages. Deviations from the neural-synchrony spatial patterns averaged over the controls are displayed. The deviations were evaluated using the probability-based weighted means of z-scores standardized by the controls. Spatial patterns in the MCI stage (stage 4) were circled with dotted lines. (E,F) Changes in neural synchrony during the preclinical stages. Regional comparisons between two stages (stages 4 vs 1) are shown based on non-parametric tests of weighted mean differences δz. Differences that exceed the threshold (q < 0.05) are displayed. There were no significant differences in long-range synchrony in the delta-theta band. Figure 2—figure supplement 1. Normalized power spectral densities for the AD and control groups. Figure 2—figure supplement 2. Group comparisons of MEG metrics. Figure 2—figure supplement 3. Frontal and temporal regions of interest.
Figure 3.
Figure 3.. Trajectories of long-range neural synchrony in delta-theta, alpha, and beta-bands from SAC-EBMs.
(A,E,I) The ratio of subjects classified to each stage. The ratio was evaluated on the basis of the probabilities that each subject will be assigned to each of the ten stages. (B,F,J) Trajectories of long-range synchrony, PHG volume loss, and MMSE score as a function of the ten stages, showing probability-based weighted means (± SE). The asterisks (*q < 0.05 and ***q < 0.001, FDR corrected) denote statistical significance in comparisons between stages 5 vs 1. All stage pairs with significant weighted mean differences are listed in Supplementary file 9. Initial and final z-scores of long-range synchrony used in the SAC-EBMs were: (zinitial, zfinal) = (−1.083, 2.811), (−1.542, 1.605), and (−1.624, 1.641) in the delta-theta, alpha, and beta bands, respectively. (C,G,K) Regional AEC along the stages. The deviations from the regional patterns of the control group are shown. The regional patterns at the onset of the MCI stage were circled with dotted lines. (D,H,L) Changes in regional patterns during the preclinical stages. Regional comparisons between two stages are shown based on non-parametric tests of weighted mean differences δz. Differences exceeding threshold (q < 0.05, FDR corrected) are displayed. The top 10 regions with significant differences are listed in Supplementary file 10. Figure 3—figure supplement 1. Event sequences and trajectories determined by SAC-EBMs. Figure 3—figure supplement 2. Positional variance diagrams of the z-score events in SAC-EBMs. Figure 3—figure supplement 3. MCMC samples of the sequence of the optimal set of z-score events in the SAC-EBM including alpha-band AEC. Figure 3—figure supplement 4. Posterior probabilities evaluated by the SAC-EBMs.
Figure 4.
Figure 4.. Trajectories of local neural synchrony in delta-theta, alpha and beta bands from SAC-EBMs.
(A,E,I) The ratio of subjects classified to each stage. (B,F,J) Trajectories of local synchrony, PHG volume loss, and MMSE score as a function of the 10 stages, showing the weighted mean (± SE). Asterisks (***q < 0.001, FDR corrected) denote statistical significance in comparisons between stages 6 vs 1. All stage pairs with significant weighted mean differences are listed in Supplementary file 11. The initial and final z-scores of local synchrony used in the SAC-EBMs were: (zinitial, zfinal) = (−1.329, 6.097), (−1.461, 2.866), and (−1.810, 2.784) in the delta-theta, alpha, and beta bands, respectively. (C,G,K) Regional spectral power along the stages. Deviations from the regional patterns of the control group are shown. The regional patterns at the onset of the MCI stages were circled with dotted lines. (D,H,L) Changes in regional patterns during the preclinical stages. Regional comparisons between two stages are shown based on nonparametric tests of weighted mean differences δz. Differences exceeding threshold (q < 0.05, FDR corrected) are displayed. The top 10 regions with significant differences are listed in Supplementary file 12.

References

    1. Ablin P, Cardoso JF, Gramfort A. Faster independent component analysis by preconditioning with Hessian approximations. IEEE Transactions on Signal Processing. 2018; 66(15):4040–4049.
    1. Ahnaou A, Moechars D, Raeymaekers L, Biermans R, Manyakov N, Bottelbergs A, Wintmolders C, Van Kolen K, Van De Casteele T, Kemp JA, Drinkenburg WH. Emergence of early alterations in network oscillations and functional connectivity in a tau seeding mouse model of Alzheimer’s disease pathology. Scientific Reports. 2017; 7(1):1–14. - PMC - PubMed
    1. Albert MS, DeKosky ST, Dickson D, Dubois B, Feldman HH, Fox NC, Gamst A, Holtzman DM, Jagust WJ, Petersen RC, Snyder PJ, Carrillo MC, Thies B, Phelps CH. The diagnosis of mild cognitive impairment due to Alzheimer’s disease: recommendations from the National Institute on Aging-Alzheimer’s Association workgroups on di-agnostic guidelines for Alzheimer’s disease. Alzheimer’s & Dementia. 2011; 7(3):270–279. - PMC - PubMed
    1. Benjamini Y, Hochberg Y. Controlling the false discovery rate: a practical and powerful approach to multiple testing. Journal of the Royal statistical society: series B (Methodological). 1995; 57(1):289–300.
    1. Briels CT, Schoonhoven DN, Stam CJ, de Waal H, Scheltens P, Gouw AA. Reproducibility of EEG functional connectivity in Alzheimer’s disease. Alzheimer’s Research & Therapy. 2020; 12:1–14. - PMC - PubMed

Publication types