[Preprint]. 2023 May 17:2023.05.17.541104.
doi: 10.1101/2023.05.17.541104.

Overlapping representations of food and social stimuli in VTA dopamine neurons

Affiliations

Overlapping representations of food and social stimuli in VTA dopamine neurons

Lindsay Willmore et al. bioRxiv. .

Update in

Abstract

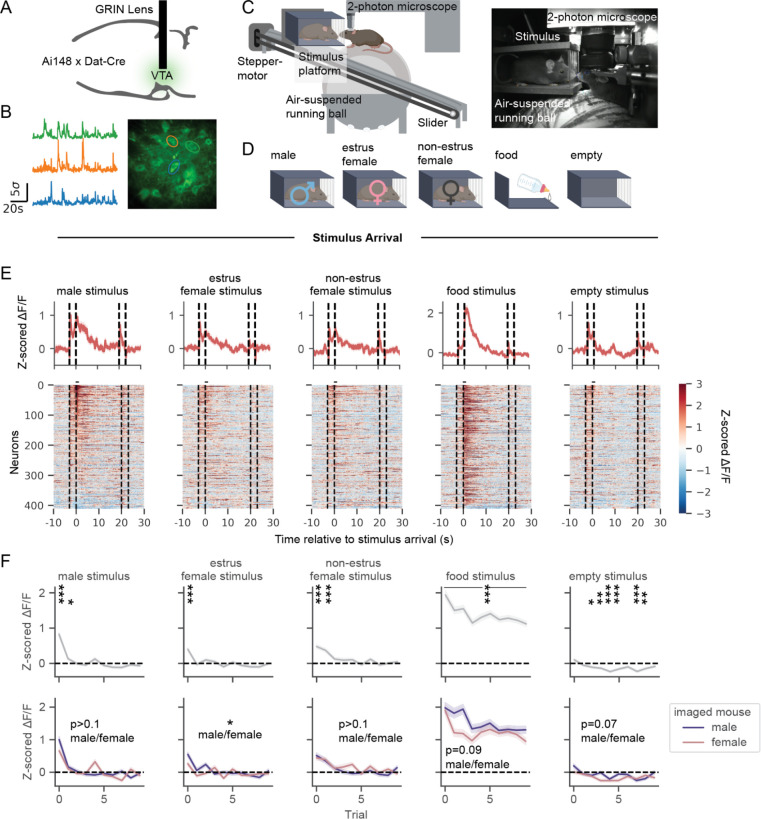
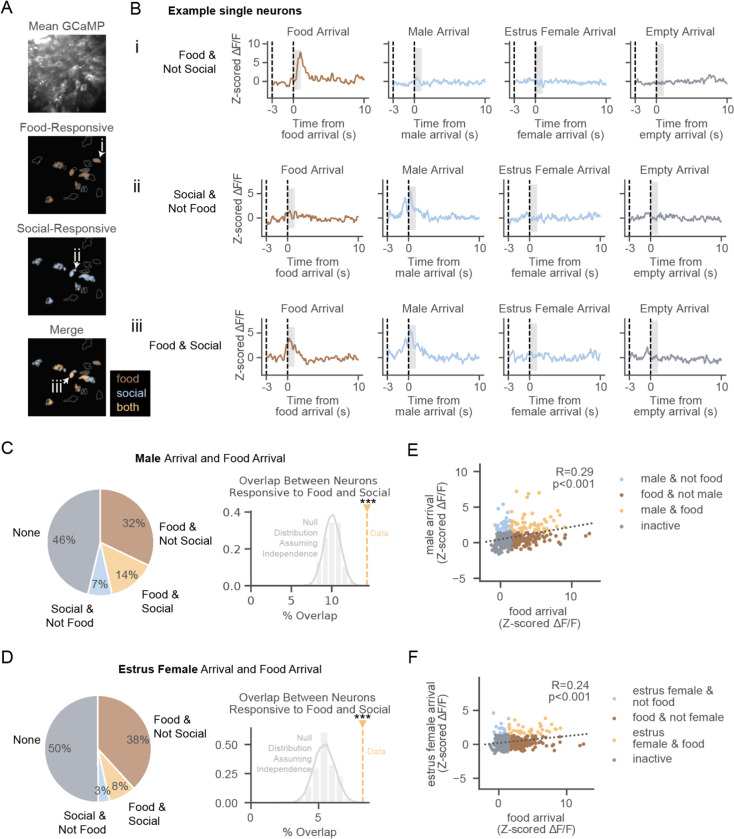
Dopamine neurons of the ventral tegmental area (VTA DA ) respond to food and social stimuli and contribute to both forms of motivation. However, it is unclear if the same or different VTA DA neurons encode these different stimuli. To address this question, we performed 2-photon calcium imaging in mice presented with food and conspecifics, and found statistically significant overlap in the populations responsive to both stimuli. Both hunger and opposite-sex social experience further increased the proportion of neurons that respond to both stimuli, implying that modifying motivation for one stimulus affects responses to both stimuli. In addition, single-nucleus RNA sequencing revealed significant co-expression of feeding- and social-hormone related genes in individual VTA DA neurons. Taken together, our functional and transcriptional data suggest overlapping VTA DA populations underlie food and social motivation.


Figures

Figure 1.
Figure 1.. VTADA neurons respond to the arrival of a conspecific, with strongest responses to males and attenuating responses across trials
(A) Schematic of surgical strategy for GRIN lens insertion over the ventral tegmental area (VTA). (B) Example GCaMP traces from neurons in an example field of view. (C) Schematic of social stimulus and food delivery mechanism to head-fixed mice undergoing two-photon calcium imaging. (D) Stimuli presented during imaging paradigm, including novel conspecifics, food (sweetened condensed milk), and an empty cage. (E) Neural activity to the first trial of each stimulus type on a single baseline imaging session (dotted lines indicate slider movement onset and offset, with arrival at t=0s and departure at t=20s). Neurons plotted in the same order across columns (N=411 neurons, 19 mice). (F) Top: Average activity in the first second after stimulus arrival across all neurons within each trial (1-sample t-test for activity different from 0, after Bonferroni correction for 50 tests). Bottom: Average activity across neurons recorded from male and female imaged mice (generalized estimating equation (GEE) (a linear model that accounts for correlated repeated measurements from each mouse over time) for average activity by trial, imaged mouse sex, and the interaction between trial and imaged mouse sex, N=199 neurons from males, 212 neurons from females). See Table S1–6 for statistics. ∗p < 0.05, ∗∗p < 0.01, ∗∗∗p < 0.001. Unless specified, data plotted as mean ± SEM.
Figure 2.
Figure 2.. Overlap in VTADA populations responsive to food and social stimuli
(A) Example field of view with neurons colored by which stimulus type they are responsive to.(N=16 neurons). (B) Examples of neural activity in the 1s after the first presentation of food or social stimuli from a neuron responsive to food, but not social stimuli, arrival (i), a neuron responsive to male, but not food, arrival (ii), and a neuron responsive to both food and male arrival (iii). Slider motor turns on at time −3s and arrives at 0s. (C) Left: Percentage of recorded neurons responsive to food arrival, male arrival, both, or neither. Tuning here and in subsequent panels is based on the mean activity in the first second after arrival (shaded region in B). Right: Overlap compared to null distribution assuming food- and male-responsive neurons are independent samples. (In C-F, N=411 neurons) (D) Same as (C) for estrus female stimulus mice. (E) Correlation between neural activity in response to food arrival and male arrival, colored by selectivity to food arrival, male arrival, or both. (F) Same as (E) for estrus female stimulus mice. See Table S11 for statistics. ∗p < 0.05, ∗∗p < 0.01, ∗∗∗p < 0.001. Unless specified, data plotted as mean ± SEM.
Figure 3.
Figure 3.. Hunger and opposite-sex experience increase fraction of VTADA neurons responsive to both food and social stimuli
(A) Cartoon representing comparison of imaging under sated (hand-fed sweetened condensed milk prior to experiment) or hungry (12–18 hr fasted) conditions (same animals, separated by 48 hrs, counterbalanced order of sated versus hungry day). (B) Example field of view across imaging sessions (sated: N=22 neurons, hungry: N=20 neurons). (C) Lick rates during food presentation (average across 20s trials, N=13 mice). (D) Distribution of change in activity in response to food from sated to hungry sessions (N=137 neurons). (E) Changes in neural tuning categories from identified cells tracked between sated and hungry sessions. (N=217 neurons) (F) Percentage of neurons responsive to food arrival, social (male and estrus female) arrival, or both on sated vs hungry sessions (error bars show standard deviation of binomial distribution, sated: N=427 neurons, hungry: N=394 neurons). (G) Cartoon representing comparison of imaging before and after freely moving opposite sex experience. (H) Example field of view across imaging sessions (before: N=34 neurons, after: N=35 neurons). (I) USV syllable counts while males are presented with female stimuli after versus before opposite sex experience (y-axis log scale, 5 out of 5 males increased in USVs detected during female trials). (J) In neurons that are food-responsive (before or after opposite sex experience), distribution of change in activity in response to opposite-sex arrival (N=95 neurons). (K) Changes in neural tuning (responsive to food arrival, opposite-sex arrival, both, or neither) before versus after opposite sex interaction (N=227 neurons). (L) Comparison of percentage of neurons responsive to food arrival, opposite-sex arrival, food and opposite-sex arrival, same-sex arrival, and food and same-sex arrival both before versus after freely moving opposite-sex interactions (error bars show stdev of binomial distribution, before: N=321 neurons, after: N=306 neurons). See Table S17 for statistics. ∗p < 0.05, ∗∗p < 0.01, ∗∗∗p < 0.001. Unless specified, data plotted as mean ± SEM.
Figure 4.
Figure 4.. snRNA-seq reveals changes in excitability-related genes in VTADA neurons with hunger, as well as widespread and overlapping expression of feeding- and social-behavior related genes.
(A) snRNA-seq pipeline includes tissue collection, nuclei isolation (dissociation and gradient centrifugation), library preparation, and sequencing. (B) Volcano plots showing genes significantly differentially expressed in nuclei from sated versus hungry animals across neuronal subtypes (dopamine, left; GABA, middle; glutamate, right; see Table S5 24 for genes and statistics). (C) Representative calcium traces from three neurons recorded on sated and hungry days (red dots indicate transients). (D) Average transient rate in neurons recorded on sated and hungry days (N=218 neurons). (E) Uniform approximation and projection (UMAP) of Slc6a3- or Th-expressing (dopamine nuclei) neuron subclusters in mouse VTA. (N=14,208 nuclei). (F) Heatmap showing expression of the top marker genes for each dopamine neuron subcluster as well as feeding and social hormone-related genes across subclusters. (G) UMAP of dopamine nuclei colored by expression level of Insr (see Table S25 for description of gene). (H) UMAP of dopamine nuclei colored by expression of Ar (see Table S25 for description of gene). (I) UMAP of dopamine nuclei, where nuclei are colored whether they express both Insr and Ar. (J) Percentage of dopamine nuclei expressing Insr, Ar, both, or neither (top). True percentage of dopamine nuclei co-expressing both Insr and Ar (yellow line) compared to a null distribution assuming the nuclei expressing each are independent samples (bottom). (K) Matrix showing the level of co-expression (compared to chance, assuming the nuclei expressing each gene are independent samples) of each food/social gene pair in dopamine nuclei. Horizontal break separates social-related hormone receptors (top) and enzymes (bottom). Vertical break separates feeding-related hormone receptors (left) and enzymes (right). (L) Percentage of gene pairs overlapping more than chance (based on comparison to null distribution constructed as described above) across neuron subtypes. See Table S24–S28 for statistics and gene lists. ∗p < 0.05, ∗∗p < 0.01, ∗∗∗p < 0.001 unless otherwise specified.

References

    1. Abizaid Alfonso, Liu Zhong-Wu, Andrews Zane B., Shanabrough Marya, Borok Erzsebet, Elsworth John D., Roth Robert H., et al. 2006. “Ghrelin Modulates the Activity and Synaptic Input Organization of Midbrain Dopamine Neurons While Promoting Appetite.” The Journal of Clinical Investigation 116 (12): 3229–39. - PMC - PubMed
    1. Adkins-Regan Elizabeth. 2009. “Neuroendocrinology of Social Behavior.” ILAR Journal / National Research Council, Institute of Laboratory Animal Resources 50 (1): 5–14. - PubMed
    1. Adriaenssens Alice E., Biggs Emma K., Darwish Tamana, Tadross John, Sukthankar Tanmay, Girish Milind, Joseph Polex-Wolf, et al. 2019. “Glucose-Dependent Insulinotropic Polypeptide Receptor-Expressing Cells in the Hypothalamus Regulate Food Intake.” Cell Metabolism. 10.1016/j.cmet.2019.07.013. - DOI - PMC - PubMed
    1. Ahima R. S., Prabakaran D., Mantzoros C., Qu D., Lowell B., Maratos-Flier E., and Flier J. S.. 1996. “Role of Leptin in the Neuroendocrine Response to Fasting.” Nature 382 (6588): 250–52. - PubMed
    1. Anderegg Angela, Poulin Jean-Francois, and Awatramani Rajeshwar. 2015. “Molecular Heterogeneity of Midbrain Dopaminergic Neurons--Moving toward Single Cell Resolution.” FEBS Letters 589 (24 Pt A): 3714–26. - PMC - PubMed

Publication types