[Preprint]. 2023 May 24:2023.05.23.541792.
doi: 10.1101/2023.05.23.541792.

Endogenous pathology in tauopathy mice progresses via brain networks

Affiliations

Endogenous pathology in tauopathy mice progresses via brain networks

Denise M O Ramirez et al. bioRxiv. .

Update in

Abstract

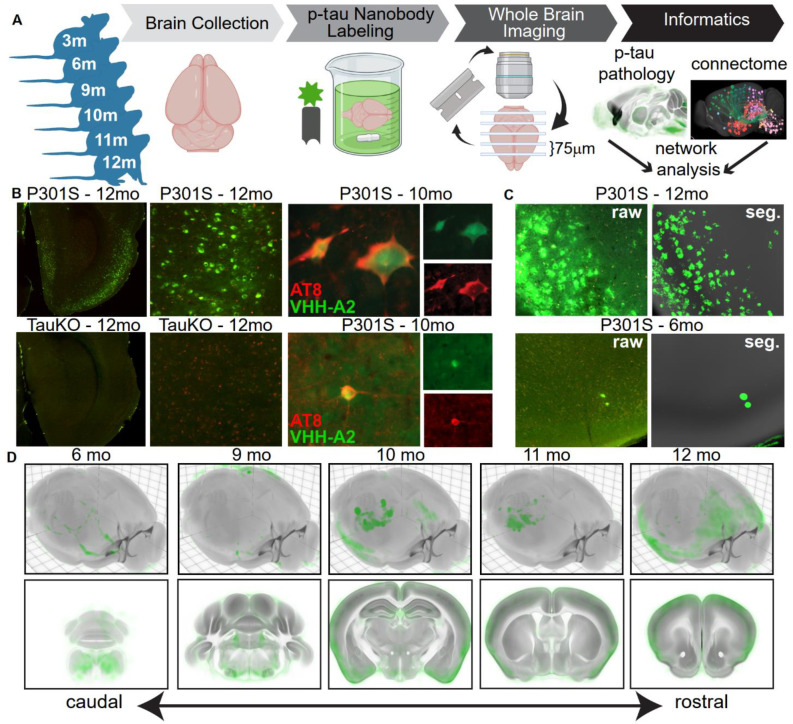
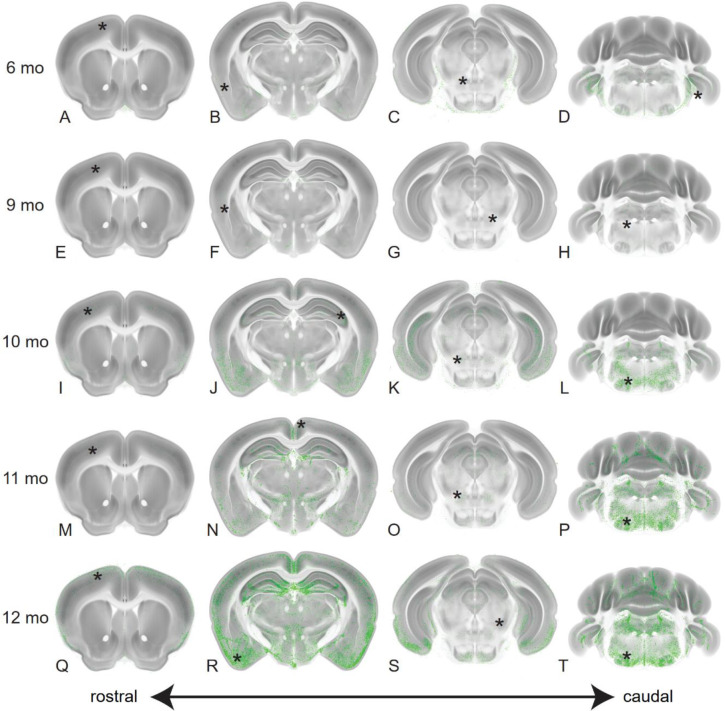
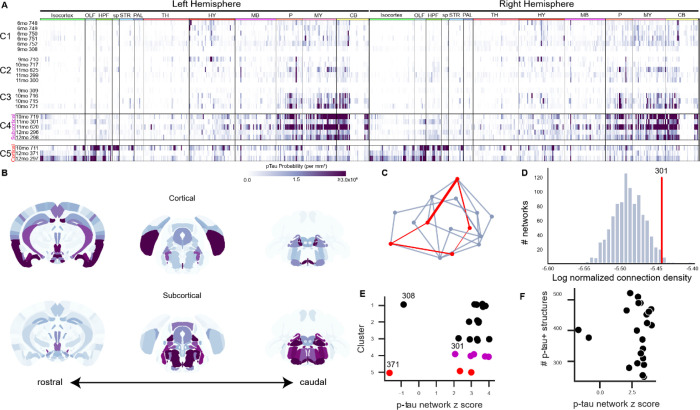
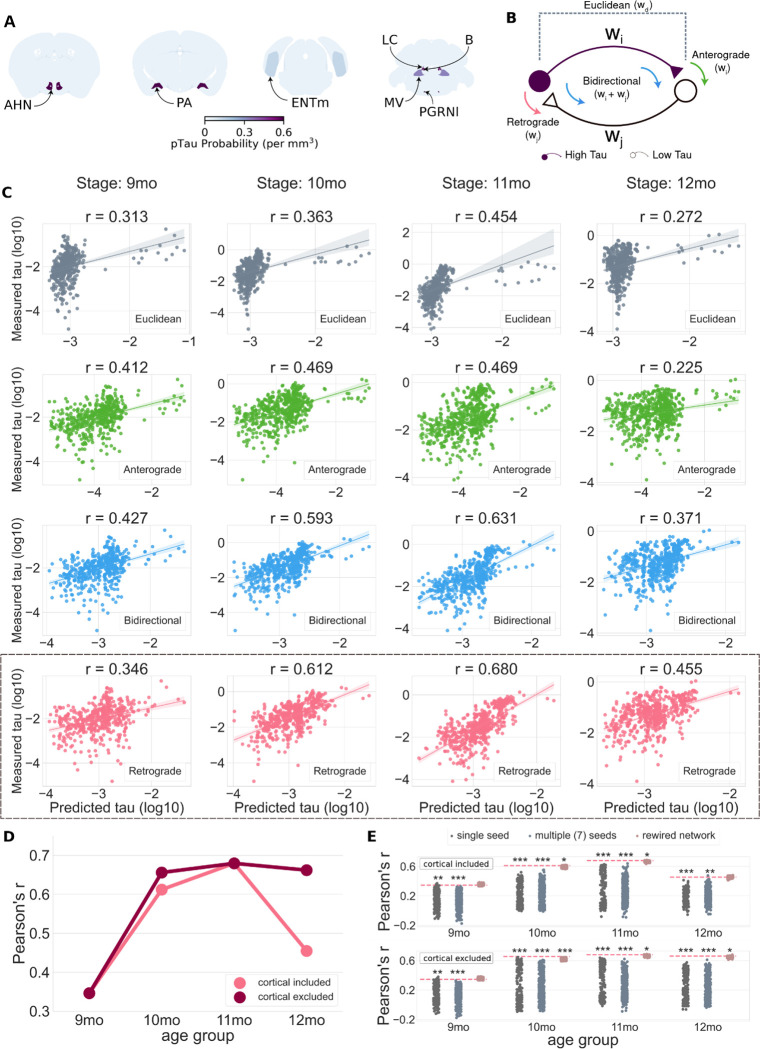
Neurodegenerative tauopathies are hypothesized to propagate via brain networks. This is uncertain because we have lacked precise network resolution of pathology. We therefore developed whole-brain staining methods with anti-p-tau nanobodies and imaged in 3D PS19 tauopathy mice, which have pan-neuronal expression of full-length human tau containing the P301S mutation. We analyzed patterns of p-tau deposition across established brain networks at multiple ages, testing the relationship between structural connectivity and patterns of progressive pathology. We identified core regions with early tau deposition, and used network propagation modeling to determine the link between tau pathology and connectivity strength. We discovered a bias towards retrograde network-based propagation of tau. This novel approach establishes a fundamental role for brain networks in tau propagation, with implications for human disease.


Conflict of interest statement

Competing interests: Authors declare that they have no competing interests.

Figures

Fig. 1.
Fig. 1.. Whole brain imaging and analysis of nanobody-stained p-tau pathology.
(A) Schematic of experimental workflow. Twenty-three PS19 mice were sacrificed at ages 3, 6, 9, 10, 11, or 12mo and immunostained with VHH-A2-488. The brains were subjected to STPT, generating a library of 3-dimensional whole-brain images of spontaneous p-tau deposition. A custom informatics workflow incorporating supervised machine learning-based pixel classification and registration into the CCFv3.0 was used to quantify p-tau accumulation across the cohort. Network diffusion modeling was used to compare the patterns of brain-wide spontaneous tau pathology to structural brain networks. (B) Upper left, p-tau staining in a section from entorhinal cortex (ENT) of a 12mo PS19 mouse brain and enlarged to show p-tau neuronal morphology. Lower left, staining of 12mo TauKO brains with VHH-A2-488 did not produce neuronal signal. Green = VHH-A2-488 positive p-tau deposits, Red = tissue autofluorescence. Upper and lower right, co-staining of AT8 (red), a canonical marker for p-tau, and VHH-A2-488 (green) showed consistent examples of double labeled neurons. (C) Image taken from piriform cortex (PIR) of PS19 animals stained with VHH-A2-488 at 12mos (upper panels) or 6mos (lower panels). Left side shows raw fluorescence images (VHH-A2-488 in green) and right side shows the corresponding probability map outputs of the same region (segmented p-tau signal in green and atlas template in grey). (D) Average brain-wide p-tau distribution in PS19 mice in each age group (6, 9, 10, 11, and 12mos). P-tau probabilities are shown in green and the CCF average template in grey. Top, 3D renderings of the whole average brain from a dorsal oblique view. Bottom, Coronal planes of the 12mo average brain spanning the rostro-caudal extent of the brain. Accumulation of p-tau is visible across many brain regions, notably brainstem, hippocampus and cortex, and these regions exhibited a high p-tau burden in 12mo animals. Number of brains averaged for each age group: 6mo, n=5; 9mo, n=3; 10mo, n=6; 11mo, n=5; 12mo, n=4.
Fig. 2.
Fig. 2.. P-tau pathology initiates caudally and progresses rostrally.
We show maximum intensity projections (MIP) of p-tau probability maps in each age group at selected anatomical levels. Four coronal sections spanning the rostro-caudal extent of the brain at the levels of the anterior cortex, dorsal hippocampus, midbrain and cerebellum are shown for brains of the indicated ages (6mo = Panels A-D; 9mo = Panels E-H; 10mo = Panels I-L; 11mo = Panels M-P; 12mo = Panels Q-T). P-tau probabilities are shown in green and the CCF average template in grey. The total numbers of brains in the dataset in each age group (6mo, n= 5; 9mo, n= 3, 10mo, n= 6; 11mo, n= 5; 12mo, n= 4) were used to generate MIP images of each physical section. Progressive accumulation of p-tau was visible across many brain regions, notably brainstem, hippocampus and ventral cortical areas including entorhinal (ENT), cortical amygdala (COA) and piriform (PIR) regions. Asterisks on each section indicate the location of the corresponding enlarged images shown in Fig. S2.
Fig. 3.
Fig. 3.. Patterns of spontaneous p-tau pathology match structural connectivity.
(A) Raster plots showing automated quantification of region-normalized p-tau probability levels in each of the 630 structures annotated in the Allen Institute CCFv3. Displayed values were truncated at 3×10⁶ to visualize lower-intensity regions. Clustering based on brain-wide patterns of pathology identified progressive accumulation of p-tau in a predominantly subcortical pattern (C1-C4), but a subset of three brains exhibited an alternate pattern with heavier pathology in cortical regions (C5). Both “Subcortical” (C4) and “Cortical” (C5) clusters of brains with high p-tau burdens were composed of aged mice (10-12mo). Labels across the top indicate major brain divisions. Abbreviations: OLF: Olfactory areas; HPF: Hippocampal formation; sp: Cortical subplate; STR: Striatum; PAL: Pallidum; TH: Thalamus; HY: Hypothalamus; MB: Midbrain; P: Pons; MY: Medulla; CB: Cerebellum. (B) Maps showing the spatial pattern of p-tau pathology by annotated brain region. Median values are shown for n=3 brains with pronounced Cortical pathology patterns and n=5 brains with Subcortical pathology (indicated by boxes in A). Coronal sections at the levels of the hippocampus (left), midbrain (center), and brainstem (right) are shown for each pattern. Heatmap is the same as A. (C) Schematic of method used to evaluate whether p-tau levels were related to connectivity. For each brain, the set of regions (nodes) that contained p-tau signal (red points) were identified and the sum of the anatomical connection strength between regions was calculated by summing all the edges in this graph (red lines). Inter-regional connection strength values came from the regionalized voxel model in Knox et al. (33). The strengths of all the connections in this network were summed and compared to results of 1000 alternative networks drawn from the same brain-wide connectivity matrix and containing a similar distribution of inter-regional distances (blue-gray lines). (D) Histogram of the total connection strength of 1000 alternative networks (blue bars) compared to the connection strength of observed a representative p-tau positive network from Sample 301 (red line). The structures positive for p-tau in Sample 301 had a total connection density of ~3.5×10⁻⁶, which is higher than ~98% of the possible networks that could be formed with a similar distance distribution. (E) In most brains, p-tau positive structures were more highly connected than expected by chance, as indicated by their network z scores. There was no relationship between the cluster assignments in panel A and the connectivity strength of the corresponding p-tau positve networks (compare along y-axis), or between cortical-dominant or subcortical-dominant p-tau patterns and network connection strength (compare red points and magenta points). There was no obvious similarity between the two brains that showed lower connection strength in their p-tau positive networks (308 and 371). (F) There was no relationship between the number of p-tau positive structures in a brain and network connection strength.
Fig. 4.
Fig. 4.. Brain networks defined with the retrograde connectome best predict spread of pathology.
(A) Regions with p-tau signal in 6mo brains were identified as seed structures. Abbreviations: AHN = Anterior hypothalamic nucleus; PA = Posterior amygdala nucleus; ENTm = medial entorhinal cortex; LC = Locus ceruleus; B = Barrington’s nucleus; MV = Medial vestibular nucleus; PGRNl = Paragigantocellular reticular nucleus, lateral part. Heatmap shows the mean density of p-tau signal in each region in n=5, 6mo brains. (B) Potential mechanisms for tau spread. Neurons in structures send anterograde projections to neurons in other areas and receive projections from neurons in other areas. For simplicity, only two neurons are shown in the diagram representing cells in a region with high p-tau burden (purple) and its one neighboring structure with relatively low p-tau burden (white). If tau spreads in an anterograde direction, the amount of spread should be related to the strength of the anterograde projection (w_i) from the high p-tau region to its low p-tau neighbor(s). If tau spreads in a retrograde direction, the amount of spread should be related to the strength (w_j) of the input from the low p-tau neighbor(s) to the high p-tau region. If tau spreads in both directions, its propagation should be related to the sum of the anterograde and retrograde connection weights. If tau propagation is driven by Euclidean distance, the amount of spread should be related to the distance between regions, not the weight of their anterograde or retrograde connections. (C) Measured levels of p-tau (log scale) plotted as a function of the tau pathology predicted from propagation models based on Euclidean distance between regions (gray), anterograde connection strength (green), bidirectional connection strength (blue), and retrograde connection strength (pink). Each point represents one region from the Allen Institute CCFv3. Pearson’s r values are reported for each model-age group combination. The outliers on the right side of each scatter plot denote the seed structures. (D) Comparison of retrograde model with and without the three brains with the cortical pattern of pathology (Fig. 3A). The model predictions improved at 10 and 12mo when three brains with the cortical pathology pattern were excluded from the analysis. (E) Model performance compared to three sets of null models to evaluate specificity of seed regions and the retrograde network connections for cohorts with (top) and without (bottom) brains with the cortical pathology pattern. The null models included predictions from 315 single seeds (i.e., individual regions, dark-gray), 500 alternate combinations of 7 regions (light-gray), and 500 rewired network configurations that preserved higher-order (i.e., node degree sequence) graph statistics (pink). Each dot represents the performance of one iteration of the null model, while the horizontal dashed line specifies the performance of the proposed model that was statistically compared to the performance of the null models. Significance notation: * P<0.05, **P<0.01, ***P<0.001).

References

    1. Lee V. M., Goedert M., Trojanowski J. Q., Neurodegenerative tauopathies. Annu Rev Neurosci 24, 1121–1159 (2001). - PubMed
    1. Frost B., Jacks R. L., Diamond M. I., Propagation of tau misfolding from the outside to the inside of a cell. J Biol Chem 284, 12845–12852 (2009). - PMC - PubMed
    1. Holmes B. B., Furman J. L., Mahan T. E., Yamasaki T. R., Mirbaha H., Eades W. C., Belaygorod L., Cairns N. J., Holtzman D. M., Diamond M. I., Proteopathic tau seeding predicts tauopathy in vivo. Proc Natl Acad Sci U S A 111, E4376–4385 (2014). - PMC - PubMed
    1. Clavaguera F., Bolmont T., Crowther R. A., Abramowski D., Frank S., Probst A., Fraser G., Stalder A. K., Beibel M., Staufenbiel M., Jucker M., Goedert M., Tolnay M., Transmission and spreading of tauopathy in transgenic mouse brain. Nat Cell Biol 11, 909–913 (2009). - PMC - PubMed
    1. Koshy S. M., Kincaid A. E., Bartz J. C., Transport of Prions in the Peripheral Nervous System: Pathways, Cell Types, and Mechanisms. Viruses 14, (2022). - PMC - PubMed

Publication types