[Preprint]. 2023 May 24:2023.05.23.541898.
doi: 10.1101/2023.05.23.541898.

PfAP2-MRP DNA-binding protein is a master regulator of parasite pathogenesis during malaria parasite blood stages

Affiliations

PfAP2-MRP DNA-binding protein is a master regulator of parasite pathogenesis during malaria parasite blood stages

Amit Kumar Subudhi et al. bioRxiv. .

Update in

  • DNA-binding protein PfAP2-P regulates parasite pathogenesis during malaria parasite blood stages.
    Subudhi AK, Green JL, Satyam R, Salunke RP, Lenz T, Shuaib M, Isaioglou I, Abel S, Gupta M, Esau L, Mourier T, Nugmanova R, Mfarrej S, Shivapurkar R, Stead Z, Rached FB, Ostwal Y, Sougrat R, Dada A, Kadamany AF, Fischle W, Merzaban J, Knuepfer E, Ferguson DJP, Gupta I, Le Roch KG, Holder AA, Pain A. Subudhi AK, et al. Nat Microbiol. 2023 Nov;8(11):2154-2169. doi: 10.1038/s41564-023-01497-6. Epub 2023 Oct 26. Nat Microbiol. 2023. PMID: 37884813 Free PMC article.

Abstract

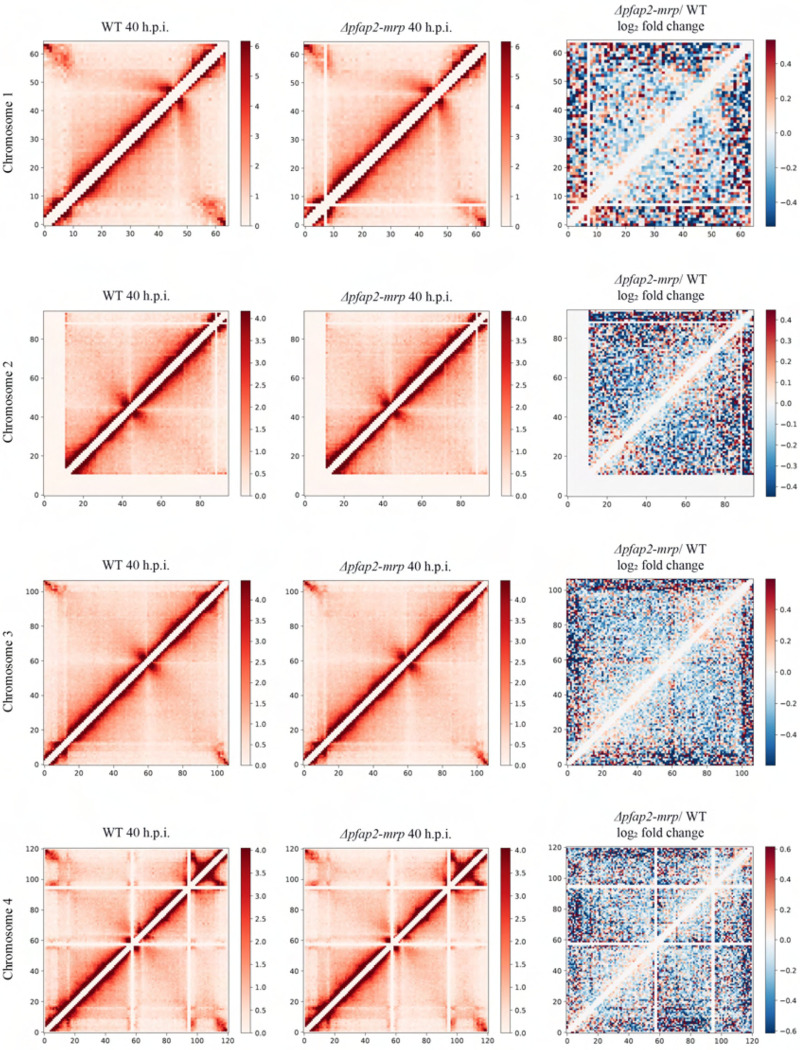
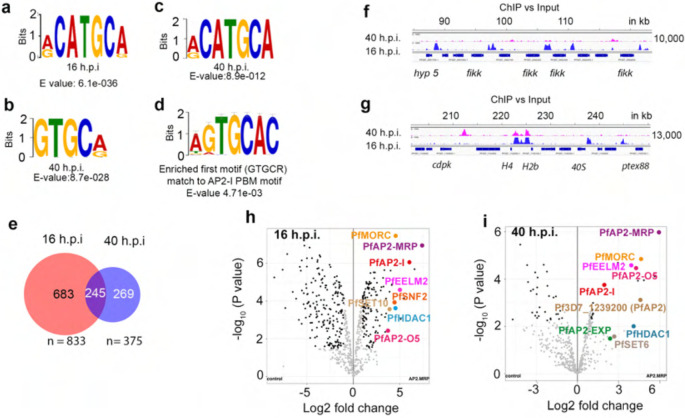
Malaria pathogenicity results from the parasite's ability to invade, multiply within and then egress from the host red blood cell (RBC). Infected RBCs are remodeled, expressing antigenic variant proteins (such as PfEMP1, coded by the var gene family) for immune evasion and survival. These processes require the concerted actions of many proteins, but the molecular regulation is poorly understood. We have characterized an essential Plasmodium specific Apicomplexan AP2 (ApiAP2) transcription factor in Plasmodium falciparum (PfAP2-MRP; Master Regulator of Pathogenesis) during the intraerythrocytic developmental cycle (IDC). An inducible gene knockout approach showed that PfAP2-MRP is essential for development during the trophozoite stage, and critical for var gene regulation, merozoite development and parasite egress. ChIP-seq experiments performed at 16 hour post invasion (h.p.i.) and 40 h.p.i. matching the two peaks of PfAP2-MRP expression, demonstrate binding of PfAP2-MRP to the promoters of genes controlling trophozoite development and host cell remodeling at 16 h.p.i. and antigenic variation and pathogenicity at 40 h.p.i. Using single-cell RNA-seq and fluorescence-activated cell sorting, we show de-repression of most var genes in Δpfap2-mrp parasites that express multiple PfEMP1 proteins on the surface of infected RBCs. In addition, the Δpfap2-mrp parasites overexpress several early gametocyte marker genes at both 16 and 40 h.p.i., indicating a regulatory role in the sexual stage conversion. Using the Chromosomes Conformation Capture experiment (Hi-C), we demonstrate that deletion of PfAP2-MRP results in significant reduction of both intra-chromosomal and inter-chromosomal interactions in heterochromatin clusters. We conclude that PfAP2-MRP is a vital upstream transcriptional regulator controlling essential processes in two distinct developmental stages during the IDC that include parasite growth, chromatin structure and var gene expression.


Figures

Extended Data Fig. 1|
Extended Data Fig. 1|. pfap2-mrp knockout affects merozoite development
a, Expression of pfap2-mrp (thick black line) and the top 40 down-regulated genes (grey lines) in P. falciparum line II3 over a 48-hour IDC. b, The primary structure of PfAP2-MRP, with a nuclear localization signal (NLS) and a single AP2 DNA binding domain. Both NLS and DNA binding domain are encoded by exon 2 of the gene. c, A phylogenetic distribution of AP2 genes in the genus Plasmodium and related alveolates. d, RNA-seq data from different IDC time-points mapped to the pfap2-mrp locus; there is a drastic reduction in RNA-seq reads mapping to the second exon 16 hours after the addition of rapamycin i.e. at 20 h.p.i. e, Schematic showing rapamycin treatment schedule to disrupt either first or second peak of pfap2-mrp expression. f, The different developmental stages of the Compound 2- and RAPA-treated parasites (at 49 h.p.i.); 50 randomly selected iRBCs from each group were inspected and the parasites were categorized as either mature schizont, segmenter or dead.
Extended Data Fig. 2|
Extended Data Fig. 2|. Disruption of pfap2-mrp deregulates malaria pathogenesis-associated genes.
a-b, Volcano plots showing significantly differentially expressed genes in rapamycin-treated compared to control parasites at 16 h.p.i. (a) and 40 h.p.i. (b). c, Non-differentially expressed genes in treated [RAPA (+)] compared to control [RAPA (−)] parasites at 40 h.p.i., which had been reported to express at least 4-fold higher in schizont-stage parasites (> 35 h.p.i.) compared to early-stage parasites (< 35 h.p.i.). d, Expression of members of the gene families: rifin, stevor and Pfmc-2tm at 16 h.p.i.that encode antigenically variant proteins. e, Gene-ontology (GO) enrichment analysis of all genes down-regulated in rapamycin-treated compared with control parasites at 40 h.p.i. Shown is the number of genes down-regulated in treated parasites out of the total number of genes assigned to that specific GO term. f, Heatmap of the expression of all known and putative P. falciparum kinases downregulated following rapamycin treatment compared to controls, at 40 h.p.i. g, Violin plots of all surfin, rifin, stevor and pfmc-2tm expression per cell in treated [RAPA (+)] and control [RAPA (−)] parasites at 16 h.p.i.. h, FACS gating strategy for surface PfEMP1 expression detected by IgG binding from pooled serum of malaria-infected individuals. Cells were incubated either without (HS−) or with (HS+) pooled serum from malaria-infected individuals. The percentage of Human IgG+ iRBCs is the mean of three biological replicates. A total of 7,500 Sybr green positive events (iRBCs) per sample were analyzed.
Extended Data Fig. 3|
Extended Data Fig. 3|. PfAP2-MRP is a repressor of early gametocyte marker genes.
a, Gene ontology enrichment analysis of up-regulated genes in Δpfap2-mrp parasites at 40 h.p.i. b, Differential expression in Δpfap2-mrp parasites at 40 h.p.i. and 16 h.p.i. of genes that are known or putative early gametocyte markers. c, Differential expression of selected genes in RAPA-treated and control parasites measured using qRT-PCR, to validate RNA-seq data.
Extended Data Fig. 4|
Extended Data Fig. 4|. PfAP2-MRP binds to the putative promoter regions of var genes.
a, Enrichment of PfAP2-MRP bound reads (from replicate 1) around the ± 5 kb region of peak summits, from 16 h.p.i. (left panel) and 40 h.p.i. (right panel) parasite samples. b, The position of ChIP-seq peak summits (common between two biological replicates) relative to the predicted ATG translational start codon, in 16 h.p.i. (red) and 40 h.p.i. (blue) parasites. c, Three independent PfAP2-MRP ChIP experiments followed by qPCR, were performed to validate ChIP-seq data, using selected PfAP2-MRP-bound promoter regions of genes from samples at 40 h.p.i. The bar-plot shows percent input (% Input) enrichment of PfAP2-MRP on target genes (mean ± SD of three independent experiments). IgG was used as the mock-treated control. P-values were calculated using a two-tailed t-test. d, Input subtracted ChIP peaks of PfAP2-MRP in chromosome 4 and 7 as representatives in both 16 and 40 h.p.i. stages. Also, zoomed in PfAP2-MRP bound central chromosomal and sub-telomeric heterochromatin regions are shown. X-axis shows the genomic position and numbers on the right show the enrichment score. e, Schematic diagram of the chromosomal position of var genes with promoters bound by PfAP2-MRP at either 16 h.p.i. (green), 40 h.p.i. (red) or at both stages (black).
Extended Data Fig. 5|
Extended Data Fig. 5|. PfAP2-MRP binds to the putative promoter regions of multiple apiap2 genes.
Occupancy of PfAP2-MRP in the promoter region of apiap2 genes. ChIP tracks show input subtracted PfAP2-MRP-ChIP from 16 and 40 h.p.i. parasites. Arrow marks show the direction of gene transcription X-axis shows the genomic position, and numbers on the right show the enrichment score.
Extended Data Fig. 6|
Extended Data Fig. 6|. PfAP2-MRP, PfAP2-I and PfAP2-G binds to many common genomic regions
a, Occupancy of PfAP2-MRP in the promoter region of pfap2-I at 16 and 40 h.p.i. b, Occupancy of PfAP2-MRP and PfAP2-I in the promoter region of pfap2-mrp at 16 and 40 h.p.i. c, Schematic showing probable gene regulatory network between PfAP2-MRP and PfAP2-I. Orange arrows indicate the binding of protein to its gene promoter. d, Comparison of genes with promoters bound by PfAP2-MRP (red), PfAP2-I (green) and PfAP2-G (light blue) at 40 h.p.i. e, Input-subtracted ChIP-seq read coverage for exemplar genes with promoters that are either bound by all three AP2 proteins (left panel), uniquely by PfAP2-MRP, by both PfAP2-MRP and PfAP2-I, or by both PfAP2-MRP and PfAP2-G (right panel). Arrows show the direction of gene transcription. X-axes show the chromosomal position, and the numbers on the side show the peak enrichment score. X-axis shows the genomic position and numbers on the right show the enrichment score.
Extended Data Fig. 7|
Extended Data Fig. 7|. PfAP2-MRP binds to the putative promoter region of invasion-associated genes.
Occupancy of PfAP2-MRP in the promoter region of different invasion associated genes. The ChIP tracks show two replicates with input subtracted from the PfAP2-MRP-ChIP data. Arrows indicate direction of transcription. X-axis shows the chromosomal position, and numbers on the right, show the enrichment score.
Extended Data Fig. 8|
Extended Data Fig. 8|. Visualizations of in-situ Hi-C generated chromatin interactions
ICE-normalized contact count heatmaps at 10kb resolution of intrachromosomal interactions for the 14 chromosomes, as well as a genome-wide contact count heatmap showing interchromosomal interactions, are given for both the 16 h.p.i. and 40 h.p.i. time points. Each row represents a single chromosome of the wild type (left), Δpfap2-mrp (center), and log2 fold change differential interactions (right). The data for the two biological replicates were merged using a weighted average based on the total read count and then counts-per-million normalized prior to generating heatmaps. The scale of the legend was also normalized to improve comparisons between WT and Δpfap2-mrp. For each bin i, all interactions within i +/− 2 are set to 0 (see white line at diagonal) to enhance visualization of remaining bins due to intra-bin and very short-range contacts being significantly higher
Extended Data Fig. 9|
Extended Data Fig. 9|. PfAP2-MRP is a master regulator of malaria pathogenesis
Deletion of pfap2-mrp before the first peak of expression at 16 h.p.i. affects parasite development beyond late trophozoite/early schizont stages. Deletion of pfap2-mrp well before 40 h.p.i. but after the first peak of expression at 16 h.p.i. affects merozoite development and blocks parasite egress from infected RBCs. At this late stage of intraerythrocytic development, the second peak of pfap2-mrp expression activates many genes associated with invasion, egress, antigenic variation, host cell remodeling and protein phosphorylation, either directly by binding to their promoter or indirectly through other downstream ApiAP2 transcription factors and regulators. PfAP2-MRP is a direct repressor of var genes and an indirect repressor of many gametocytogenesis-associated marker genes. Deletion of pfap2-mrp derepresses expression of most of var genes leading to the displayed of the corresponding PfEMP1 on the iRBC surface. PfAP2-MRP acts as a direct activator of many other genes such as rifins, stevors, and pfmc-2tms coding for antigenically variant proteins, and binds to the promoter of 14 other ApiAP2s (50% of all P. falciparum ApiAP2 genes), suggesting that it is an upstream regulator of gene expression cascades during the IDC. PfAP2-MRP associates with many known and putative histone modifiers and chromatin remodelers that probably participate in PfAP2-MRP associated gene regulation. Altogether, PfAP2-MRP regulates the expression of most known pathogenic factors (associated with antigenic variation and parasite growth) in P. falciparum suggesting it is a master regulator of malaria pathogenesis.
Fig. 1|
Fig. 1|. PfAP2-MRP is essential for parasite growth and development
a, Schematic of strategy to tag pfap2-mrp with 3HA sequence and its conditional knockout by excision of the loxP-flanked second exon. b, Diagnostic PCR confirms exon2 excision in RAPA-treated parasites. c, RNA-seq reads coverage from 40 h.p.i. parasites of pf-ap2-mrp locus. d, Western blot of control (RAPA −) and rapamycin (RAPA +) treated PfAP2-MRP-3HA:loxP schizont extracts probed with anti-HA and -histone H3 antibodies. Molecular mass (kDa) of standards on left side of each panel. e, Images of Giemsa-stained (control [RAPA (−)] and treated [RAPA (+)]; treatment at 16 h.p.i) schizonts at end of cycle 0 (representative of 4 independent experiments). f, Nuclei in control [RAPA (−)] and treated [RAPA (+)] schizonts. The mean number was 14.7 (control) and 13.4 (treated); P-value of 0.178, one-way ANOVA using Sidak’s multiple comparisons test, assumed Gaussian distribution. g, Replication of control [RAPA (−)] and treated [RAPA (+)] parasites over two growth cycles (three biological replicates, average parasitemia ± s.d.). h, Erythrocyte invasion by control [RAPA (−)] and treated [RAPA (+)] PfAP2-MRP-3HA:loxP parasites under static and shaking conditions. Statistical significance: two-tailed t-test; RAPA (−) versus RAPA (+) parasites in static conditions (n=3, t = 14.17, d.f. = 4, P = 0.000013, 95% CI 1.606 to 2.389) and RAPA (−) versus RAPA (+) parasites in shaking conditions (n=3, t = 12.41, d.f. = 4, P = 0.000021, 95% CI 1.578 to 2.487). i-j, Immunofluorescence microscopy of control [RAPA (−)] and treated [RAPA (+)] parasites incubated with anti-GAP45 IgG (i) and anti-MSP7 serum (j); scale bar is 2 μm. k-l, Electron micrographs of iRBCs treated with compound 2(k) or rapamycin [RAPA(+)] (l); scale bar is 1 μm or 100 nm (inserts). m, RNA-seq reads coverage from 16 h.p.i. parasites (cycle 1) of pf-ap2-mrp locus. n, Images of Giemsa-stained parasites at 39, 43, 46 and 49 h.p.i. stages in cycle 1 following parasite treatment with DMSO [RAPA (−)] or rapamycin [RAPA(+)] at 35 h.p.i. at cycle 0.
Fig. 2|
Fig. 2|. PfAP2-MRP regulates most of the malaria pathogenesis-associated genes
a-b, Volcano plots showing differentially expressed var genes in 16 h.p.i (cycle 1) (a) and 40 h.p.i. (cycle 0) (b) Δpfap2-mrp parasites. c-d, Differential expression of var genes (log2 ratio of Δpfap2-mrp to mock-treated control parasites) measured by qRTPCR at 16 h.p.i. (c) and 40 h.p.i. (d); error bar is s.e.m. e, Lollipop plot of expression level of top 20 significantly down-regulated genes in Δpfap2-mrp compared to control parasites at 40 h.p.i. f, Heatmaps for most down-regulated genes known to be involved in parasite egress and invasion in treated [RAPA (+)] or control [RAPA (−)] parasites, grouped based on the sub-cellular location of their products. g, Western blots of schizont extract from parental II-3 and PfAP2-MRP-3HA parasites in the absence (−) or presence (+) of rapamycin, probed with antibodies specific for invasion proteins. BiP was detected as a loading control. Molecular mass (kDa) of standards on left side of each panel. A non-specific cross-reacting protein on the SUB1 blot is marked with an asterisk. h, Left: uniform manifold approximation and projection (UMAP) of scRNA-seq data from Malaria Cell Atlas (MCA), with annotated developmental stages. Right: UMAP projections of scRNA-seq in-house data; each dot represents gene expression data from a single parasite (colours corresponding to h.p.i. and pfap2-mrp knockout status) plotted over MCA data. i, Distribution of developmental stages of treated [RAPA(+)] or control [RAPA( −)] parasites at 16 and 40 h.p.i. j, Violin plots of average var gene expression in treated [RAPA (+)] or control [RAPA (−)] parasites at both 16 h.p.i. and 40 h.p.i. k, Proportion of cells expressing one or more var genes from treated [RAPA(+)] or control [RAPA (−)] cultures (P= 6.23e-13, Fisher’s exact test, odds ratio=1.53). l, Percentage of iRBCs containing control or Δpfap2-mrp parasites bound by IgG from serum of malaria-infected (HS+) patients, or untreated samples (HS−) . Significance determined using a two-tailed t-test (t = 6.687, d.f. = 4, P < 0.0001, 95% CI 0.9844 to 2.382, n=3).
Fig. 3|
Fig. 3|. PfAP2-MRP regulates pathogenesis-associated genes via promoter binding
a, Genome-wide occupancy of PfAP2-MRP at 16 h.p.i. and 40 h.p.i., determined by ChIP-seq. Sub-telomeric and internal regions of chromosome 7 (~1450 kb) containing var genes with PfAP2-MRP bound in their promoter regions are shown as an example. Chromosomal positions are indicated. Results are representative of 2 independent replicates. b, Pie charts showing the proportion of each family of genes with PfAP2-MRP bound to the promoter region (in blue) at 16 h.p.i. c, PfAP2-MRP occupancy at 16 h.p.i. in putative promoter regions of genes implicated in iRBC remodeling and parasite development. Two biological replicate ChIP vs. Input tracks are shown, (input subtracted PfAP2-MRP-ChIP). Positions on Chr 09, 10, 11 and 13 are indicated. X-axis shows the genomic position and numbers on the right, show the enrichment score (see Methods). d, Expression levels of 27 P. falciparum AP2 genes during different IDC stages and in merozoites are depicted by the diameter of the circles. On the right, blue, brown and green circles indicate the binding of PfAP2-MRP to the promoter at either or both 16 h.p.i. and 40 h.p.i.; the heatmap displays the expression status of all 26 api-ap2s in Δpfap2-mrp parasites compared to controls at 16 and 40 h.p.i. The heatmap for pfap2-mrp is black because Δpfap2-mrp parasites only express RNA from the first exon and have no functional AP2-MRP protein.
Fig. 4|
Fig. 4|. PfAP2-MRP binds to specific DNA motifs and associates with chromatin remodelers
a, Most significantly enriched motif bound by PfAP2-MRP at 16 h.p.i. b-c, The two most significantly enriched motifs bound by PfAP2-MRP at 40 h.p.i. d, The most enriched motif (panel c) at 40 h.p.i. is similar to the PfAP2-I binding motif e, The numbers of genes with promoters bound by PfAP2-MRP at either 16 h.p.i., 40 h.p.i. or both. f-g, Genomic regions uniquely bound by PfAP2-MRP at 16 h.p.i. (f) or at both 16 and 40 h.p.i. (g). X-axis shows the genomic position and numbers on the right, show the enrichment score. h-i, Label-free quantitative proteomic analysis of P. falciparum proteins enriched in PfAP2-MRP immunoprecipitates at 16h.p.i. and 40 h.p.i.
Fig. 5|
Fig. 5|. Depletion of PfAP2-MRP increases chromatin accessibility
a, Chromatin contact count heatmap of chromosome 7 at 16 h.p.i. (top) and 40 h.p.i (bottom) for the WT (left) and Δpfap2-mrp (middle), as well as the log! fold change in interactions (right) between the WT and Δpfap2-mrp. Blue indicates a loss of interactions and red indicates an increase of interactions Δpfap2-mrp over WT. b, Whole-genome interchromosomal contact count heatmaps at 16 h.p.i. for the WT (left) and Δpfap2-mrp (right). Chromosomes are sorted from left to right and bottom to top. Intrachromosomal interactions are removed. c, Whole-genome 3D chromatin models at 16 h.p.i. for the WT (left) and Δpfap2-mrp (right). Centromeres (blue), telomeres (green), and var genes (red) are enhanced to display differences between the two samples. d, Number of interactions between var gene containing bins.

References

    1. Cowman A. F., Tonkin C. J., Tham W. H. & Duraisingh M. T. The Molecular Basis of Erythrocyte Invasion by Malaria Parasites. Cell Host Microbe 22, 232–245, doi: 10.1016/j.chom.2017.07.003 (2017). - DOI - PubMed
    1. Boddey J. A. & Cowman A. F. Plasmodium nesting: remaking the erythrocyte from the inside out. Annu Rev Microbiol 67, 243–269, doi: 10.1146/annurev-micro-092412-155730 (2013). - DOI - PubMed
    1. Tan M. S. Y. & Blackman M. J. Malaria parasite egress at a glance. J Cell Sci 134, doi: 10.1242/jcs.257345 (2021). - DOI - PMC - PubMed
    1. Cortes A. & Deitsch K. W. Malaria Epigenetics. Cold Spring Harb Perspect Med 7, doi: 10.1101/cshperspect.a025528 (2017). - DOI - PMC - PubMed
    1. Toenhake C. G. et al. Chromatin Accessibility-Based Characterization of the Gene Regulatory Network Underlying Plasmodium falciparum Blood-Stage Development. Cell Host Microbe 23, 557–569 e559, doi: 10.1016/j.chom.2018.03.007 (2018). - DOI - PMC - PubMed

Publication types