[Preprint]. 2023 May 25:rs.3.rs-2944614.
doi: 10.21203/rs.3.rs-2944614/v1.

Rit2 silencing in dopamine neurons drives a progressive Parkinsonian phenotype

Affiliations

Rit2 silencing in dopamine neurons drives a progressive Parkinsonian phenotype

Patrick J Kearney et al. Res Sq. .

Update in

Abstract

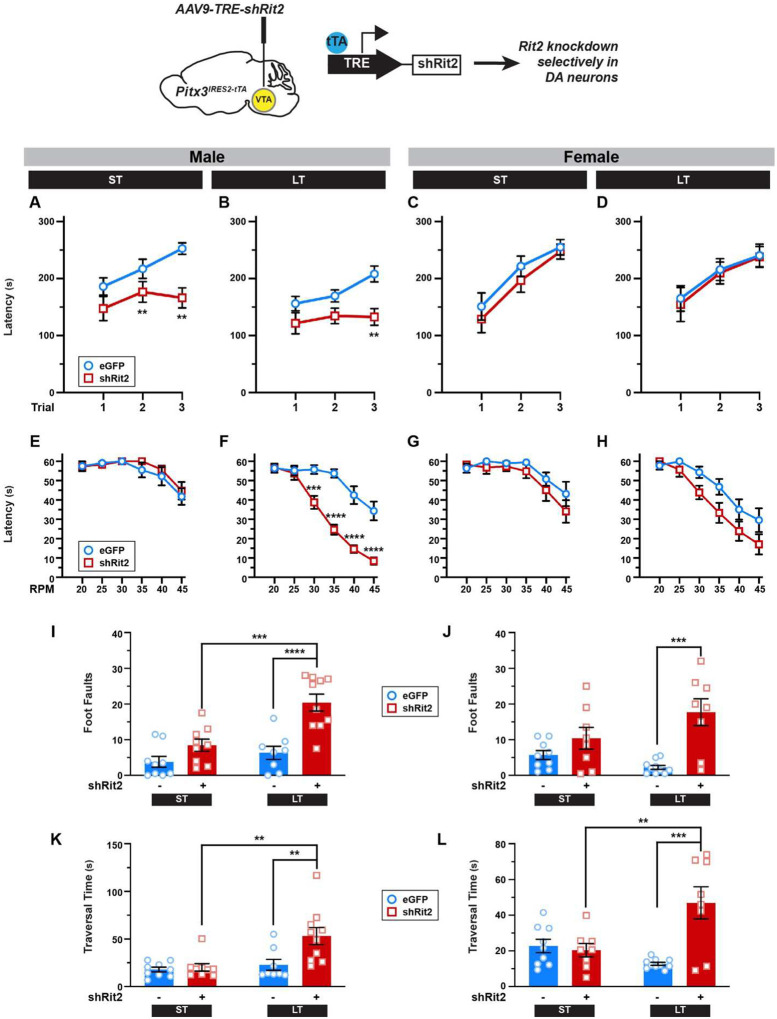
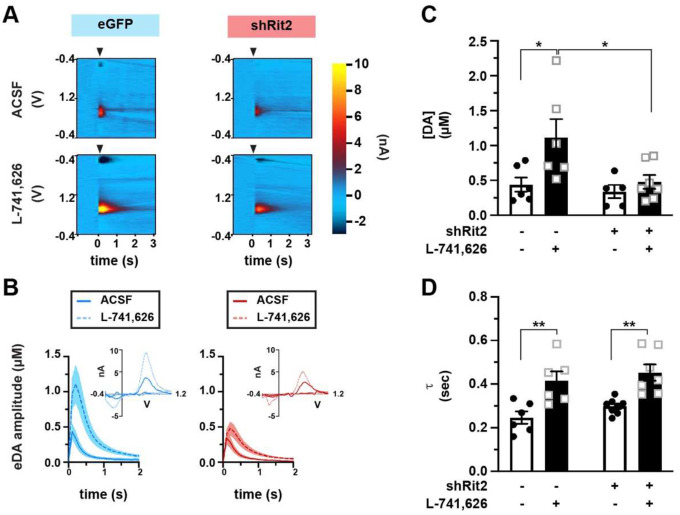
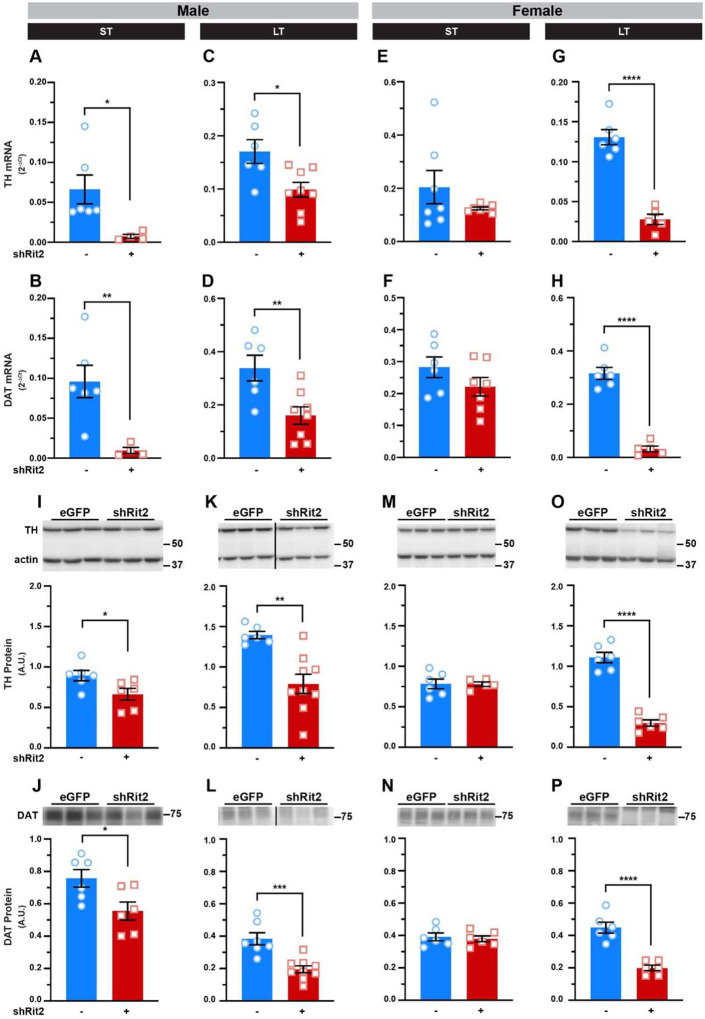
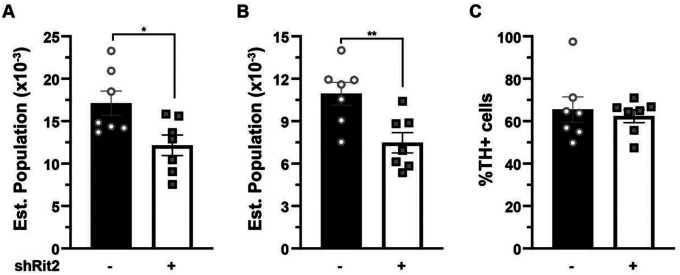
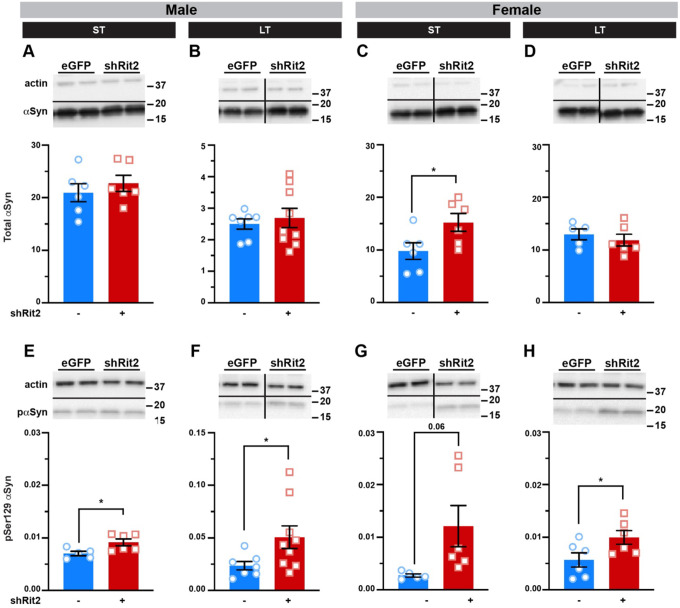
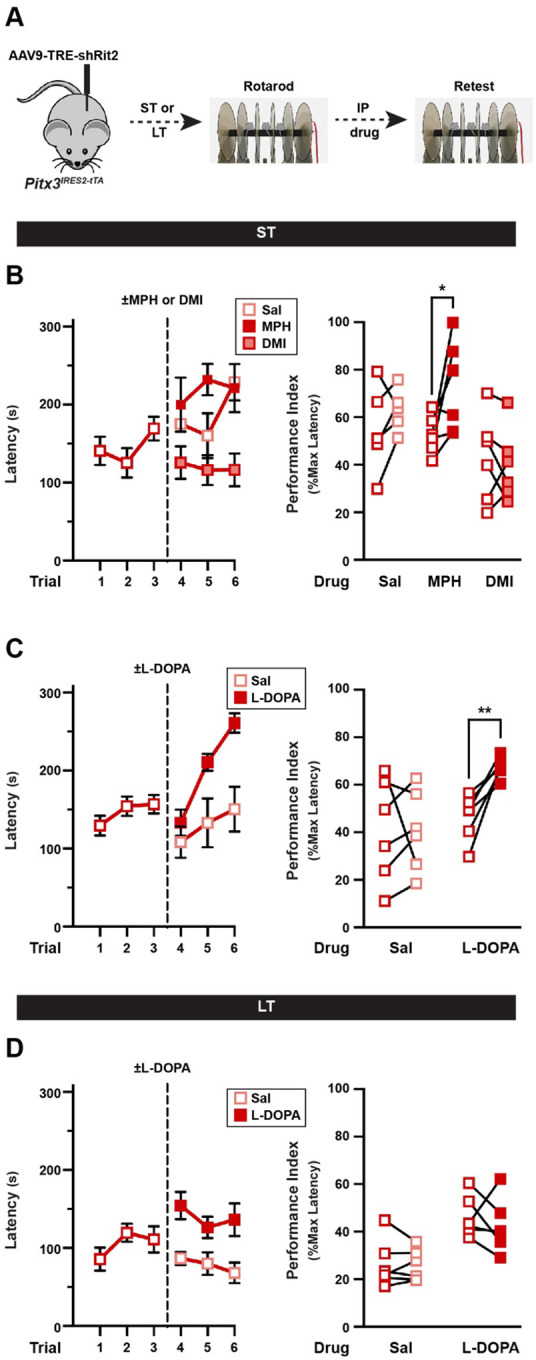
Parkinson's disease (PD) is the second most prevalent neurodegenerative disease and arises from dopamine (DA) neuron death selectively in the substantia nigra pars compacta (SNc). Rit2 is a reported PD risk allele, and recent single cell transcriptomic studies identified a major RIT2 cluster in PD DA neurons, potentially linking Rit2 expression anomalies to a PD patient cohort. However, it is still unknown whether Rit2 loss itself is causative for PD or PD-like symptoms. Here we report that conditional Rit2 silencing in mouse DA neurons drove a progressive motor dysfunction that was more rapid in males than females and was rescued at early stages by either inhibiting the DA transporter (DAT) or with L-DOPA treatment. Motor dysfunction was accompanied by decreases in DA release, striatal DA content, phenotypic DAergic markers, and a loss of DA neurons, with increased pSer129-alpha synuclein expression. These results provide the first evidence that Rit2 loss is causal for SNc cell death and a PD-like phenotype, and reveal key sex-specific differences in the response to Rit2 loss.


Conflict of interest statement

Competing Interests All authors declare no financial or non-financial competing interests.

Figures

Figure 1.
Figure 1.. Conditional Rit2 silencing in DA neurons leads to progressive, but differential, motor dysfunction in males and females.
Pitx3IRES-tTA mouse midbrains were bilaterally injected with either AAV9-TRE-eGFP or -shRit2 and mice were assessed either 4–5 weeks (ST) or 25 weeks (LT) post-injection. Data were analyzed by two-way repeat measures ANOVA with Sidak’s multiple comparison test (A-H), or two-way ANOVA with Tukey’s multiple comparison test (I-L). Top: Experimental schematic. Pitx3IRES-tTA mouse midbrains were bilaterally injected with either AAV9-TRE-eGFP or -shRit2 and mice were assessed either 4–5 weeks (ST) or 25 weeks (LT) post-injection. (A-D) Accelerating Rotarod: Mice were assessed over 3 consecutive trials as described in Methods. Rit2 silencing in DA neurons abolished motor learning in male ST (A. Trial: p=0.001, F(2, 41)= 8.95; Virus: p=0.002, F(1, 24) = 11.69; trial × virus: p=0.03; *p<0.005; n=9–11) and LT (B. Trial: p=0.01, F(2, 34)=5.22; Virus: p=0.02, F(1, 17)=7.02; **p=0.005, n=8–11) mice, but had no effect on ST (C. Trial: p=0.002, F(2, 48)=6.82; Virus: p=0.72, F(1, 48)=0.12; n=1112) or LT (D. Trial: p=0.002, F(2, 48)=6.82, Virus: p=0.72, F(1,48)=0.12, n=8–10) female motor learning. (E-H) Fixed-speed Rotarod: Mice were assessed over the indicated consecutive speeds as described in Methods. E,F. Rit2 silencing did not affect ST males (E. Rate: p<0.0001, F(5,70)=11.59, Virus: p=0.48, F(1,14)=0.53, n=8), but significantly diminished LT male rotarod performance (F. Rate: p<0.0001, F(5,102)=46.88, Virus: p<0.0001, F(1,102)=98.31, Rate × Virus: p<0.0001, F(5,102)=5.34; ***p<0.001, ****p<0.0001, n=8–11) G,H. Rit2 silencing had no effect on female rotarod performance at the ST timepoint (G. RPM: p<0.0001, F(2, 35)=12.79, Virus: p=0.22, F(1,15)=1.637; n=8) but significantly diminished performance at the LT timepoint (H. RPM: p<0.0001, F(5,108)=6.29; Virus: p=0.006, F(1,108)=12.48; n=10). I-L. Challenge balance beam: Mice were assessed on the challenge balance beam as described in Methods. Mean foot fault numbers (I,J) and beam traversal times (seconds) (K,L) were analyzed. Rit2 silencing had no effect on ST male foot faults, but increased LT male foot faults (I. Time: p=0.0007, F(1,32)=14.23; Virus: p<0.0001, F(1, 32)=23.83; Time × virus: p=0.02, F(1, 32)=6.01; ***p=0.004, ****p<0.0001, n=8–10) and traversal times (K. Time: p=0.004, F(1,32)=9.52; Virus: p=0.01, F(1, 32)=7.02; Time × virus: p=0.03, F(1, 32)=5.17; **p<0.01, n=8–10). Rit2 silencing had no effect on ST female foot faults, but increased LT female foot faults (J. Time: p=0.42, F(1,31)=0.68; Virus: p=0.0002, F(1, 31)=18.59; Time × virus: p=0.03, F(1, 31)=5.36; ***p=0.0003, n=8–10) and traversal times (L. Time: p=0.10, F(1,31)=2.85; Virus: p=0.003, F(1, 31)=10.64; Time × virus: p=0.0008, F(1, 31)=13.95; **p=0.005, ***p=0.0001, n=8–10).
Figure 2.
Figure 2.. Short-term DAergic Rit2 silencing impacts DA release, but not clearance in males.
Ex vivo fast-scan cyclic voltammetry: Pitx3IRES-tTA mouse VTA were bilaterally injected with either AAV9-TRE-eGFP (n=6) or AAV9-TRE-shRit2 (n=5–7) and electrically evoked DA transients were measured ex vivo in acute dorsal striatum as described in Methods. Values were analyzed by two-way ANOVA with Tukey’s multiple comparison test. (A) Representative voltammograms: Voltammograms displaying evoked current over voltage cycles and time, in slices from eGFP- and shRit2-injected mice, recorded in either ACSF or 25nM L-741,626, as indicated. Arrowheads indicate delivery of single, squared wave pulse. (B) Dopamine transients: Representative evoked DA transients in slices in slices from eGFP- and shRit2-injected mice, recorded in either ACSF or 25nM L-741,626, ±S.E.M. (shaded areas), as indicated. (C) Average amplitudes: DA transient amplitudes are presented in μM ±S.E.M. Virus: p=0.03, F(1, 20)=2.83; Drug: p=0.02, F(1, 20)=6.58; *p<0.05. (D) Average decay tau, presented in seconds ±S.E.M. Virus: p=0.16, F(1, 23)=2.08; Drug: p<0.0001, F(1, 23)=27.43; **p<0.01.
Figure 3.
Figure 3.. Long-term, but not short-term, Rit2 silencing decreases striatal DA content.
Mass spectrometry. Dorsal (DS) and ventral (VS) striata were dissected from male and female control and shRit2 mice at the indicated timepoints, and total DA and GABA content were measured by LC/MS/MS as described in Methods. Data are presented as pmol of the indicated neurotransmitter per mg tissue, and were analyzed by unpaired, one-tailed (DA) or two-tailed (GABA) Student’s t test. (A-D) Striatal DA Content: ST Rit2 silencing had no effect on DA content in male VS and DS (A. VS: p=0.27; DS: p=0.48, n=5–6), whereas LT Rit2 silencing decreased DA in DS, but not VS (B. VS: p=0.18; DS: p=0.03, n=7–8). ST Rit2 silencing had no effect on DA content in female VS and DS (C. VS: p=0.49; DS: p=0.26, n=5–6), but significantly decreased DA in LT females in both VS and DS (D. VS: *p=0.04; DS: *p=0.02, t test with Welch’s correction, n=6). (E-H) Striatal GABA content. Rit2 silencing had no effect on GABA content in either VS or DS in ST males (E. VS: p=0.75; DS: p=0.50, n=6), LT males (F. VS: p=0.74; DS: p=0.61, n=78), ST females (G. VS: p=0.28; DS: p=0.58, n=6), or LT females (H. VS: p=0.86; DS: p=0.29, n=6).
Figure 4.
Figure 4.. DAergic Rit2 silencing diminishes DAergic mRNA and protein expression.
Ventral midbrain and striatum were dissected from male and female control and shRit2 mice at the indicated timepoints, and TH and DAT mRNA and protein were measured in ventral midbrain and striatal subregions, respectively, as described in Methods. Data were analyzed by unpaired, two-tailed Student’s t test. (A-D) Male ventral midbrain RT-qPCR. TH (A. *p=0.02 with Welch’s correction, n=4–7) and DAT (B. **p=0.008 with Welch’s correction, n=4–6) mRNA were significantly decreased in ST shRit2 VM and both TH (C. *p=0.01, n=6–8) and DAT (D. **p=0.008, n=6–8) remained suppressed in LT shRit2 ventral midbrain as compared to eGFP controls. (C-F) Female ventral midbrain RT-pPCR. Neither TH (E. p=0.25 with Welch’s correction, n=7) nor DAT (F. p=0.19, n=6–7) mRNA were significantly affected in ST shRit2 ventral midbrain, whereas both TH (C. ****p<0.0001, n=5–6) and DAT (D. ****p<0.0001, n=5–6) were diminished in LT shRit2 ventral midbrain as compared to eGFP controls. (I-L) Male striatal protein. Top: Representative striatal immunoblots for each protein, showing 3 independent mouse lysates each for control and shRit2 mice. Molecular weight markers are indicated in kDa. TH (I. *p=0.04, n=6) and DAT (J. *p=0.03, n=6) protein levels were significantly decreased in ST shRit2 striata, and both TH (K. ***p=0.0008 with Welch’s correction, n=6–9) and DAT (L. ***p=0.0004, n=7–9) continued to be significantly decreased in LT shRit2 striata. (M-P) Female striatal protein. Top: Representative striatal immunoblots for each protein, showing 3 independent mouse lysates each for control (eGFP) and shRit2 mice. Neither TH (M. p=0.96) nor DAT (N. p=0.71, n=5–6) striatal protein levels were significantly diminished in shRit2 striata as compared to controls. In LT shRit2 striata, both TH (O. ****p<0.0001, n=6) and DAT (P. ****p<0.0001, n=6) protein levels were significantly reduced as compared to controls.
Figure 5.
Figure 5.. Prolonged DAergic Rit2 silencing decreases the substantia nigra DA neuron population.
Stereological analysis of SNc neurons. Pitx3IRES-tTA males and female mouse VTA were bilaterally injected with either AAV9-TRE-eGFP or AAV9-TRE-shRit2 and brains were fixed, sectioned and stained with cresyl violet and TH-specific antibodies at the LT timepoint. Total and TH+ cell numbers were counted as described in Methods. LT male and female data were pooled. LT Rit2 KD significantly decreased total Nissl+ (A. *p=0.02) and TH+ (B. **p=0.008) cells, but did not significantly affect the %neurons that were TH+ (C. p=0.64) in SNc. Unpaired, two-tailed Student’s t test, n=7.
Figure 6.
Figure 6.. Prolonged DAergic Rit2 silencing increases PD-associated protein biomarkers in striatum.
Quantitative Immunoblotting. Pitx3IRES-tTA mouse VTA were bilaterally injected with either AAV9-TRE-eGFP or AAV9-TRE-shRit2. Striatal lysates were collected 4–5 weeks (ST) or 5–6mo (LT) post-injection and αSyn and αS129-aSyn levels were measured by quantitative immunoblot, normalized to actin, as described in Methods. Tops: Representative immunoblots showing two independent mouse lysates per virus. (A-D) αSyn levels: shRit2 had no effect on total αSyn levels in males at either ST (A. p=0.46, n=6) or LT (B. p=0.62, n=7–9) timepoints. ST shRit2 significantly increased αSyn in females (C. *p=0.04, n=6), but had no effect in LT females as compared to controls (D. p=0.50, n=6). (E-H) pS129-αSyn levels: pS129-αSyn was significantly increased by shRit2 in ST (E. *p=0.02, n=6) and LT (F. *p=0.04, n=7–9) males. pS129-αSyn trended towards a significant increase by shRit2 in ST females (G. p=0.06, n=6) and was significantly increased in LT females (H. *p=0.04, n=7–9). Two-tailed, unpaired, Student’s t test.
Figure 7.
Figure 7.. Male motor learning deficits are rescuable with Parkinson’s therapeutics at early, but not late, Rit2 silencing timepoints.
Accelerating rotarod rescue studies. (A) Experimental schematic. Pitx3IRES-tTA male mouse VTA were bilaterally injected with AAV9-TRE shRit2 and were assessed on the accelerating rotarod at the indicated timepoints as described in Methods. Mice were initially tested for three trials, injected ±the indicated treatment drugs (I.P), and were retested for an additional three trials. Performance indices for each mouse were calculated pre- and post-test, and performance were assessed with a two-tailed, paired Student’s t test (B) Methylphenidate (MPH) treatment: ST shRit2 mice received either saline, 5mg/kg MPH, or 0.5mg/kg DMI, and were retested 15 min post injection. Left: Raw rotarod results presented as latency to fall during the trial. Right: Paired pre- and post-test rotarod performance indices. shRit2 mice treated with MPH performed significantly better than pre-injection (*p=0.03), whereas performance was not enhanced by either saline (p=0.28) or DMI (p=0.60), n=5–6. (C) L-DOPA treatment on ST shRit2 males: ST shRit2 mice were treated ±20mg/kg L-DOPA and were retested 1 hour post-injection. Left: Raw rotarod results. Right: Paired pre- and post-test rotarod performance indices. shRit2 mice treated with L DOPA (**p=0.005), but not saline (p=0.98) performed significantly better than pre-injection, n=6–7. (D) L-DOPA treatment on LT shRit2 males: LT shRit2 mice were treated ±20mg/kg L-DOPA and were retested 1 hour post-injection. Left: Raw rotarod results. Right: Paired pre- and post-test rotarod performance indices. Neither L-DOPA (p=0.48) nor saline (p=0.82) treatment significantly improved performance as compared to pre injection performance, n=6.

References

    1. Hartmann A. (2004) Postmortem studies in Parkinson’s disease. Dialogues Clin Neurosci 6, 281–293 - PMC - PubMed
    1. Dickson D. W. (2012) Parkinson’s disease and parkinsonism: neuropathology. Cold Spring Harb Perspect Med 2 - PMC - PubMed
    1. Pringsheim T., Jette N., Frolkis A., and Steeves T. D. (2014) The prevalence of Parkinson’s disease: a systematic review and meta-analysis. Mov Disord 29, 1583–1590 - PubMed
    1. Lees A. J. (2007) Unresolved issues relating to the shaking palsy on the celebration of James Parkinson’s 250th birthday. Mov Disord 22 Suppl 17, S327–334 - PubMed
    1. Jankovic J. (2008) Parkinson’s disease: clinical features and diagnosis. J Neurol Neurosurg Psychiatry 79, 368–376 - PubMed

Publication types

LinkOut - more resources