[Preprint]. 2023 May 15:2023.05.15.540872.
doi: 10.1101/2023.05.15.540872.

Asymmetric apical domain states of mitochondrial Hsp60 coordinate substrate engagement and chaperonin assembly

Affiliations

Asymmetric apical domain states of mitochondrial Hsp60 coordinate substrate engagement and chaperonin assembly

Julian R Braxton et al. bioRxiv. .

Update in

Abstract

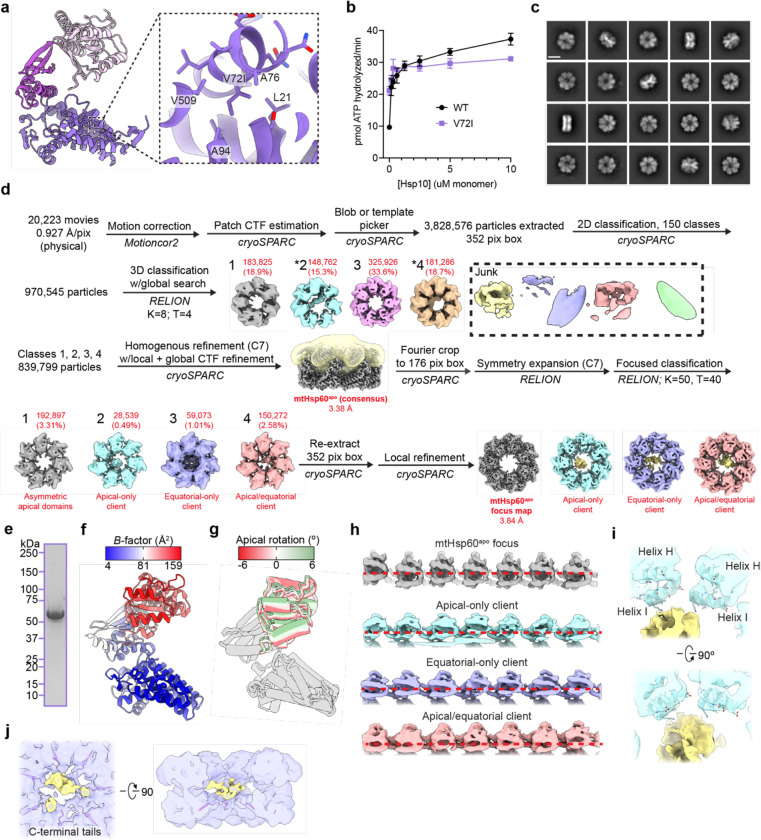
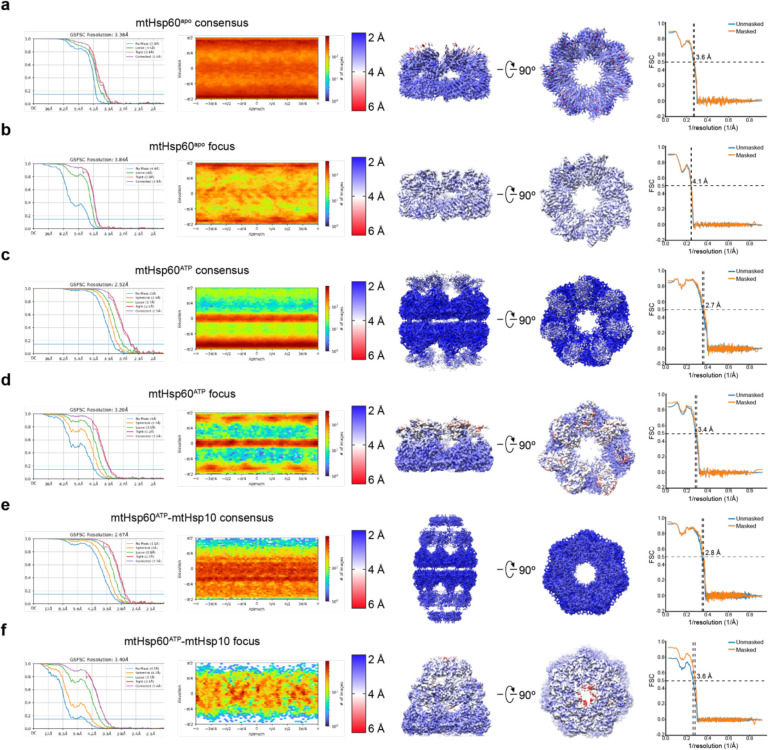
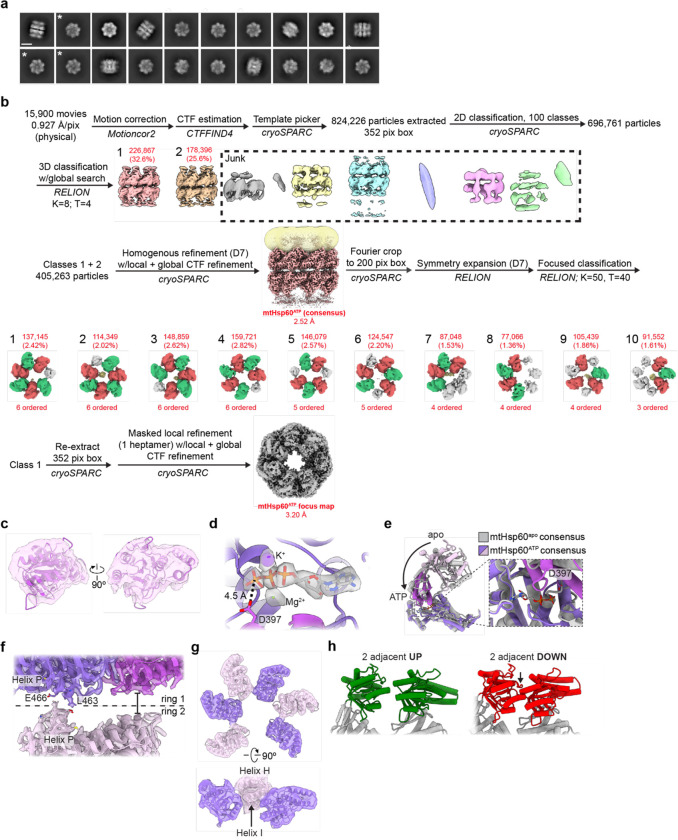
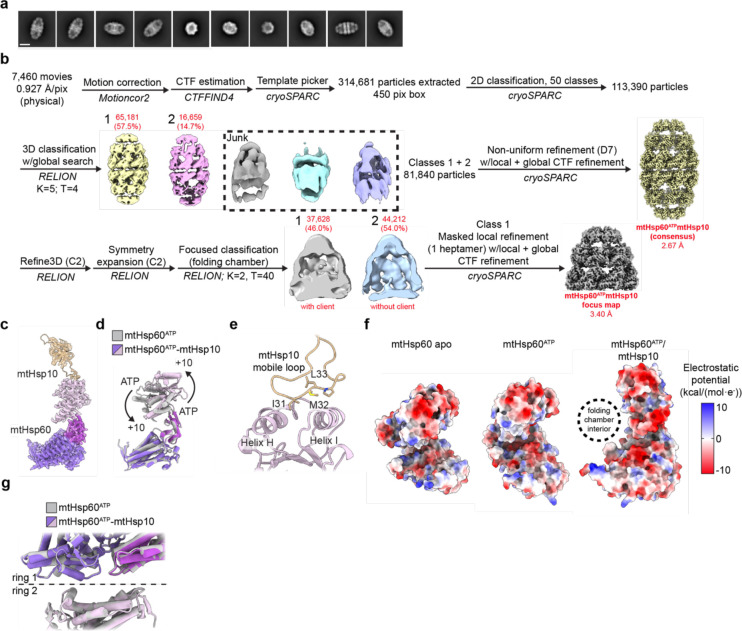
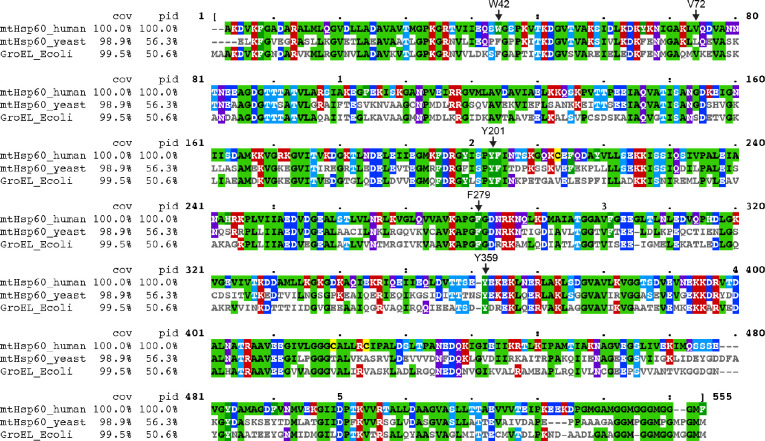
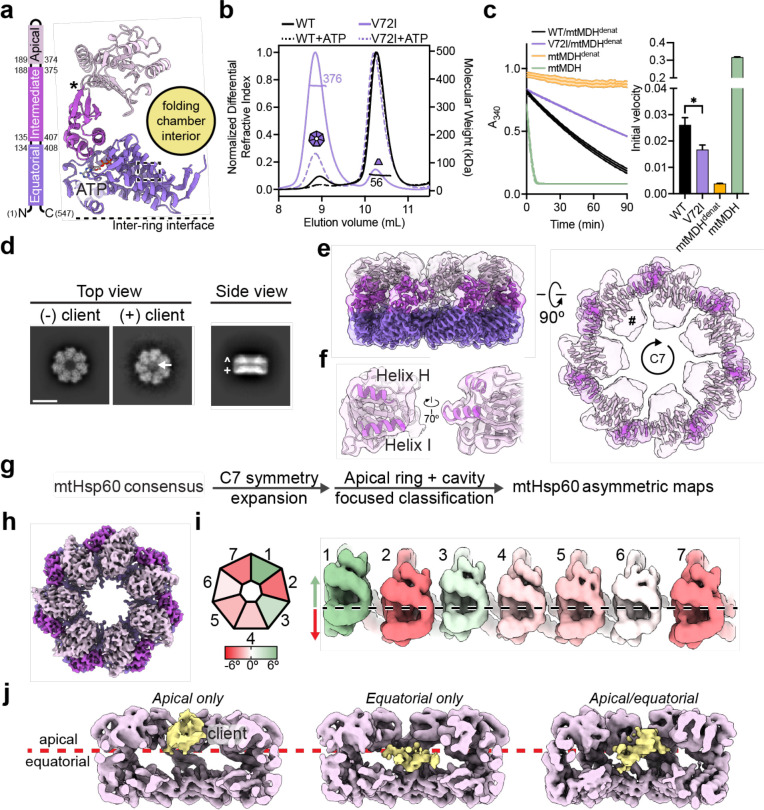
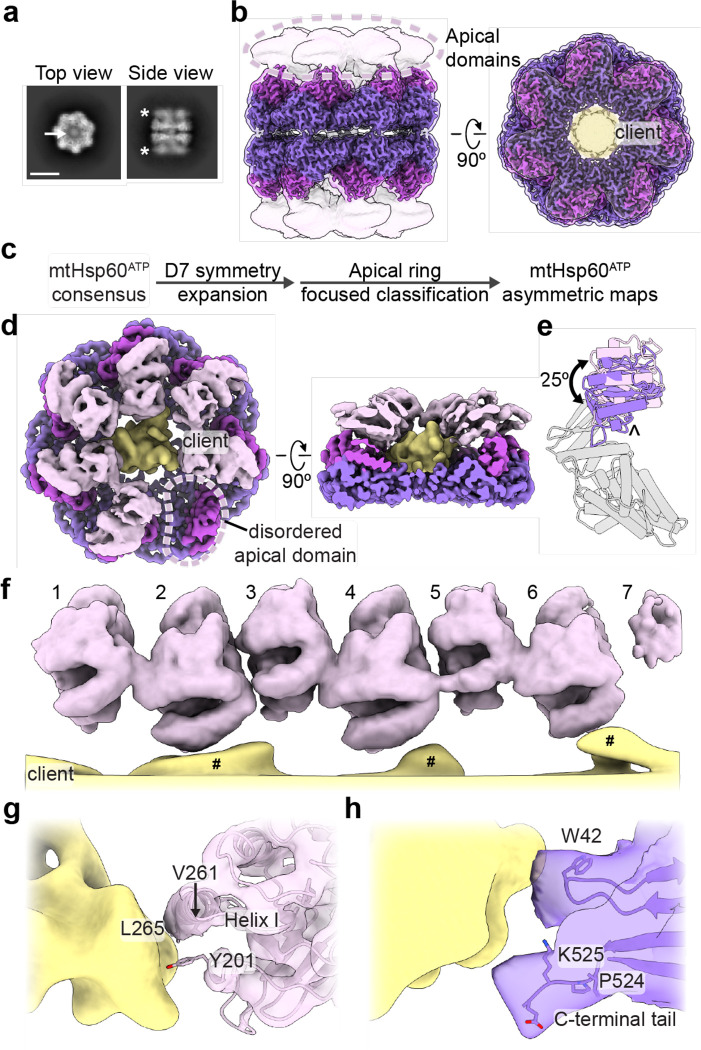
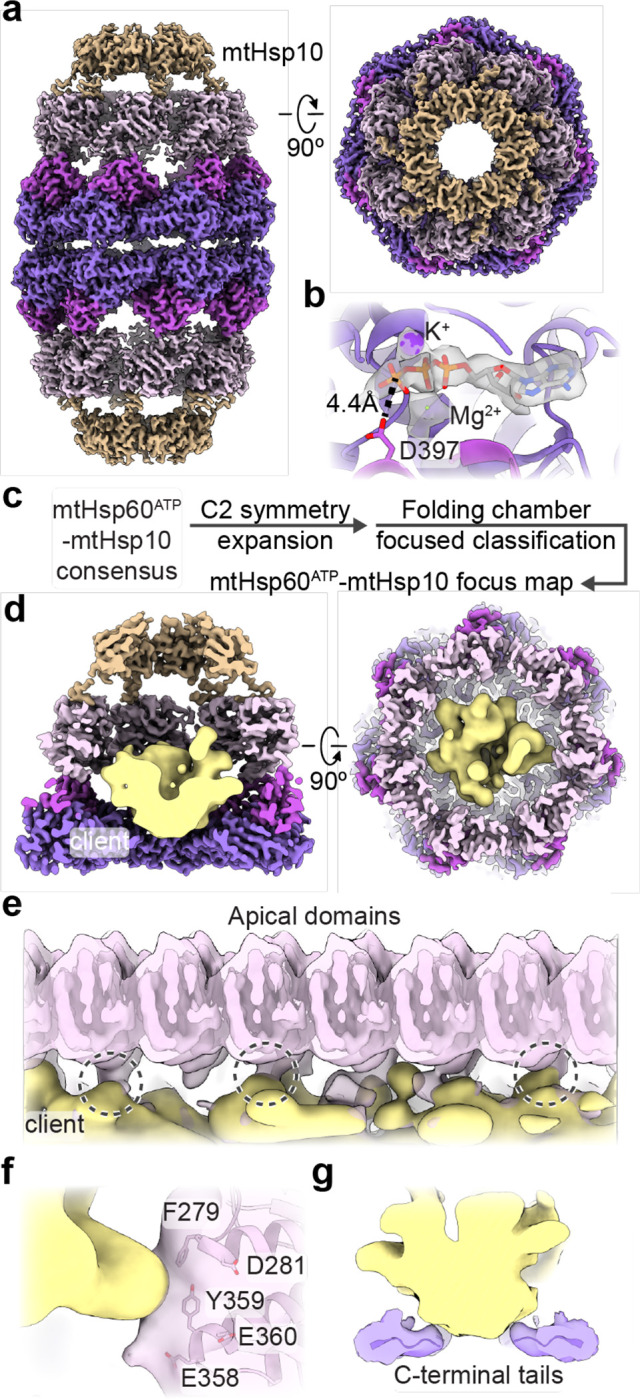
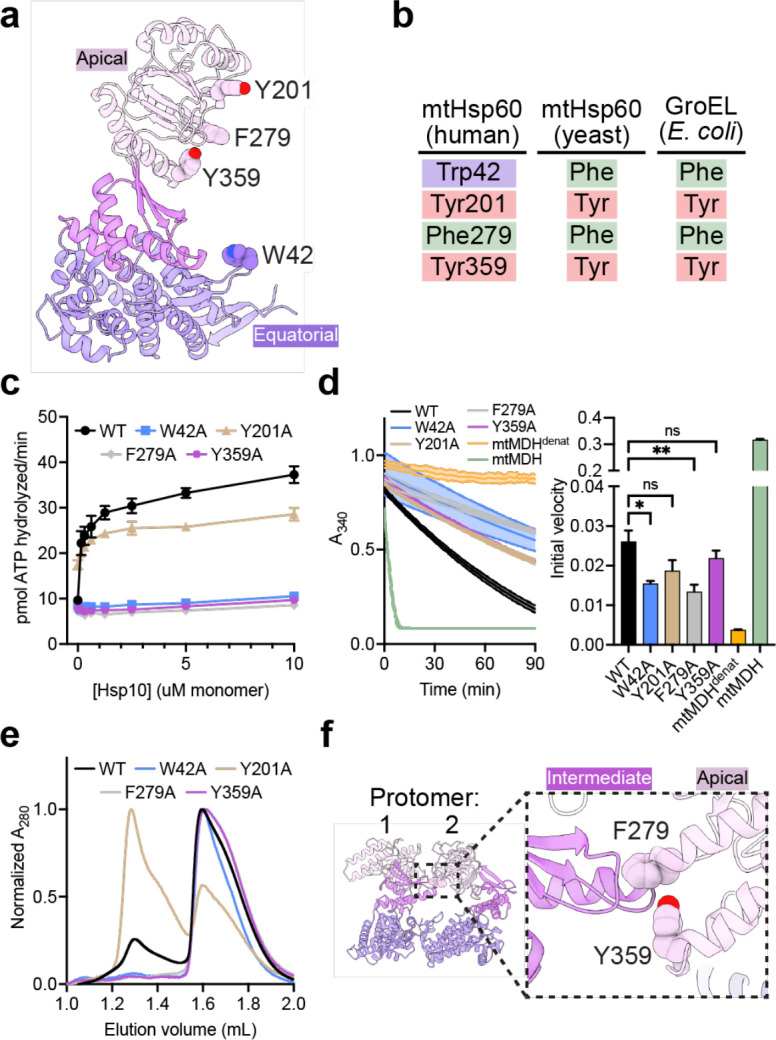
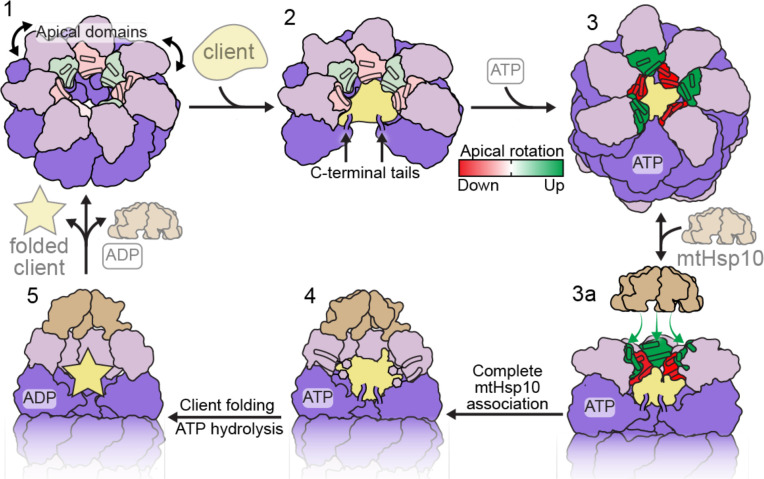
The mitochondrial chaperonin, mtHsp60, promotes the folding of newly imported and transiently misfolded proteins in the mitochondrial matrix, assisted by its co-chaperone mtHsp10. Despite its essential role in mitochondrial proteostasis, structural insights into how this chaperonin binds to clients and progresses through its ATP-dependent reaction cycle are not clear. Here, we determined cryo-electron microscopy (cryo-EM) structures of a hyperstable disease-associated mtHsp60 mutant, V72I, at three stages in this cycle. Unexpectedly, client density is identified in all states, revealing interactions with mtHsp60's apical domains and C-termini that coordinate client positioning in the folding chamber. We further identify a striking asymmetric arrangement of the apical domains in the ATP state, in which an alternating up/down configuration positions interaction surfaces for simultaneous recruitment of mtHsp10 and client retention. Client is then fully encapsulated in mtHsp60/mtHsp10, revealing prominent contacts at two discrete sites that potentially support maturation. These results identify a new role for the apical domains in coordinating client capture and progression through the cycle, and suggest a conserved mechanism of group I chaperonin function.


Conflict of interest statement

DECLARATION OF INTERESTS: The authors declare no competing interests.

Figures

Extended Data Fig. 1.
Extended Data Fig. 1.. Biochemical and cryo-EM analysis of apo mtHsp60V72I
(a) View of V72I mutation in mtHsp60apo, colored as in Fig. 1b. Adjacent hydrophobic residues also labeled. (b) Steady-state ATPase activity of mtHsp60 (black) and mtHsp60V72I (purple) as a function of mtHsp10 concentration. A representative experiment of three biological replicates is shown. Error bars represent standard deviation. (c) Representative 2D class averages from the mtHsp60apo dataset. Scale bar equals 100 Å. (d) Cryo-EM processing workflow for structures obtained from the mtHsp60apo dataset. The mask used for focused classification is shown in transparent yellow with the consensus map. Client-containing maps from the initial 3D classification are indicated (*). (e) Coomassie Brilliant Blue-stained SDS-PAGE gel of recombinant mtHsp60V72I, showing no strong additional bands corresponding to other proteins. (f) Protomer of apo mtHsp60 consensus colored by B-factor. (g) Overlay of mtHsp60apo focus protomers, with apical domains colored as in Fig. 1i. (h) Unwrapped views of unsharpened mtHsp60apo focus and client-bound maps, showing apical domain asymmetry. Horizontal red dashed lines are for clarity. (i) Enlarged view of apical domain helices H and I from the mtHsp60apo apical-only client map. (j) Enlarged view of resolved portions of C-terminal tails from the mtHsp60apo equatorial-only client map.
Extended Data Fig. 2.
Extended Data Fig. 2.. Cryo-EM densities and resolution estimation from the mtHsp60V72I datasets
(a to f) Fourier Shell Correlation (FSC) curves, orientation distribution plots, sharpened maps colored by local resolution (0.143 cutoff), and map-model FSC curves for (a) mtHsp60apo consensus, (b) mtHsp60apo focus, (c) mtHsp60ATP consensus, (d) mtHsp60ATP focus, (e) mtHsp60ATP-mtHsp10 consensus, and (f) mtHsp60ATP-mtHsp10 focus structures. Displayed model resolutions for map-model FSC plots were determined using the masked map.
Extended Data Fig. 3.
Extended Data Fig. 3.. Cryo-EM analysis of ATP-bound mtHsp60V72I
(a) Representative 2D class averages from the mtHsp60ATP dataset. Scale bar equals 100 Å. Top views of single ring complexes are indicated (*). (b) Cryo-EM processing workflow for structures obtained from the mtHsp60ATP dataset. The mask used for focused classification is shown in transparent yellow with the consensus map. Protomers from focused classification maps are colored in green (apical domain facing upward), red (apical domain facing downward), or gray (disordered apical domain). Class 1 was selected for refinement based on visual assessment of map quality. (c) View of an apical domain from the unsharpened mtHsp60ATP consensus map and associated model. (d) Nucleotide binding pocket of mtHsp60ATP, showing density for ATP and the γ-phosphate thereof, and Mg2+ and K+ ions (gray, from sharpened map). (e) Overlay of consensus mtHsp60apo and mtHsp60ATP models, aligned by the equatorial domain, showing a downward rotation of the intermediate and apical domains in the ATP-bound state. (f) Inter-ring interface of the sharpened mtHsp60ATP consensus map and fitted model, showing contact at the left interface mediated by helix P, but no contact at the right interface. Each protomer is colored a different shade of purple. (g) Unsharpened map and model of apical domains of mtHsp60ATP focus. ‘Down’ protomers are colored purple, ‘up’ protomers are colored pink. (h) Modeling of two adjacent ATP-bound ‘up’ (left) or ‘down’ (right) protomers, generated by aligning a copy of chain C of mtHsp60ATP focus with chain D (up pair) or a copy of chain D with chain C (down pair). A large clash is observed with two adjacent down protomers, while two adjacent up protomers appear compatible.
Extended Data Fig. 4.
Extended Data Fig. 4.. Cryo-EM analysis of ATP/mtHsp10-bound mtHsp60V72I
(a) Representative 2D class averages from the mtHsp60ATP-mtHsp10 dataset. Scale bar equals 100 Å. (b) Cryo-EM processing workflow for structures obtained from the mtHsp60ATP-mtHsp10 dataset. (c) Sharpened map and model for the asymmetric unit of the mtHsp60ATP-mtHsp10 consensus structure. (d) Overlay of consensus models for mtHsp60ATP and mtHsp60ATP-mtHsp10 structures, showing identical equatorial and intermediate domain conformations but a large upward apical domain rotation. (e) Model of the mtHsp10 mobile loop and associated mtHsp60 apical domain in the mtHsp60ATP-mtHsp10 consensus map, showing interaction of conserved hydrophobic residues with apical domain helices H and I. (f) Coulombic potential maps of protomers of mtHsp60 apo, mtHsp60ATP, and mtHsp60ATP-mtHsp10 consensus structures, showing increased negative charge in the inward-facing regions of mtHsp60ATP-mtHsp10. (g) Overlay of consensus models for mtHsp60ATP and mtHsp60ATP-mtHsp10 structures, showing highly similar inter-ring conformations.
Extended Data Fig. 5.
Extended Data Fig. 5.. Alignments of group I chaperonin amino acid sequences
Alignments of mature human (residues 27-end) and yeast (Saccharomyces cerevisiae, residues 26-end) mitochondrial Hsp60 and E. coli GroEL amino acid sequences. Residues mutated in this study are indicated (numbering corresponds to the human sequence). Cov = covariace relative to the human sequence, Pid = percent identity relative to the human sequence.
Fig.1.
Fig.1.. Biochemical and structural analysis of the mtHsp60V72I mutant
(a) Domain schematic and cartoon of an mtHsp60 protomer (ATP-bound consensus model). Location of the V72I mutation is indicated by a box, and the apical-intermediate domain hinge is marked (*). (b) SEC-MALS of mtHsp60 (black) and mtHsp60V72I (purple) without ATP (solid lines) and with ATP (dashed lines). Normalized differential refractive index (left y-axis) vs elution volume (x-axis) are shown. The average molecular weight of the heptamer peak of mtHsp60V72I and the monomer peak of mtHsp60 are shown and indicated by horizontal lines (kDa, right y-axis). (c) Enzymatic activity of chemically-denatured human mtMDH refolded by the mtHsp60-mtHsp10 system, as measured by the decrease in NADH (an mtMDH cofactor) absorbance at 340 nm (left panel, representative of three biological replicates). Dashed lines represent standard deviation of technical triplicates. Initial velocities of absorbance curves from three biological replicates are shown at right. Error bars represent standard error of the mean. *p < 0.05. Wild-type mtHsp60 (black) refolds mtMDH more efficiently than does V72I (purple). Native (green) and denatured mtMDH (mtMDHdenat) (orange) are shown for comparison. (d) Top and side view 2D class averages of client-bound and -unbound mtHsp60V72I heptamers. Client is indicated with a white arrow. Equatorial (+) and apical (^) domains are indicated in the side view average. Scale bar equals 100 Å. (e) Overlay of the sharpened (opaque) and unsharpened (transparent) mtHsp60apo consensus map, colored as in (b), showing high-resolution equatorial and intermediate domains and weak apical domain density. Lack of apical domain density in the sharpened map is indicated in the top view (#). (f) Detailed view of an apical domain from mtHsp60apo consensus, with the sharpened map (opaque) overlaid with the unsharpened map (transparent) and the fitted model. Helices H and I (dark purple) are particularly poorly resolved, indicating flexibility. (g) Cryo-EM processing workflow to obtain maps with client and asymmetric apical domain conformations. (h) Top view of the sharpened mtHsp60apo focus map, showing significantly improved apical domain features, colored as in (b). (i) (Left) heptamer cartoon showing apical domain rotation relative to the consensus map. Positive values (green) indicate an upward rotation (increasing equatorial-apical distance), negative values (red) indicate a downward rotation. (Right) unwrapped view of the apical domains of the unsharpened mtHsp60apo focus map, showing significant asymmetry in apical domain conformations, labeled as in (h), colored as in the cartoon. Dashed line indicates the apical domain position in the consensus map. (j) Slabbed side views of unsharpened additional refinements from the classification outlined in (g), showing unannotated density likely corresponding to client (yellow) present in multiple conformations in the mtHsp60 heptamer (purple). A dashed line (red) delimits apical and equatorial regions of mtHsp60.
Fig. 2.
Fig. 2.. ATP-induced mtHsp60V72I conformational changes and client contacts
(a) Top and side view 2D class averages of ATP-bound mtHsp60V72I. Arrow in top view indicates client density in folding cavity; asterisks in side view indicate poor apical domain resolution as compared to the equatorial and intermediate domains. Scale bar equals 100 Å. (b) Sharpened (opaque) and unsharpened (transparent) maps of consensus ATP-bound mtHsp60V72I, colored as in Fig. 1. Note complete loss of apical domain density (encircled) in sharpened map. The central density corresponding to client is colored yellow in the top view. (c) Cryo-EM processing workflow to obtain maps with asymmetric apical domain conformations. (d) mtHsp60ATP focus map, shown as unsharpened mtHsp60 density overlaid with segmented and 8 Å low-pass filtered client density. Note lack of density for one apical domain (encircled). (e) Models for representative ‘up’ (pink apical domain) and ‘down’ (purple apical domain) protomers, showing a rigid body rotation of the apical domain. Equatorial and intermediate domains are colored gray. The apical domain underlying segment (below helices H and I) is indicated (^). (f) Unwrapped view of the apical domains and client in the mtHsp60ATP focus map, showing alternating up/down apical domain conformations, shown as in (d). Note that client extensions (#) are only proximal to ‘down’ protomers (2, 4, 6), and the weak apical domain density for protomer 7 at the symmetry-mismatched interface. (g) Client (shown as in (d)) contact with a representative ‘down’ apical domain (model overlaid with transparent unsharpened map). Putative client-contacting residue are shown. (h) Client (shown as in (d)) contact with a representative equatorial domain (filtered map). Putatively client-contacting residue Trp42 is shown, as are the last resolved residues of the C-terminal tail.
Fig. 3.
Fig. 3.. Analysis of mtHsp10-bound mtHsp60 complexes
(a) Sharpened map of mtHsp60ATP-mtHsp10, mtHsp60 colored as in Fig. 1, mtHsp10 in brown. Note uniform quality of all mtHsp60 domains. (b) Nucleotide binding pocket of mtHsp60ATP-mtHsp10, showing density for ATP and the γ-phosphate thereof, and Mg2+ and K+ ions (gray, from sharpened map). (c) Cryo-EM processing workflow to obtain the mtHsp60ATP-mtHsp10 focus map. (d) Slabbed views of mtHsp60ATP-mtHsp10 focus map. mtHsp60/mtHsp10 density is shown as the sharpened map, colored as in (a), client is shown as a segmented and 8 Å low-pass filtered map. (e) Unwrapped view of the mtHsp60ATP-mtHsp10 focus map, showing client contact with multiple apical domains (encircled). mtHsp60 is shown as an unsharpened map (pink, opaque) overlaid with an 8 Å low-pass filtered map, and client is shown as in (d). (f) Enlarged view of client contact with a representative apical domain (both mtHsp60 and client maps are low-pass filtered to 8 Å). Residues putatively involved in client contact are labeled. (g) Enlarged view of client contact with the mtHsp60 C-terminal tails.
Fig. 4.
Fig. 4.. Functional analysis of putative client-contacting mtHsp60 residues
(a) Protomer of mtHsp60 from mtHsp60ATP-mtHsp10, showing residues mutated. (b) Conservation of residues in (a) among human and yeast mtHsp60 and GroEL. (c) Steady-state ATPase activity of mtHsp60 mutants vs concentration of mtHsp10. A representative experiment of three biological replicates is shown. Error bars represent standard deviation. (d) Enzymatic activity of chemically-denatured human mtMDH refolded by mtHsp60 mutants (left panel, representative of three biological replicates). Dashed lines represent standard deviation of technical triplicates. Initial velocities of absorbance curves from three biological replicates are shown at right. Error bars represent standard error of the mean. *p < 0.05, **p < 0.005, ns = not significant. (e) Analytical size exclusion chromatography traces of mtHsp60 mutants, showing complete monomerization of W42A, F279A, and Y359A mutants. (f) Model of two apo-mtHsp60 protomers, showing apical domain residues F279 and Y359 contacting the intermediate domain of an adjacent protomer.
Fig. 5.
Fig. 5.. Model of conformational changes in the client-engaged mtHsp60 reaction cycle
State 1: Apical domains (pink) of mtHsp60apo heptamers are flexible, and exhibit modest rotation about the apical-intermediate hinge, denoted by coloration of helices H and I. State 2: Client binding to mtHsp60apo preserves apical domain asymmetry, and client can localize to multiple depths of the heptamer, facilitated by mtHsp60 apical domains and the flexible C-terminal tails. State 3: ATP binding induces the dimerization of heptamers through the equatorial domains and a more pronounced apical domain asymmetry in an alternating up/down arrangement. Helices H and I in ‘down’ protomers (red) contact client, while those in ‘up’ protomers (green) are competent to bind mtHsp10. State 3a: mtHsp10 initially binds the mtHsp60 heptamer using the three upward-facing apical domains; all apical domains then transition to the conformation observed in the mtHsp10-bound complex (state 4). After ATP hydrolysis and client folding (state 5), client, mtHsp10, and ADP are released, and the double-ring complex disassociates into heptamers.

References

    1. Balchin D., Hayer-Hartl M., and Hartl F.U. (2016). In vivo aspects of protein folding and quality control. Science 353, aac4354. 10.1126/science.aac4354. - DOI - PubMed
    1. Horwich A.L., and Fenton W.A. (2020). Chaperonin-assisted protein folding: a chronologue. Q Rev Biophys 53, e4. 10.1017/s0033583519000143. - DOI - PubMed
    1. Yébenes H., Mesa P., Muñoz I.G., Montoya G., and Valpuesta J.M. (2011). Chaperonins: two rings for folding. Trends Biochem Sci 36, 424–432. 10.1016/j.tibs.2011.05.003. - DOI - PubMed
    1. Lopez T., Dalton K., and Frydman J. (2015). The Mechanism and Function of Group II Chaperonins. J Mol Biol 427, 2919–2930. 10.1016/j.jmb.2015.04.013. - DOI - PMC - PubMed
    1. Hayer-Hartl M., Bracher A., and Hartl F.U. (2016). The GroEL–GroES Chaperonin Machine: A Nano-Cage for Protein Folding. Trends Biochem Sci 41, 62–76. 10.1016/j.tibs.2015.07.009. - DOI - PubMed

Publication types