. 2023 May 24:17:1207350.
doi: 10.3389/fncel.2023.1207350. eCollection 2023.

Cell-specific transcriptome changes in the hypothalamic arcuate nucleus in a mouse deoxycorticosterone acetate-salt model of hypertension

Affiliations

Cell-specific transcriptome changes in the hypothalamic arcuate nucleus in a mouse deoxycorticosterone acetate-salt model of hypertension

Valerie A Wagner et al. Front Cell Neurosci. .

Abstract

A common preclinical model of hypertension characterized by low circulating renin is the "deoxycorticosterone acetate (DOCA)-salt" model, which influences blood pressure and metabolism through mechanisms involving the angiotensin II type 1 receptor (AT1R) in the brain. More specifically, AT1R within Agouti-related peptide (AgRP) neurons of the arcuate nucleus of the hypothalamus (ARC) has been implicated in selected effects of DOCA-salt. In addition, microglia have been implicated in the cerebrovascular effects of DOCA-salt and angiotensin II. To characterize DOCA-salt effects upon the transcriptomes of individual cell types within the ARC, we used single-nucleus RNA sequencing (snRNAseq) to examine this region from male C57BL/6J mice that underwent sham or DOCA-salt treatment. Thirty-two unique primary cell type clusters were identified. Sub-clustering of neuropeptide-related clusters resulted in identification of three distinct AgRP subclusters. DOCA-salt treatment caused subtype-specific changes in gene expression patterns associated with AT1R and G protein signaling, neurotransmitter uptake, synapse functions, and hormone secretion. In addition, two primary cell type clusters were identified as resting versus activated microglia, and multiple distinct subtypes of activated microglia were suggested by sub-cluster analysis. While DOCA-salt had no overall effect on total microglial density within the ARC, DOCA-salt appeared to cause a redistribution of the relative abundance of activated microglia subtypes. These data provide novel insights into cell-specific molecular changes occurring within the ARC during DOCA-salt treatment, and prompt increased investigation of the physiological and pathophysiological significance of distinct subtypes of neuronal and glial cell types.

Keywords: AgRP neurons; DOCA-salt; arcuate nucleus; microglia; mouse; snRNAseq.


Conflict of interest statement

The authors declare that the research was conducted in the absence of any commercial or financial relationships that could be construed as a potential conflict of interest.

Figures

FIGURE 1
FIGURE 1
Deoxycorticosterone acetate (DOCA)-salt caused expected physiological effects. (A) Body mass gains. Age p < 0.01, DOCA-salt p < 0.01, Age × DOCA-salt p < 0.01. (B) Body composition. Fat: Age p < 0.01, DOCA-salt p = 0.02, Age x DOCA-salt p < 0.01. Fat-free mass: Age p = 0.26, DOCA-salt p = 0.10, Age × DOCA-salt p < 0.01. (C) Hydration status. Total body water: Age p = 0.26, DOCA-salt p = 0.10, Age × DOCA-salt p < 0.01. Hydration: Age p < 0.01, DOCA-salt p < 0.01, Age × DOCA-salt p < 0.01. (D) Plasma sodium (Na), blood urea nitrogen (BUN), and hematocrit. For all panels, n = 7 Sham, eight DOCA-salt male C57BL/6J. Data are presented as mean ± SEM and analyzed by two-way ANOVA and Šídák multiple comparison procedure or two-tailed independent t-test; *p < 0.05.
FIGURE 2
FIGURE 2
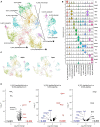
Deoxycorticosterone acetate (DOCA)-salt treatment induces differential expression of genes in individual cell types of the arcuate nucleus of the hypothalamus (ARC). (A) Uniform manifold approximation and projection (UMAP) plot of nuclei clusters identified by Seurat. (B) Expression of top marker genes that uniquely identify clusters. (C) UMAP plot of nuclei clusters, split by condition (Sham, DOCA-salt) with circles highlighting missing C15, C24, C26 clusters within the Sham dataset. (D) Differential gene expression counts by cluster between DOCA-salt and Sham conditions in all analyzed clusters (C15, C24, and C26 not analyzed due to poor representation from Sham datasets) except neuropeptide-related clusters (C12, C16, C17, C19, and C22).
FIGURE 3
FIGURE 3
Sub-clustering of neuropeptide-related cell types reveals three subtypes of Agouti-related peptide (AgRP) neurons. (A) Uniform manifold approximation and projection (UMAP) plot of neuropeptide-related subclusters identified by Seurat with AgRP subtypes noted with an asterisk (*). (B) Expression of top marker genes that uniquely identify subclusters. (C) UMAP plot of nuclei sub-clusters, split by condition [Sham, deoxycorticosterone acetate (DOCA)-salt]. (D) Volcano plots of differentially expressed genes between pairs of the three AgRP neuronal subtypes N_SC0_Agrp/Npy/Sst/Lrp1b (red), N_SC2_Agrp/Npy/Acvr1c (black), and N_SC9_Agrp/Npy (blue).
FIGURE 4
FIGURE 4
Deoxycorticosterone acetate (DOCA)-salt treatment differentially alters transcriptomes within Agouti-related peptide (AgRP) neuronal subtypes. (A) Differentially expressed genes between DOCA-salt and Sham conditions in N_SC0_Agrp/Npy/Sst/Lrp1b. Genes for the Reactome enrichment term G alpha q signaling events shown in red. (B) Differentially expressed genes between DOCA-salt and Sham conditions in N_SC2_Agrp/Npy/Acvr1c. Genes for GO Molecular Function enrichment term GABA-gated chloride ion channel activity shown in red, and for the Reactome term Microtubule-dependent trafficking of connexons from Golgi to the plasma membrane in blue. (C) Differentially expressed genes between DOCA-salt and Sham conditions in N_SC9_Agrp/Npy. Genes for GO Biological Process term Regulation of catecholamine secretion shown in red, and for KEGG term GABAergic synapse in blue.
FIGURE 5
FIGURE 5
Deoxycorticosterone acetate (DOCA)-salt treatment alters transcriptomes of both resting and active microglia. (A) Differentially expressed genes between C23 and C25. The top eight genes enriched in C23 are shown in red and in C25 are shown in black. (B) Differentially expressed genes between DOCA-salt and Sham conditions in C23. Genes for Gene Ontology Biological Process (GOBP) term Neuropeptide signaling pathway are shown in red and for GO Molecular Function term Volume-sensitive chloride channel activity are shown in blue. (C) Differentially expressed genes between DOCA-salt and Sham conditions in C25. Genes for GO Molecular Function terms Calcium ion binding involved in regulation of cytosolic calcium ion concentration, Netrin receptor activity, and Lamin binding are shown in red, blue, and orange, respectively. (D) Percent DOCA-salt and Sham contributions of nuclei to the entire dataset, to both microglia clusters, to C23_Microglia 1, and to C25_Microglia 2. Deviation from dataset percentages determined by Chi-square test, *p < 0.05.
FIGURE 6
FIGURE 6
Deoxycorticosterone acetate (DOCA)-salt treatment appears to shift subtypes of activated microglia. (A) Uniform manifold approximation and projection (UMAP) plot of nuclei subclusters identified by Seurat within C25_Microglia 2. (B) Expression of the top two marker genes that uniquely identify subclusters within C25. (C) UMAP plot of nuclei clusters, split by condition (Sham, DOCA-salt). Circles highlight the absence of subclusters within each condition.

References

    1. Belanger K. M., Crislip G. R., Gillis E. E., Abdelbary M., Musall J. B., Mohamed R., et al. (2020). Greater T regulatory cells in females attenuate DOCA-salt-induced increases in blood pressure versus males. Hypertension 75 1615–1623. 10.1161/HYPERTENSIONAHA.119.14089 - DOI - PMC - PubMed
    1. Brunet Avalos C., Sprecher S. G. (2021). Single-cell transcriptomic reveals dual and multi-transmitter use in neurons across metazoans. Front. Mol. Neurosci. 14:623148. 10.3389/fnmol.2021.623148 - DOI - PMC - PubMed
    1. Buffolo F., Monticone S., Pecori A., Pieroni J., Losano I., Cavaglià G., et al. (2020). The spectrum of low-renin hypertension. Best Pract. Res. Clin. Endocrinol. Metab. 34:101399. - PubMed
    1. Campbell J. N., Macosko E. Z., Fenselau H., Pers T. H., Lyubetskaya A., Tenen D., et al. (2017). A molecular census of arcuate hypothalamus and median eminence cell types. Nat. Neurosci. 20 484–496. 10.1038/nn.4495 - DOI - PMC - PubMed
    1. Campión J., Lahera V., Cachofeiro V., Maestro B., Dávila N., Carranza M. C., et al. (1998). In vivo tissue specific modulation of rat insulin receptor gene expression in an experimental model of mineralocorticoid excess. Mol. Cell Biochem. 185 177–182. 10.1023/a:1006871309864 - DOI - PubMed