. 2023 May 24:17:1173579.
doi: 10.3389/fncel.2023.1173579. eCollection 2023.

Starburst amacrine cells form gap junctions in the early postnatal stage of the mouse retina

Affiliations

Starburst amacrine cells form gap junctions in the early postnatal stage of the mouse retina

Takuma Maruyama et al. Front Cell Neurosci. .

Abstract

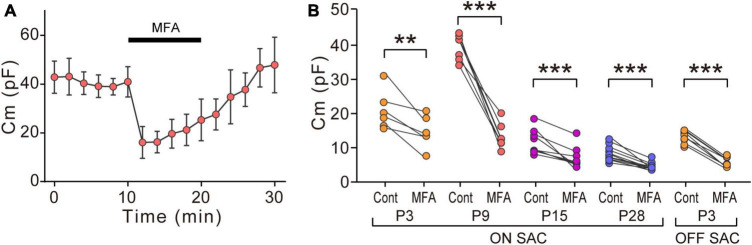
Although gap junctional coupling in the developing retina is important for the maturation of neuronal networks, its role in the development of individual neurons remains unclear. Therefore, we herein investigated whether gap junctional coupling by starburst amacrine cells (SACs), a key neuron for the formation of direction selectivity, occurs during the developmental stage in the mouse retina. Neurobiotin-injected SACs coupled with many neighboring cells before eye-opening. The majority of tracer-coupled cells were retinal ganglion cells, and tracer coupling was not detected between SACs. The number of tracer-coupled cells significantly decreased after eye-opening and mostly disappeared by postnatal day 28 (P28). Membrane capacitance (Cm), an indicator of the formation of electrical coupling with gap junctions, was larger in SACs before than after eye-opening. The application of meclofenamic acid, a gap junction blocker, reduced the Cm of SACs. Gap junctional coupling by SACs was regulated by dopamine D1 receptors before eye-opening. In contrast, the reduction in gap junctional coupling after eye-opening was not affected by visual experience. At the mRNA level, 4 subtypes of connexins (23, 36, 43, and 45) were detected in SACs before eye-opening. Connexin 43 expression levels significantly decreased after eye-opening. These results indicate that gap junctional coupling by SACs occurs during the developmental period and suggest that the elimination of gap junctions proceeds with the innate system.

Keywords: connexin (Cx); development; dopamine D1 receptor (D1R); gap junction; retina; retinal ganglion cell (RGC); starburst amacrine cells (SACs); visual experience.


Conflict of interest statement

The authors declare that the research was conducted in the absence of any commercial or financial relationships that could be construed as a potential conflict of interest.

Figures

FIGURE 1
FIGURE 1
Developmental changes in membrane capacitance (Cm) in SACs. (A) Traces showing a capacitive current (top, blue area) to command the voltage step pulse (steps of –2 mV with a duration of 10 ms) (bottom). (B,C) Box plot of developmental changes in Cm in ON-type SACs (B) and OFF-type SACs (C). Whiskers show maximum and minimum values, boxes show lower and upper quartiles, and horizontal lines correspond to the median. Each dot is an individual cell. The numbers of mice used were 4 (P3), 3 (P9), 3 (P15), and 4 (P28) for ON-type SACs, and 6 (P3), 3 (P9), 3 (P15), and 4 (P28) for OFF-type SACs. n.s., not significant; *p < 0.05; **p < 0.01; ***p < 0.001 (Kruskal–Wallis tests with the Steel-Dwass test).
FIGURE 2
FIGURE 2
Developmental changes in the number of dye-coupled cells in ON-type SACs. Fluorescent images of Neurobiotin (NB)-injected ON-type SACs. (A,H) Projected images of NB-injected ON-type SACs (white arrow), brightly labeled dye-coupled cells (first-order direct connections, white arrowheads), and dimly labeled dye-coupled cells that may include second-order connections (gray arrowheads) at P9 and P28. Left: NB (red), middle: DAPI (cyan), right: merged image. (B) Higher magnification images within the white square of (A). Cross-section images of horizontal and vertical line positions are also shown (bottom and right). (C) Schematic diagram of the projection range in (A,B,H). The projected range is shown in the black rectangle. (D) Numbers of dye-coupled cells at P9 and P28. Each dot is the number of dye-coupled cells for each NB-injected SAC. ***p < 0.001 (the Mann–Whitney test). (E,F,I,J) Single optical sections of NB-injected ON-type SACs and dye-coupled cells in the ganglion cell layer (GCL). (E,F) Immunoreactivity for GFP (green) at P9 (E) and P28 (F). NB-injected SACs (white arrow) and tracer-coupled cells are shown (red). These NB-injected cells are the same cells shown in the upper or lower panels of figure (A), respectively. (G) Schematic diagram of the confocal plane in (E,F,H,I). (I,J) Immunoreactivity for GFP (green) (I) or RBPMS (cyan) (J) at P9. NB-injected SACs (white arrow) and tracer-coupled cells are shown (red). The fluorescence of NB colocalized with the soma of RBPMS-immunoreactive cells is shown by arrowheads, while a cell not colocalized with RBPMS is shown by an empty arrowhead. NB-injected cells are the same cells shown in figure (H). (K) Percentage of tracer-coupled cells with SAC or RBPMS at P9. Each dot is the percentage of dye-coupled cells with GFP or RBPMS immunoreactivity for each NB-injected SAC. The numbers of mice used were 13 (P9) and 9 (P28). Scale bars are 50 μm for (A,E,F,H,I,J), and 10 μm for (B).
FIGURE 3
FIGURE 3
Effects of MFA on Cm in SACs. (A) Effects of 300 μM MFA on Cm in ON-type SACs at P9. Data represent the mean ± SD. (B) Summary of the effects of MFA on Cm at P3, P9, P15, and P28 in ON-type SACs and at P3 in OFF-type SACs. Control, the average of Cm values sampled 5–10 min after the start of experiments (before the application of MFA); MFA, the Cm value sampled when the effects of MFA peaked after its application. Each dot is an individual cell. The numbers of mice used were 5 (P3), 6 (P9), 4 (P15), and 6 (P28) for ON-type SACs, and 6 (P3) for OFF-type SACs. **p < 0.01; ***p < 0.001 (One-tailed paired t-test).
FIGURE 4
FIGURE 4
Quantitative analysis of connexin transcripts in SACs. (A) Collection of EGFP-labeled SACs from the mouse retina at P9 by FACS. The inside of the green dotted rectangle was sampled as EGFP-expressing SACs. FITC: fluorescein isothiocyanate, PE: phycoerythrin. (B) Threshold cycle (Ct) values of EGFP mRNA in SACs at P9 and P28. (C) Relative mRNA expression levels of connexin family members: Gje1 (Cx23), Gjd2 (Cx36), Gja1 (Cx43), and Gjc1 (Cx45). Data were normalized by the expression level of EGFP. The numbers of animals were 4 (P9) and 5 (P28). Data are shown as the mean ± SEM; n.s., not significant; *p < 0.05 (the Mann–Whitney test).
FIGURE 5
FIGURE 5
Effects of dopaminergic inputs on Cm in ON-type SACs. (A) Relative mRNA expression levels of Drd1 in SACs at P9 and P28. The mRNA expression level of EGFP was used as an internal standard. EGFP-expressing cells were collected using flow cytometry. The numbers of animals were 4 (P9) and 5 (P28). Data are shown as the mean ± SEM. n.s., not significant (the Mann–Whitney test). (B,D) Effects of 10 μM SKF38393 (SKF, B) and 10 μM SCH23390 (SCH, D) on Cm at P9 (red circle) and P28 (blue circle). Data are shown as the mean ± SD. (C,E) Summary of the effects of SKF38393 and SCH23390 on Cm. Control, average Cm values sampled 5–10 min after the start of experiments (before drug application); SKF and SCH, the Cm value when the effects of SKF or SCH peaked during drug application. Each dot is an individual cell. The numbers of mice used were 4 (P9) and 4 (P28) for the SKF application, and 3 (P9) and 3 (P28) for the SCH application. Data in (B,D) represent the mean ± SD; n.s., not significant; **p < 0.01 (One-tailed paired t-test).
FIGURE 6
FIGURE 6
Effects of dark rearing on Cm in ON-type SACs. Effects of dark rearing on Cm in ON-type SACs at P9 and P15. The Cm for each condition is shown by a box plot. Whiskers show maximum and minimum values, boxes show lower and upper quartiles, and horizontal lines correspond to the median. Each dot is an individual cell. The numbers of mice used were 6 (LR) and 3 (DR) at P9 and 5 (LR) and 3 (DR) at P15. LR, mice reared under normal light/dark cycle conditions; DR, mice reared under dark conditions; n.s., not significant (the Mann–Whitney test).

Similar articles

Cited by

References

    1. Amthor F. R., Keyser K. T., Dmitrieva N. A. (2002). Effects of the destruction of starburst-cholinergic amacrine cells by the toxin AF64A on rabbit retinal directional selectivity. Vis. Neurosci. 19 495–509. 10.1017/S0952523802194119 - DOI - PubMed
    1. Arroyo D. A., Kirkby L. A., Feller M. B. (2016). Retinal waves modulate an intraretinal circuit of intrinsically photosensitive retinal ganglion cells. J. Neurosci. 36 6892–6905. 10.1523/JNEUROSCI.0572-16.2016 - DOI - PMC - PubMed
    1. Bando Y., Ishibashi M., Yamagishi S., Fukuda A., Sato K. (2022). Orchestration of ion channels and transporters in neocortical development and neurological disorders. Front. Neurosci. 16:827284. 10.3389/fnins.2022.827284 - DOI - PMC - PubMed
    1. Banerjee S., Wang Q., Zhao F., Tang G., So C., Tse D., et al. (2020). Increased connexin36 phosphorylation in AII amacrine cell coupling of the mouse myopic retina. Front. Cell. Neurosci. 14:124. 10.3389/fncel.2020.00124 - DOI - PMC - PubMed
    1. Becker D. L., Mobbs P. (1999). Connexin alpha1 and cell proliferation in the developing chick retina. Exp. Neurol. 156 326–332. 10.1006/exnr.1999.7027 - DOI - PubMed