. 2023 May 24:15:1120846.
doi: 10.3389/fnagi.2023.1120846. eCollection 2023.

Discrete Ricci curvatures capture age-related changes in human brain functional connectivity networks

Affiliations

Discrete Ricci curvatures capture age-related changes in human brain functional connectivity networks

Yasharth Yadav et al. Front Aging Neurosci. .

Abstract

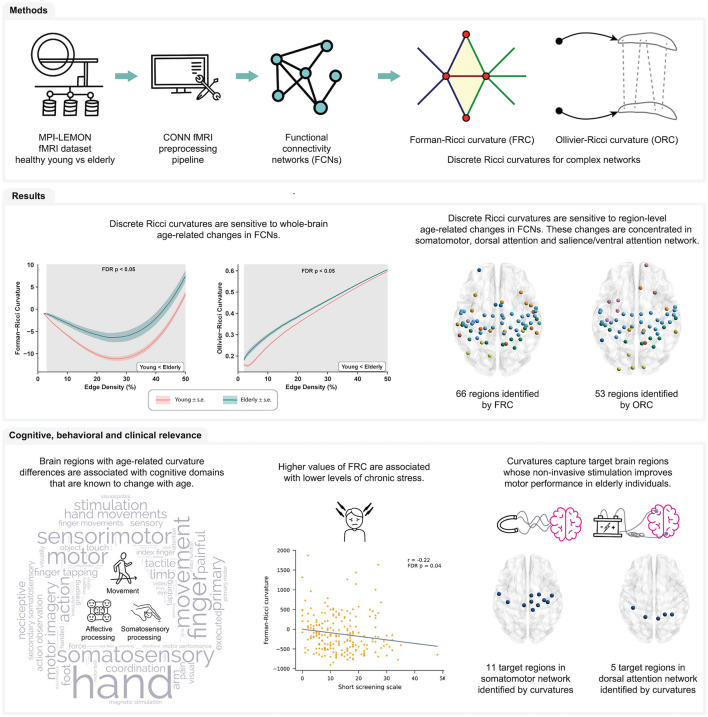
Introduction: Geometry-inspired notions of discrete Ricci curvature have been successfully used as markers of disrupted brain connectivity in neuropsychiatric disorders, but their ability to characterize age-related changes in functional connectivity is unexplored.

Methods: We apply Forman-Ricci curvature and Ollivier-Ricci curvature to compare functional connectivity networks of healthy young and older subjects from the Max Planck Institute Leipzig Study for Mind-Body-Emotion Interactions (MPI-LEMON) dataset (N = 225).

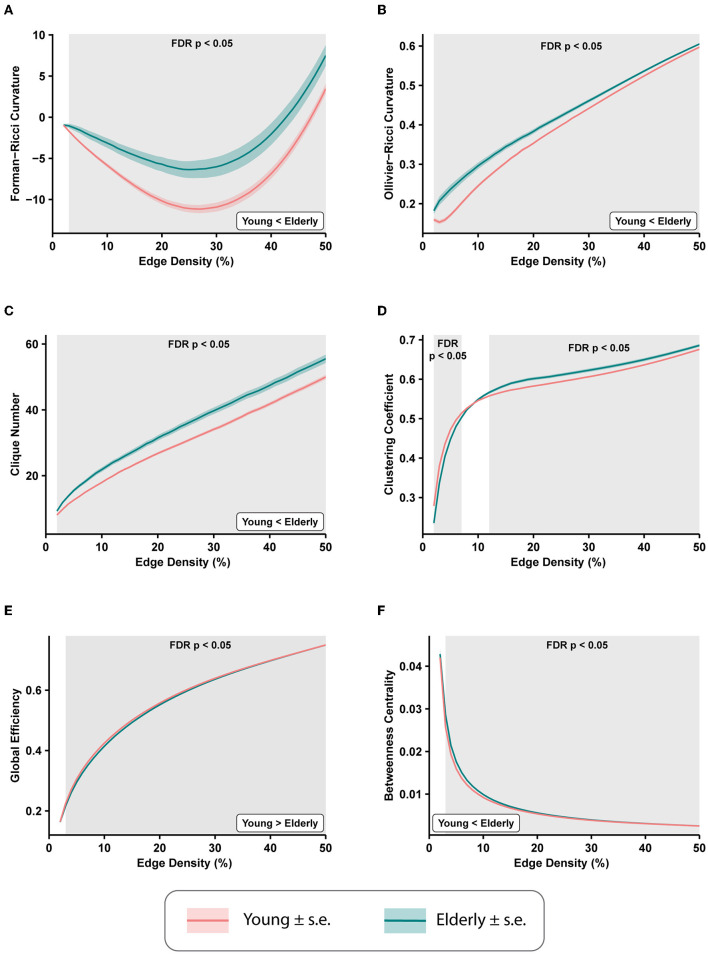
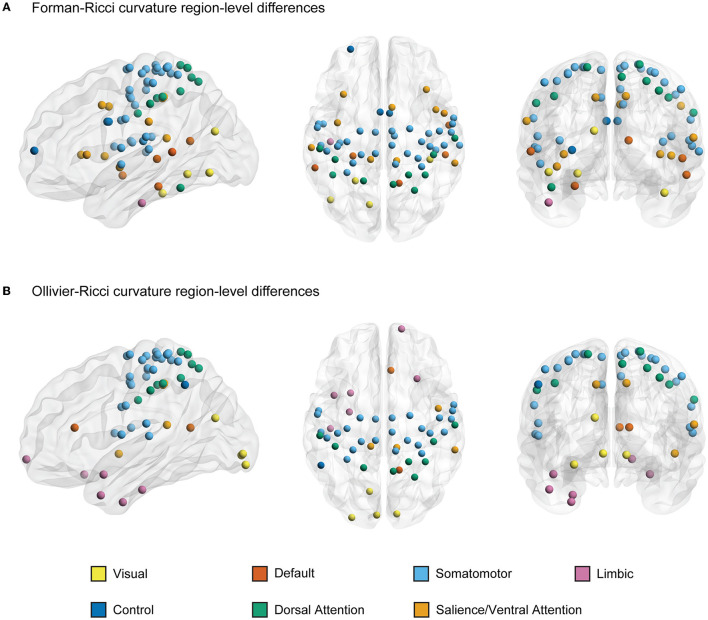
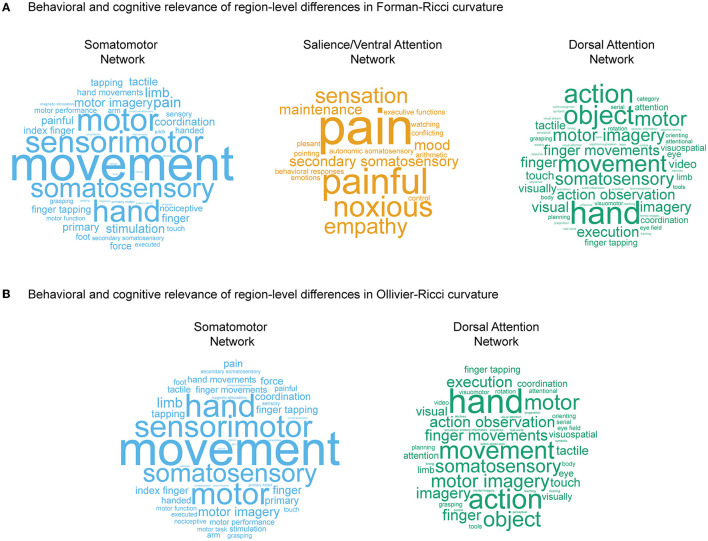
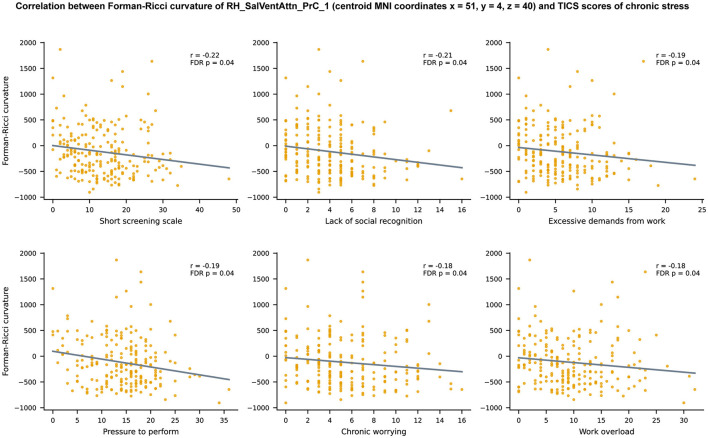
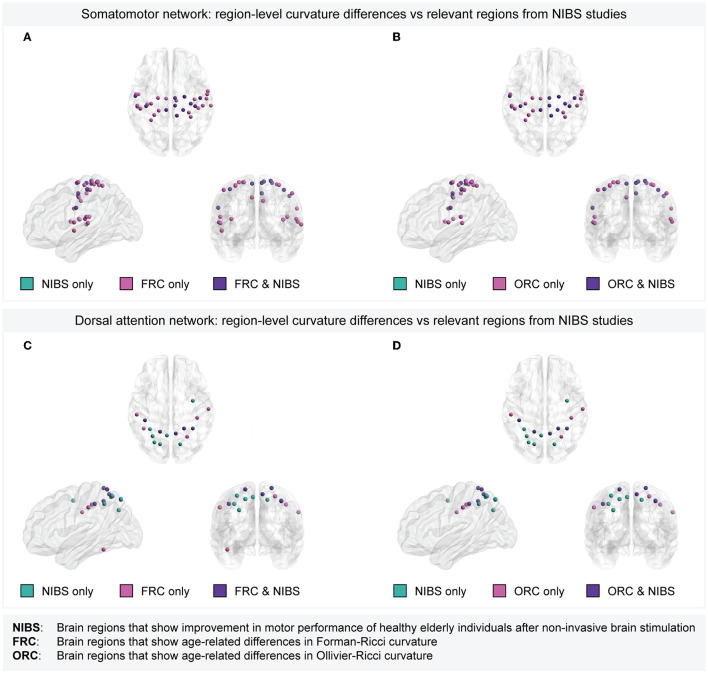
Results: We found that both Forman-Ricci curvature and Ollivier-Ricci curvature can capture whole-brain and region-level age-related differences in functional connectivity. Meta-analysis decoding demonstrated that those brain regions with age-related curvature differences were associated with cognitive domains known to manifest age-related changes-movement, affective processing, and somatosensory processing. Moreover, the curvature values of some brain regions showing age-related differences exhibited correlations with behavioral scores of affective processing. Finally, we found an overlap between brain regions showing age-related curvature differences and those brain regions whose non-invasive stimulation resulted in improved movement performance in older adults.

Discussion: Our results suggest that both Forman-Ricci curvature and Ollivier-Ricci curvature correctly identify brain regions that are known to be functionally or clinically relevant. Our results add to a growing body of evidence demonstrating the sensitivity of discrete Ricci curvature measures to changes in the organization of functional connectivity networks, both in health and disease.

Keywords: Forman-Ricci curvature; MPI-LEMON; Ollivier-Ricci curvature; functional connectivity networks; healthy aging; motor performance; non-invasive brain stimulation; resting-state fMRI.


Conflict of interest statement

The authors declare that the research was conducted in the absence of any commercial or financial relationships that could be construed as a potential conflict of interest.

Figures

Figure 1
Figure 1
Summary of workflow and main results obtained in this study. Raw rs-fMRI scans of young participants and elderly participants were obtained from the MPI-LEMON dataset and preprocessed using the CONN toolbox. The preprocessed rs-fMRI scan of each participant was used to construct resting state functional connectivity networks (FCNs) at varying edge densities. Next, we computed and compared Forman-Ricci curvature (FRC) and Ollivier-Ricci curvature (ORC) across the FCNs of the young and elderly groups. We found that both FRC and ORC show whole-brain and region-level differences in the FCNs of young and elderly participants. Additionally, we found that age-related differences in FRC and ORC are associated with the cognitive domains of movement, affective processing and somatosensory processing. Notably, node FRC shows a significant negative correlation with behavioral test scores of chronic stress. Finally, we showed that FRC and ORC can capture brain regions whose non-invasive stimulation is known to improve motor performance of older adults.
Figure 2
Figure 2
Differences in average edge curvatures and standard global network measures across the functional connectivity networks (FCNs) of 153 young individuals and 72 elderly individuals from the MPI-LEMON dataset. The differences are reported for FCNs over the range of edge densities 0.02 (i.e., 2% edges) and 0.5 (i.e., 50% edges), with an increment of 0.01 (i.e., 1% edges). The shaded regions in each plot correspond to the edge densities where the between-group differences are statistically significant (p < 0.05, FDR-corrected). (A) Average Forman-Ricci curvature (FRC) of edges is higher in elderly individuals over edge densities 3–50%. (B) Average Ollivier-Ricci curvature (ORC) of edges is higher in elderly individuals over the entire range of edge densities considered (2–50%). (C) Clique number is higher in elderly individuals over all edge densities 2–50%. (D) Average clustering coefficient is higher in young individuals over edge densities 2–7%, and higher in elderly individuals over edge densities 12–50%. (E) Global efficiency is reduced in elderly individuals over edge densities 3–50%. (F) Average node betweenness centrality is higher in elderly individuals over edge densities 3–49%.
Figure 3
Figure 3
A visual representation of nodes or regions in the brain that show significant differences in discrete Ricci curvatures between the functional connectivity networks (FCNs) of young and elderly individuals (p < 0.05, FDR corrected). (A) 66 regions that show significant differences in Forman-Ricci curvature (FRC) of the nodes in the FCNs of the young and elderly groups. All the 66 regions display higher values of node FRC for elderly individuals compared to young individuals. (B) 53 regions that show significant differences in Ollivier-Ricci curvature (ORC) of the nodes in the FCNs of the young and elderly groups. 41 out of these 53 regions display higher values of node ORC in elderly individuals and the remaining 12 ROIs display higher values of node ORC in young individuals. The nodes are specified by the Schaefer atlas, and color-coded as per the 7 resting state networks (RSNs) listed in the figure legend. This figure was created using BrainNet Viewer (Xia et al., 2013). Supplementary Table 5 lists the FDR corrected p-values corresponding to curvature-related differences in each region.
Figure 4
Figure 4
Behavioral and cognitive relevance of age-related region-level differences in curvatures. (A) Word clouds displaying cognitive and behavioral terms associated with brain regions having age-related differences in values of Forman-Ricci curvature (FRC), in three RSNs, namely somatomotor network, salience/ventral attention network, and dorsal attention network. (B) Word clouds displaying cognitive and behavioral terms associated with brain regions having age-related differences in values of Ollivier-Ricci curvature (ORC), in two RSNs, namely somatomotor network and dorsal attention network. The size of the terms in each word cloud is proportional to their frequency of occurrence. Note that size of the terms in each word cloud are scaled separately, and thus, frequencies of occurrence cannot be compared across word clouds. The word clouds in this figure are generated using https://www.wordclouds.com.
Figure 5
Figure 5
Scatter plots depicting the relationship between Forman-Ricci curvature (FRC) of the brain region RH_SalVentAttn_PrC_1 and 6 TICS scores of chronic stress namely, Short Screening Scale for Chronic Stress (SSCS), lack of social recognition, excessive demands from work, pressure to perform, chronic worrying, and work overload. Note that only the scatter plots corresponding to significant correlations r between FRC of RH_SalVentAttn_PrC_1 and TICS scores (p < 0.05, FDR corrected) are shown in this figure. Each plot displays a line describing the linear relationship between FRC of RH_SalVentAttn_PrC_1 and the corresponding TICS score, estimated using the least squares method. The brain region is named according to the labeling scheme provided in the Schaefer atlas (Schaefer et al., 2018).
Figure 6
Figure 6
Overlap between brain regions with age-related curvature differences and target regions whose non-invasive stimulation resulted in improved motor performance of healthy elderly individuals. (A) Within the somatomotor network, overlap between the set of 33 Schaefer ROIs with age-related differences in Forman-Ricci curvature (FRC) and 11 Schaefer ROIs corresponding to the target regions used in tDCS/tACS/TMS experiments. All the 11 ROIs corresponding to the target regions show age-related differences in FRC. (B) Within the somatomotor network, overlap between the set of 27 Schaefer ROIs with age-related differences in Ollivier-Ricci curvature (ORC) and 11 Schaefer ROIs corresponding to the target regions used in tDCS/tACS/TMS experiments. All the 11 ROIs corresponding to the target regions show age-related differences in ORC. (C) Within the dorsal attention network, overlap between the set of 10 Schaefer ROIs with age-related differences in FRC and 12 Schaefer ROIs corresponding to the target regions used in tDCS/tACS/TMS experiments. Five out of the 12 ROIs corresponding to the target regions show age-related differences in FRC. (D) Within the dorsal attention network, overlap between the set of 9 Schaefer ROIs with age-related differences in ORC and 12 Schaefer ROIs corresponding to the target regions used in tDCS/tACS/TMS experiments. Five out of the 12 ROIs corresponding to the target regions show age-related differences in ORC. Note that the set of brain regions in each subfigure is partitioned into the following three subsets. Regions that are relevant according to non-invasive stimulation studies but do not show age-related curvature differences (labeled as “NIBS only”), regions that show age-related curvature differences but lack evidence from non-invasive stimulation studies (labeled as “FRC only” or “ORC only”), and regions that show both age-related curvature differences as well as relevance according to non-invasive stimulation studies (labeled as “FRC & NIBS” or “ORC & NIBS”). In (A, B), there are no regions labeled “NIBS only” since all the regions in the somatomotor network that are relevant according to non-invasive stimulation studies also show age-related differences in FRC and ORC, respectively.

Similar articles

References

    1. Achard S., Bullmore E. (2007). Efficiency and cost of economical brain functional networks. PLoS Comput. Biol. 3, e17. 10.1371/journal.pcbi.0030017 - DOI - PMC - PubMed
    1. Achard S., Delon-Martin C., Vértes P. E., Renard F., Schenck M., Schneider F., et al. . (2012). Hubs of brain functional networks are radically reorganized in comatose patients. Proc. Natl. Acad. Sci. U.S.A. 109, 20608–20613. 10.1073/pnas.1208933109 - DOI - PMC - PubMed
    1. Addis D. R., Barense M., Duarte A. (2015). The Wiley Handbook on the Cognitive Neuroscience of Memory. John Wiley & Sons. 10.1002/9781118332634 - DOI
    1. Andersson J. L., Hutton C., Ashburner J., Turner R., Friston K. (2001). Modeling geometric deformations in EPI time series. NeuroImage 13, 903–919. 10.1006/nimg.2001.0746 - DOI - PubMed
    1. Ashburner J., Friston K. J. (2005). Unified segmentation. NeuroImage 26, 839–851. 10.1016/j.neuroimage.2005.02.018 - DOI - PubMed

LinkOut - more resources