. 2023 Mar 3;4(2):350-369.
doi: 10.1007/s42761-023-00181-6. eCollection 2023 Jun.

How Pain-Related Facial Expressions Are Evaluated in Relation to Gender, Race, and Emotion

Affiliations

How Pain-Related Facial Expressions Are Evaluated in Relation to Gender, Race, and Emotion

Troy C Dildine et al. Affect Sci. .

Abstract

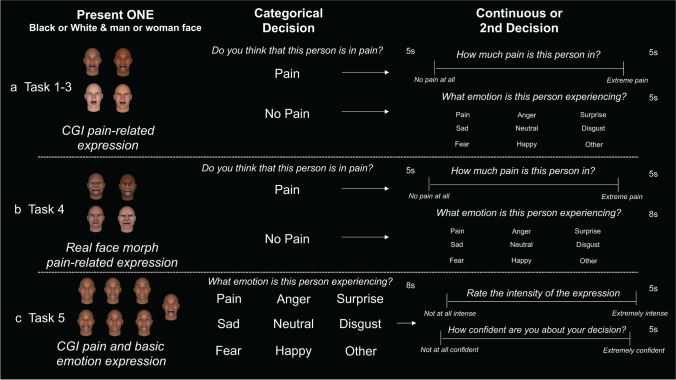
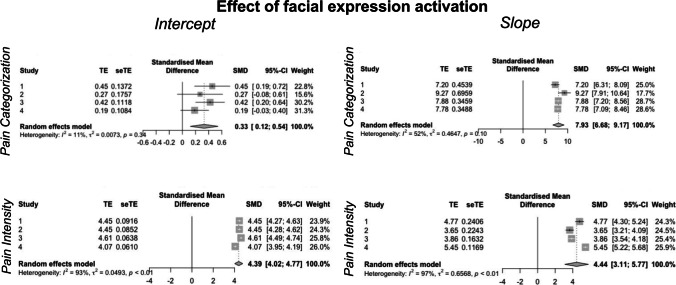
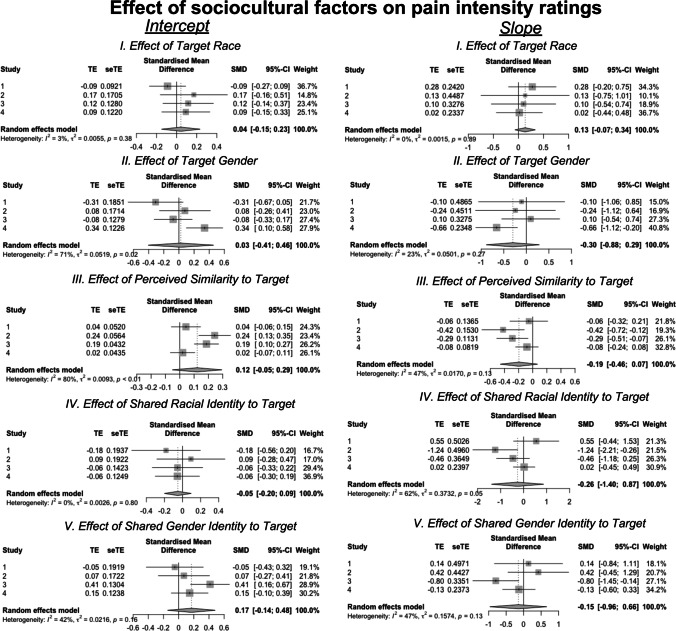
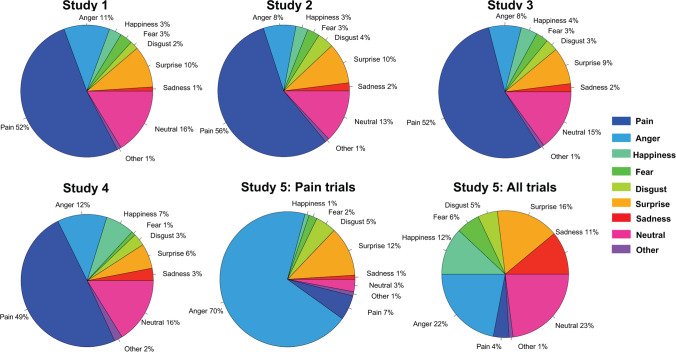
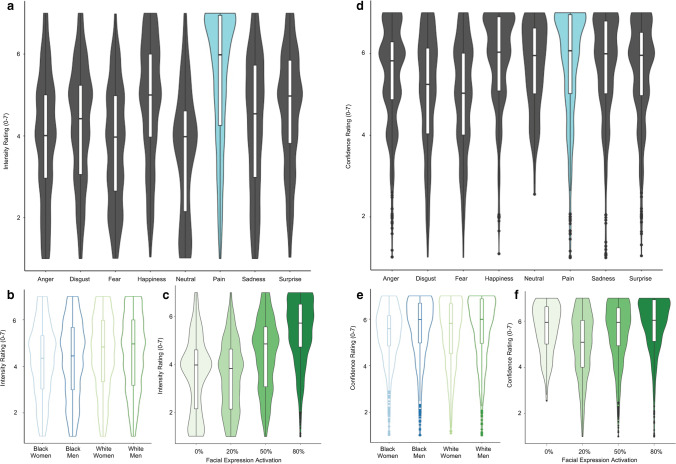
Inequities in pain assessment are well-documented; however, the psychological mechanisms underlying such biases are poorly understood. We investigated potential perceptual biases in the judgments of faces displaying pain-related movements. Across five online studies, 956 adult participants viewed images of computer-generated faces ("targets") that varied in features related to race (Black and White) and gender (women and men). Target identity was manipulated across participants, and each target had equivalent facial movements that displayed varying intensities of movement in facial action-units related to pain (Studies 1-4) or pain and emotion (Study 5). On each trial, participants provided categorical judgments as to whether a target was in pain (Studies 1-4) or which expression the target displayed (Study 5) and then rated the perceived intensity of the expression. Meta-analyses of Studies 1-4 revealed that movement intensity was positively associated with both categorizing a trial as painful and perceived pain intensity. Target race and gender did not consistently affect pain-related judgments, contrary to well-documented clinical inequities. In Study 5, in which pain was equally likely relative to other emotions, pain was the least frequently selected emotion (5%). Our results suggest that perceivers can utilize facial movements to evaluate pain in other individuals, but perceiving pain may depend on contextual factors. Furthermore, assessments of computer-generated, pain-related facial movements online do not replicate sociocultural biases observed in the clinic. These findings provide a foundation for future studies comparing CGI and real images of pain and emphasize the need for further work on the relationship between pain and emotion.

Supplementary information: The online version contains supplementary material available at 10.1007/s42761-023-00181-6.

Keywords: Emotion recognition; Facial expressions; Health inequities; Pain assessment.


Conflict of interest statement

Conflict of InterestThe authors declare no competing interests.

Figures

Fig. 1
Fig. 1
Task schematic. (a) Participants were presented with one of four sociodemographic subgroup CGI faces (Black man, Black woman, White man, or White woman). Participants first made a categorical rating of whether they believed the face they were presented was in pain or not. Participants had 5 s to make this rating. If participants chose “No pain,” then they rated whether the individual was experiencing a different emotion or feeling neutral. If participants selected “Pain,” they used a continuous scale to rate how much pain they believed the person was in. (b) Participants were presented one of four sociodemographic subgroup faces. Each subgroup included 3 exemplars presented to the participant. Each exemplar was a person that self-identified with their subgroup categories, completed a task with our group, and opted into sharing their facial data. Participants first made a categorical rating of whether they believed the face they were presented was in pain or not. Participants had 5 s to make this rating. If participants chose “No pain,” then they rated whether the individual was experiencing a different emotion or feeling neutral. If participants selected “Pain,” they used a continuous scale to rate how much pain they believed the person was in. (c) Participants were presented one of the four sociodemographic faces presented in row A. Each face presented pain, one of the basic emotions (“anger,” “disgust,” “fear,” “happiness,” “sadness,” “surprise”) or a neutral expression. Participants made a categorical rating with each of the category options and other. After a participant selected a category, they rated how intense the expression was and their confidence in their categorical decision. If the participant chose, other, they were prompted to write 1–2 words that best reflected the state the face portrayed
Fig. 2
Fig. 2
Facial stimuli. (a) In each study, participants viewed one of four sociodemographic subgroups (Black man, Black woman, White man, or White woman). The CGI faces presented here were used in Studies 1–3 and 5. (b) Stimuli were presented at varying expression intensities. Intensities were increased from 0 to 99% at 9% intervals (i.e., 12 total expressions) for Studies 1–4 and were presented at 0%, 20%, 50%, and 80% in Study 5*. (c) In Study 4, individuals who self-identified as a subgroup and consented to sharing their facial data were used as exemplars. Three exemplars were used per subgroup. (d) In Study 5, facial expressions of the basic emotions (“anger,” “disgust,” “fear,” “happiness,” “sadness,” “surprise”) and neutral expressions were presented in addition to pain. Each of the additional expressions were also presented at the four intensity levels used in Study 5
Fig. 3
Fig. 3
Meta-analyses of the association between facial expression activation and pain categorization and intensity. We conducted a meta-analysis on intercepts and slopes from logistic and linear models across Studies 1–4 using the metagen function in R (Balduzzi et al., 2019). We observed a significant intercept for both pain categorization (p = 0.02) and intensity (p < 0.001), and we observed a significant effect of facial activation on slope for both pain categorization (p < 0.001) and intensity (p = 0.002), suggesting that perceivers are able to use facial activation information to identify pain and its intensity in targets
Fig. 4
Fig. 4
Meta-analyses of effects of sociodemographic factors on likelihood of pain assessment. We conducted a meta-analysis of the effects of sociocultural factors (target demographics, perceived similarity, and group membership) on intercepts (left column) and slopes (right column) from logistic models across Studies 1–4 using the metagen function in R (Balduzzi et al., 2019). There were no consistent influences of sociocultural factors across studies. For full model outcomes, please see Supplementary Table S1
Fig. 5
Fig. 5
Meta-analyses of effects of sociodemographic factors on pain intensity estimates. We conducted a meta-analysis of the effects of sociocultural factors (target demographics, perceived similarity, and group membership) on intercepts (left column) and slopes (right column) from linear models across Studies 1–4 using with the metagen function in R (Balduzzi et al., 2019). There were no consistent influences of sociocultural factors across our studies. For individual study results, please see “Supplementary Information”
Fig. 6
Fig. 6
Pie charts for mean emotion recognition rates across all subjects. In Studies 1–4, which each included a pain categorization question, perceivers attributed pain to the faces on the majority of trials, whereas Study 5, which included all of the basic emotions in the initial categorization question, perceivers rarely chose pain. We present Study 5 in two pie charts, as this study also included several non-pain emotion expressions: “Study 5: Pain trials” includes emotion attributions on trials that presented pain-related expressions and “Study 5: All trials” includes all trials during the task
Fig. 7
Fig. 7
Repeated measures ANOVAs. (a) We observed a main effect of target emotion on perceived intensity ratings (p < 0.001). Intensity ratings were highest when pain expressions were shown (blue hued violin plot). (b) We observed a main effect of target race on perceived intensity (p = 0.03), such that White targets (in green) were attributed with more intensity than Black targets (in blue). (c) We observed a main effect of target facial expression activation on perceived intensity (p < 0.001), such that more intensity was attributed at higher facial expression activations. (d) We observed a main effect of target emotion on perceived confidence (p < 0.001). Pain (in blue) was among emotions that were rated with the most confidence. (e) We observed a main effect of target gender on confidence, such that women targets (in the lighter shades) were rated at lower confidence compared to men targets (in the darker shades; p = 0.05). (f) We observed a main effect of target facial expression activation on perceived intensity, such that more intensity was attributed at higher facial expression activations and at the lowest category (for neutral expressions; p < 0.001)
Fig. 8
Fig. 8
Confusion matrix of emotion recognition. On the x-axis are the attributions that perceivers made when viewing each image, “Perceived Emotion Category,” and the y-axis are emotions as they were created and displayed, “Target Emotion Category.” The darker red colors signify a better mapping between canonical representation and perception, whereas the lighter colors signify less mapping and more confusion. Numbers in each box represent the percentage a category was selected. These numbers always equate to 100% by row and may differ from 100% by column if they were selected more often (greater than 100%) or less often (less than 100%) by perceivers

References

    1. Adams RB, Nelson AJ, Soto JA, Hess U, Kleck RE. Emotion in the neutral face: A mechanism for impression formation? Cognition and Emotion. 2012;26(3):431–441. doi: 10.1080/02699931.2012.666502. - DOI - PMC - PubMed
    1. Alawadhi SA, Ohaeri JU, Alayarian A, Anderson SR, Gianola M, Perry JM, Moore D. A pilot study on perceived stress and PTSD symptomatology in relation to four dimensions of older women’s physical health. Quality of Life Research : An International Journal of Quality of Life Aspects of Treatment, Care and Rehabilitation. 2019;20(1):214–221. doi: 10.1111/j.1365-2982.2010.01516.x. - DOI
    1. Amodio DM, Devine PG, Harmon-Jones E. Individual differences in the regulation of intergroup bias: The role of conflict monitoring and neural signals for control. Journal of Personality and Social Psychology. 2008;94(1):60–74. doi: 10.1037/0022-3514.94.1.60. - DOI - PubMed
    1. Amodio DM, Kubota JT, Harmon-Jones E, Devine PG. Alternative mechanisms for regulating racial responses according to internal vs external cues. Social Cognitive and Affective Neuroscience. 2006;1(1):26–36. doi: 10.1093/scan/nsl002. - DOI - PMC - PubMed
    1. Amodio DM. The neuroscience of prejudice and stereotyping. Nature Reviews Neuroscience. 2014;15(10):670–682. doi: 10.1038/nrn3800. - DOI - PubMed

LinkOut - more resources