. 2023 Jul 1;16(7):dmm049962.
doi: 10.1242/dmm.049962. Epub 2023 Jul 17.

Multiplatform modeling of atrial fibrillation identifies phospholamban as a central regulator of cardiac rhythm

Affiliations

Multiplatform modeling of atrial fibrillation identifies phospholamban as a central regulator of cardiac rhythm

Anaïs Kervadec et al. Dis Model Mech. .

Abstract

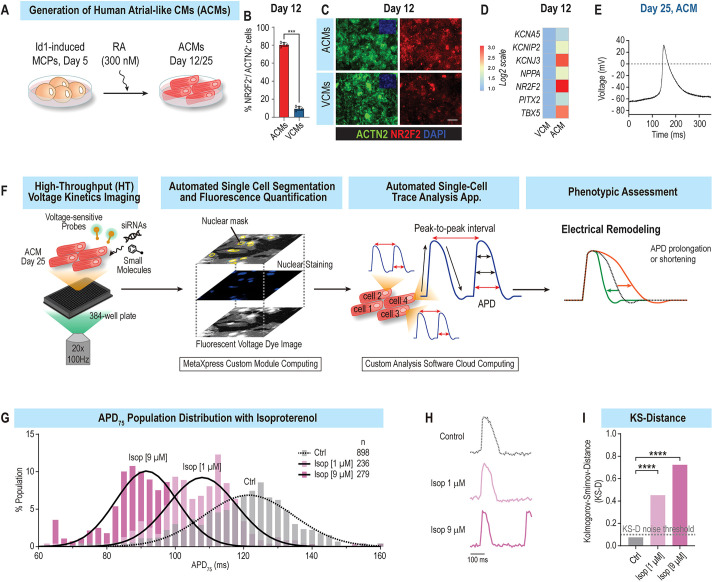
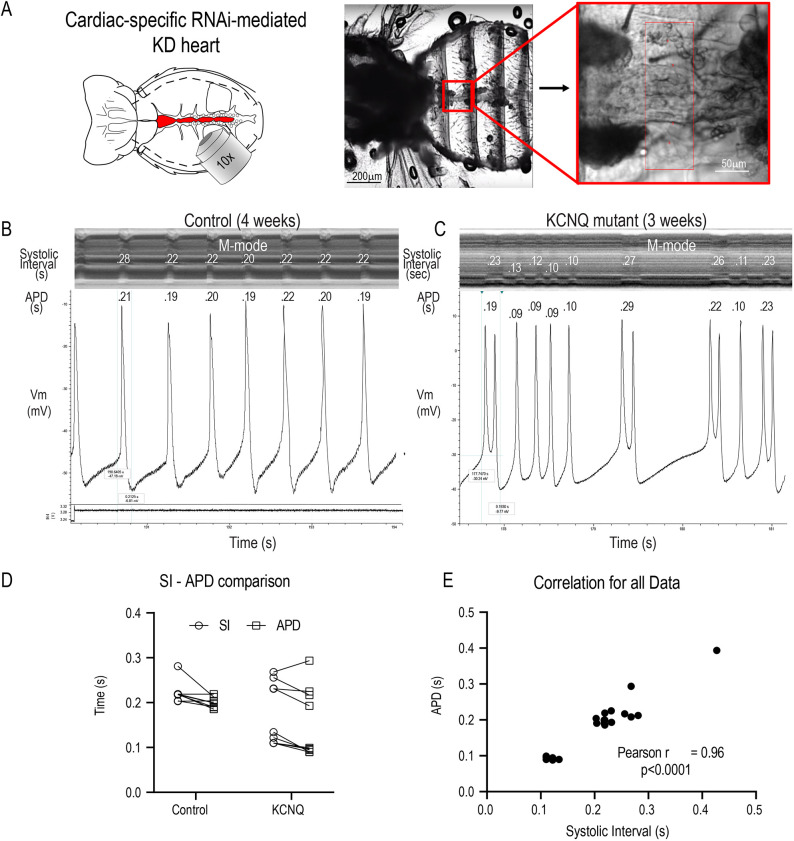
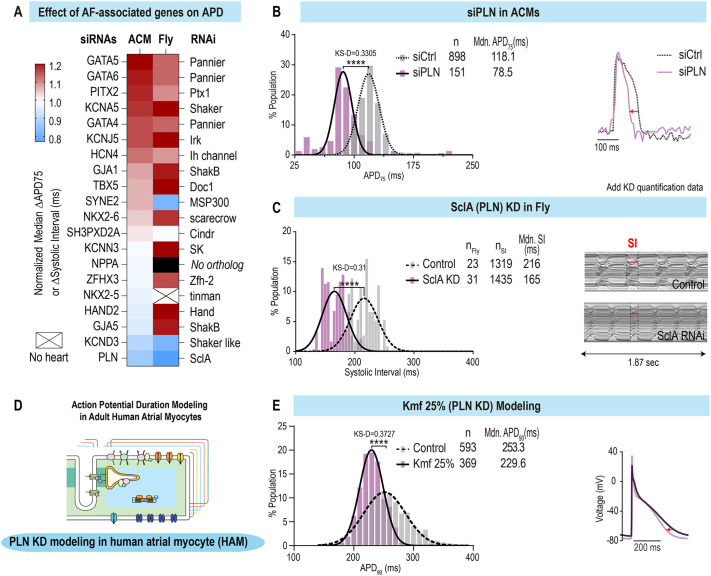
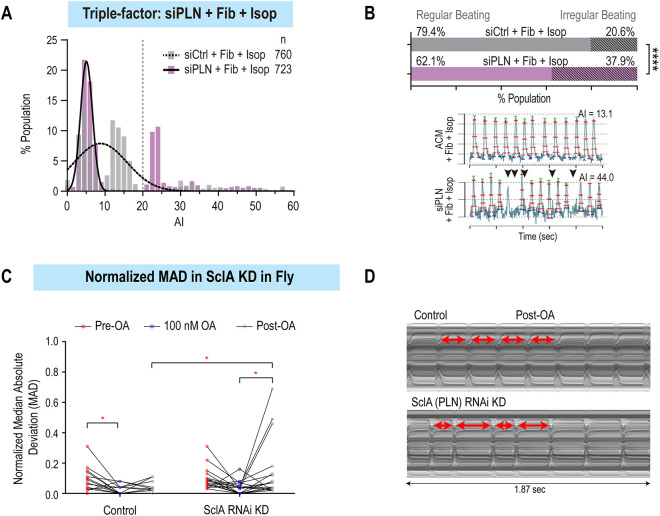
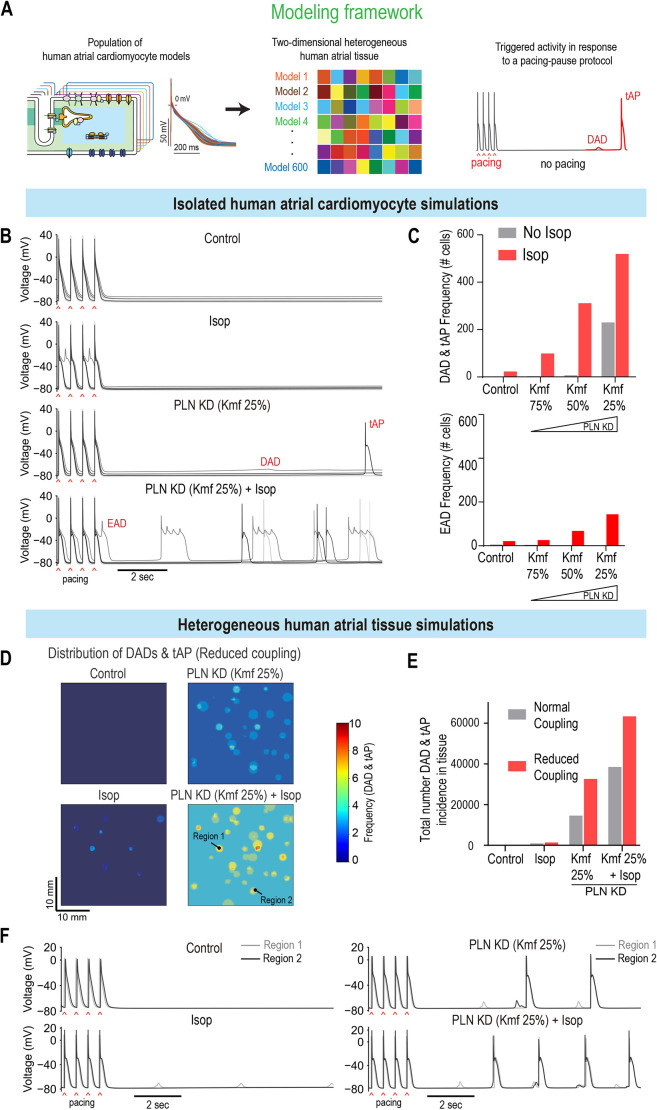
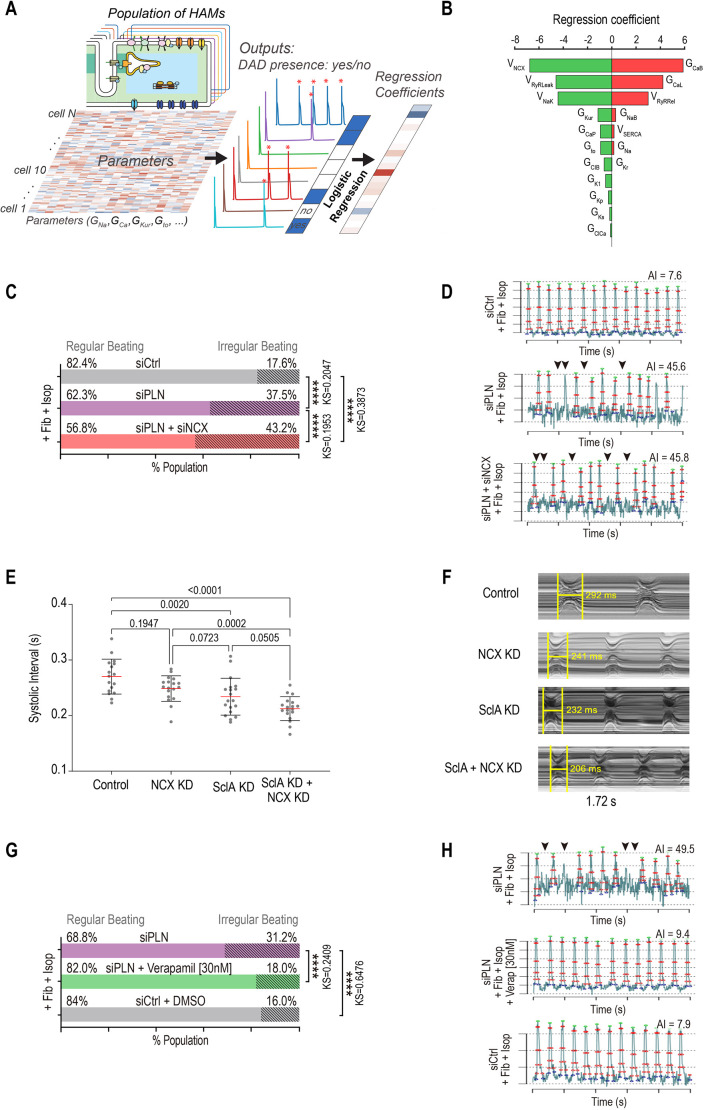
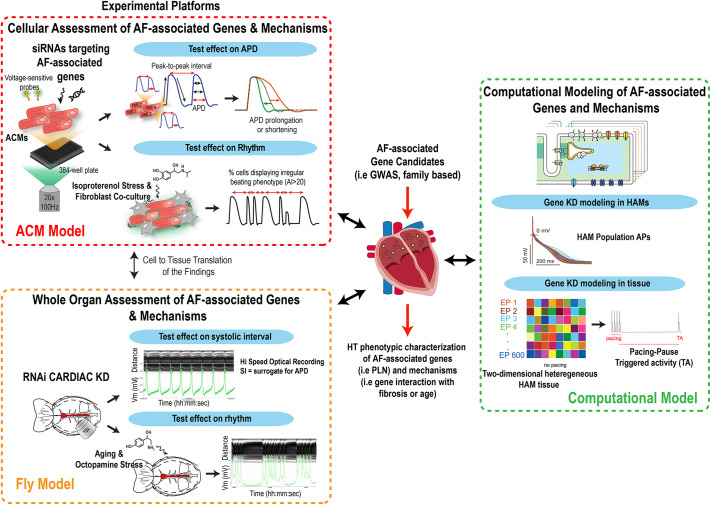
Atrial fibrillation (AF) is a common and genetically inheritable form of cardiac arrhythmia; however, it is currently not known how these genetic predispositions contribute to the initiation and/or maintenance of AF-associated phenotypes. One major barrier to progress is the lack of experimental systems to investigate the effects of gene function on rhythm parameters in models with human atrial and whole-organ relevance. Here, we assembled a multi-model platform enabling high-throughput characterization of the effects of gene function on action potential duration and rhythm parameters using human induced pluripotent stem cell-derived atrial-like cardiomyocytes and a Drosophila heart model, and validation of the findings using computational models of human adult atrial myocytes and tissue. As proof of concept, we screened 20 AF-associated genes and identified phospholamban loss of function as a top conserved hit that shortens action potential duration and increases the incidence of arrhythmia phenotypes upon stress. Mechanistically, our study reveals that phospholamban regulates rhythm homeostasis by functionally interacting with L-type Ca2+ channels and NCX. In summary, our study illustrates how a multi-model system approach paves the way for the discovery and molecular delineation of gene regulatory networks controlling atrial rhythm with application to AF.

Keywords: Drosophila; Atrial fibrillation; Cardiac disease modeling; Computational modeling; High-throughput electrophysiology; Human iPSC-derived atrial-like cardiomyocytes; Single-cell resolution.


Conflict of interest statement

Competing interests The authors declare no competing or financial interests.

Figures

Fig. 1.
Fig. 1.
Atrial-like cardiomyocyte (ACM) platform. (A) Schematic representation of the ACM differentiation protocol. To promote atrial differentiation, day 5 cardiac progenitors were treated with 300 nM retinoic acid (RA) and subsequently cultured until day 12 or 25. MCP, multipotent cardiac progenitor. (B) RA treatment efficiently induces the generation of atrial-like NR2F2+ beating cardiomyocytes (CMs) (∼80% of NR2F2+, ACTN2+). VCM, ventricular CM. (C) Representative immunofluorescence images showing overexpression of NR2F2+ (red) and ACTN2+ (green) cells in ACMs. Scale bar: 100 μm. (D) Heatmap of atrial genes enriched in day 12 ACMs compared to VCMs. (E) Patch-clamp experiments show that ACMs generate atrial-like triangular-shaped action potentials (APs). (F) Schematic representation of single-cell and high-throughput (HT) platform to measure AP duration (APD) parameters in ACMs. (G) Population distribution of APD75 values from ACMs treated with increasing doses of isoproterenol (Isop), showing dose-dependent APD shortening. (H) Single AP traces of median APD75 for each condition. (I) Kolmogorov–Smirnov distance (KS-D) values for control (Ctrl) and Isop-treated ACMs. ***P<0.001, ****P<0.0001.
Fig. 2.
Fig. 2.
Fly heart platform. (A) Schematic of the fly thorax and abdomen (left; heart tube is shown in red) and image of semi-intact preparation (middle) with a single cardiac chamber (red box), shown at higher magnification on the right. KD, knockdown; RNAi, RNA interference. (B,C) Simultaneous optical and electrophysiological recordings from beating hearts. M-modes from optical recordings are shown at the top with the corresponding AP traces below. APDs and systolic intervals (SIs) are shown in seconds. The lower window in B shows the voltage trace generated by the image capture software that was used to synchronize the optical and electrical recordings. (D) SIs are paired with their corresponding APs. (E) The Pearson correlation coefficient for the combined data in D showed a significant correlation between SIs and APDs (r=0.96, P<0.0001).
Fig. 3.
Fig. 3.
Loss-of-function screen of atrial fibrillation (AF)-associated genes identifies conserved modulators of APD and SI in a multi-model system platform. (A) Heatmap showing the normalized effects of AF-associated gene loss of function on APD and SI in ACMs and flies. (B) Population distribution of APD75 values for siControl and siPLN-transfected ACMs (left) and representative AP traces (right) showing the shortening effect of siPLN. Mdn, median. (C) Population distribution of SIs in control versus SclA KD conditions in flies (left) and representative M-modes (right), showing the SI shortening effect for SclA KD. (D) Schematic representation of APD modeling in human atrial monocytes (HAMs). (E) Population distribution of APD90 values for control and Michaelis constant (Km) of SERCA to cytosolic Ca2+ (forward pumping) (Kmf) 25% (PLN KD) in HAMs (left) and representative AP traces (right), showing the shortening effect on APD of simulated PLN KD. ****P<0.0001 (KS-D).
Fig. 4.
Fig. 4.
PLN KD in combination with environmental pertubagens induces arrhythmia phenotypes in ACMs and flies. (A) Histogram of arrhythmia index (AI) values of ACMs co-cultured with fibroblasts and treated with Isop in siControl versus siPLN conditions. (B) Increased percentage of irregularly beating (AI>20) ACMs co-cultured with fibroblasts (Fib) and treated with Isop, in siPLN compared to siControl (top). Representative peak trains of APs show irregular beat-to-beat interval (black arrowheads) in siPLN compared to siControl condition (bottom). (C) Distribution of median absolute deviation (MAD) values before, during and after 100 nM octopamine (OA) treatment. Post-OA, SclA KD hearts exhibit increased arrhythmia compared to controls (*P<0.05, repeated measures two-way ANOVA). (D) Representative M-modes showing irregular beat-to-beat intervals in SclA KD hearts post-OA compared to control hearts (arrows show individual heart periods).
Fig. 5.
Fig. 5.
Combined PLN KD and Isop challenge promotes arrhythmic events in isolated HAMs and two-dimensional (2D) atrial constructs. (A) Modeling framework for evaluating arrhythmic events in HAMs and 2D human atrial tissue. Colors indicate that each cell from the population of computational models has distinct electrophysiological properties (i.e. AP waveforms) to mimic physiologic heterogeneity in cells. For the 2D model of human atrial tissue, each of the 600 cells is mapped into clusters, each of which has distinct properties compared to those of neighboring clusters. The physiological properties of each myocyte cluster were randomly assigned, thereby producing a heterogeneous tissue structure. A pacing (2 Hz)–pause protocol was applied to assess the incidence of triggered activities. DAD, delayed afterdepolarization; tAP, triggered AP. (B,C) Effects of PLN KD (Kmf 25%) and Isop on the triggered activity in human atrial CMs. (B) Time courses of APs for baseline (control), with Isop treatment, PLN KD (Kmf 25%), and combined Isop treatment and PLN KD (PLN KD+Isop). (C) Incidence of DAD and tAP (top), and EAD (bottom), detected in the HAM populations for Isop and various degrees of PLN KD (Kmf from 25% to 75%) conditions. (D-F) Effects of PLN KD (Kmf 25%) and Isop on the generation of triggered activity in heterogeneous human atrial tissue. (D) Spatial distribution of DADs and tAPs in the atrial tissue with reduced cell-to-cell coupling for PLN KD (Kmf 25%) and after Isop treatment. (E) Total number of DADs and tAPs detected in the atrial tissue after each perturbation with normal or reduced cell-to-cell coupling. (F) Superimposed traces of APs from two regions (marked in D) of the atrial tissue with reduced cell-to-cell coupling for each perturbation.
Fig. 6.
Fig. 6.
Multiple perturbations are required to generate arrhythmicity across platforms. (A) Schematic describing the logistic regression analysis approach to identify the mechanisms underlying the generation of DADs in HAMs. Red asterisks indicate the occurrence of DAD. GCa, maximal conductance of L-type Ca2+ current; GKur, maximal conductance of ultra-rapid delayed rectifier K+ current; GNa, maximal conductance of fast Na+ current; Gto, maximal conductance of transient outward K+ current. (B) Logistic regression analysis of DAD incidence in the context of moderate PLN KD (Kmf 50%) revealed the influence of model parameters on the genesis of DADs in the population of HAMs in response to the pacing–pause protocol. Positive coefficients indicate that increasing the associated parameters promotes DAD production, and vice versa. GCaB, maximal conductance of background Ca2+ current; GCaP, maximal rate of plasma membrane Ca2+ ATPase current; GClB, maximal conductance of background Cl current; GClCa, maximal conductance of Ca2+-activated Cl current; GKp, maximal conductance of plateau K+ current; GKr, maximal conductance of rapid delayed rectifier K+ current; GKs, maximal conductance of slow delayed rectifier K+ current; GK1, maximal conductance of inward rectifier K+ current; GNaB, maximal conductance of background Na+ current; VNaK, maximal pump rate of Na+/K+ pump current; VNCX, maximal exchange rate of Na+/Ca2+ exchange current; VRyRLeak, maximal rate of ryanodine receptor Ca2+ leak; VRyRRel, maximal rate of ryanodine receptor Ca2+ release; VSERCA, maximal rate of sarcoplasmic reticulum Ca2+ ATPase flux. (C) The percentage of irregularly beating (AI>20) ACMs co-cultured with fibroblasts and treated with Isop is increased when transfected with siPLN and siNCX compared to siPLN alone. (D) Representative AP peak trains for siControl, PLN siPLN+siNCX conditions in ACMs co-cultured with fibroblasts and treated with Isop. Arrowheads show examples of irregular beat-to-beat intervals in arrhythmically beating ACMs. (E) Mean SI in response to cardiac KD of the plasma membrane Na+/Ca2+ exchanger NCX, SclA, and combined SclA+NCX KD. Co-KD caused a greater decrease in SI than did single KD alone (Wilcoxon ranked sum test). (F) Representative M-modes showing the effects of KD on SI. (G) The percentage of irregularly beating (AI>20) ACMs co-cultured with fibroblasts and treated with Isop is decreased with verapamil (30 nM) treatment in comparison to that with DMSO treatment. (H) Representative AP peak trains and AI values for siPLN; siPLN+verapamil (30 nM); siControl conditions in ACMs co-cultured with fibroblasts and treated with Isop. Arrowheads show examples of irregular beat-to-beat intervals in arrhythmically beating ACMs. ****P<0.0001 (KS-D).
Fig. 7.
Fig. 7.
Novel multiplatform modeling of AF. Schematic summarizing how our integrated multiplatform approach enables the HT identification and characterization of AF-associated genes and mechanisms, using model systems with human, adult, whole-organ and atrial relevance. GWAS, genome-wide association studies.

Similar articles

Cited by

References

    1. Aslanidi, O. V., Colman, M. A., Stott, J., Dobrzynski, H., Boyett, M. R., Holden, A. V. and Zhang, H. (2011). 3D virtual human atria: a computational platform for studying clinical atrial fibrillation. Prog. Biophys. Mol. Biol. 107, 156-168. 10.1016/j.pbiomolbio.2011.06.011 - DOI - PMC - PubMed
    1. Babu, G. J., Bhupathy, P., Timofeyev, V., Petrashevskaya, N. N., Reiser, P. J., Chiamvimonvat, N. and Periasamy, M. (2007). Ablation of sarcolipin enhances sarcoplasmic reticulum calcium transport and atrial contractility. Proc. Natl. Acad. Sci. USA 104, 17867-17872. 10.1073/pnas.0707722104 - DOI - PMC - PubMed
    1. Bier, E. (2005). Drosophila, the golden bug, emerges as a tool for human genetics. Nat. Rev. Genet. 6, 9-23. 10.1038/nrg1503 - DOI - PubMed
    1. Bier, E. and Bodmer, R. (2004). Drosophila, an emerging model for cardiac disease. Gene 342, 1-11. 10.1016/j.gene.2004.07.018 - DOI - PubMed
    1. Birse, R. T., Choi, J., Reardon, K., Rodriguez, J., Graham, S., Diop, S., Ocorr, K., Bodmer, R. and Oldham, S. (2010). High-fat-diet-induced obesity and heart dysfunction are regulated by the TOR pathway in Drosophila. Cell Metab. 12, 533-544. 10.1016/j.cmet.2010.09.014 - DOI - PMC - PubMed

Publication types