. 2023 Oct 1;33(5):364-374.
doi: 10.1097/CMR.0000000000000903. Epub 2023 Jun 12.

Analysis of circulating tumor DNA during checkpoint inhibition in metastatic melanoma using a tumor-agnostic panel

Affiliations

Analysis of circulating tumor DNA during checkpoint inhibition in metastatic melanoma using a tumor-agnostic panel

Judit Kisistók et al. Melanoma Res. .

Abstract

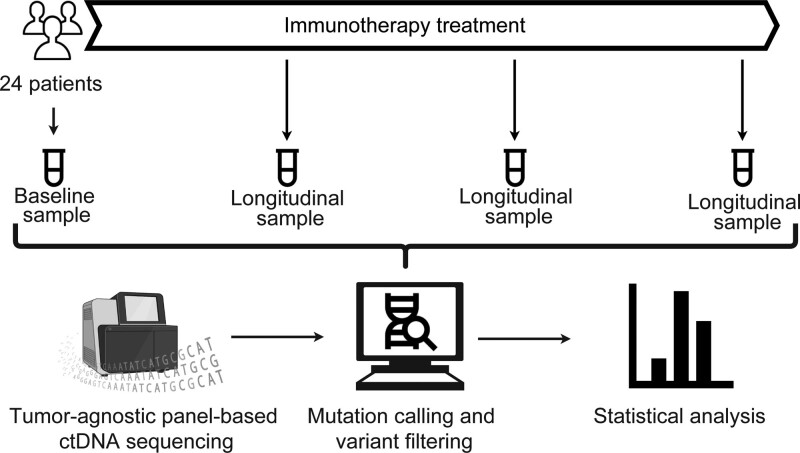
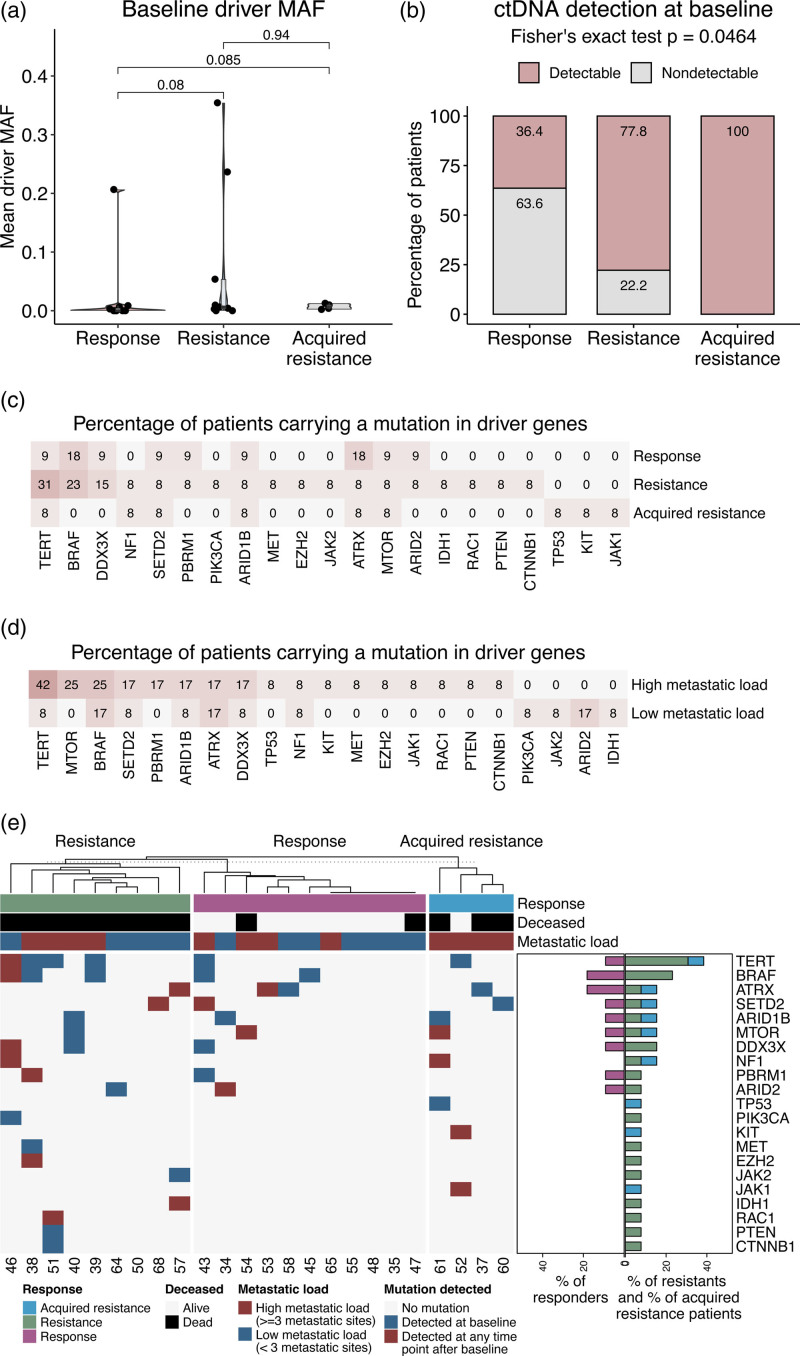
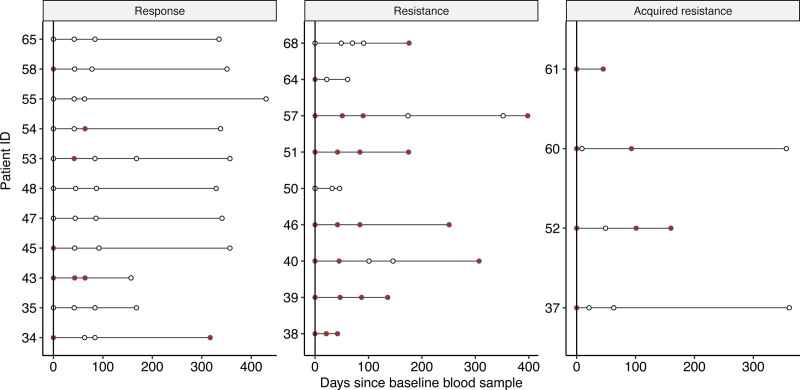
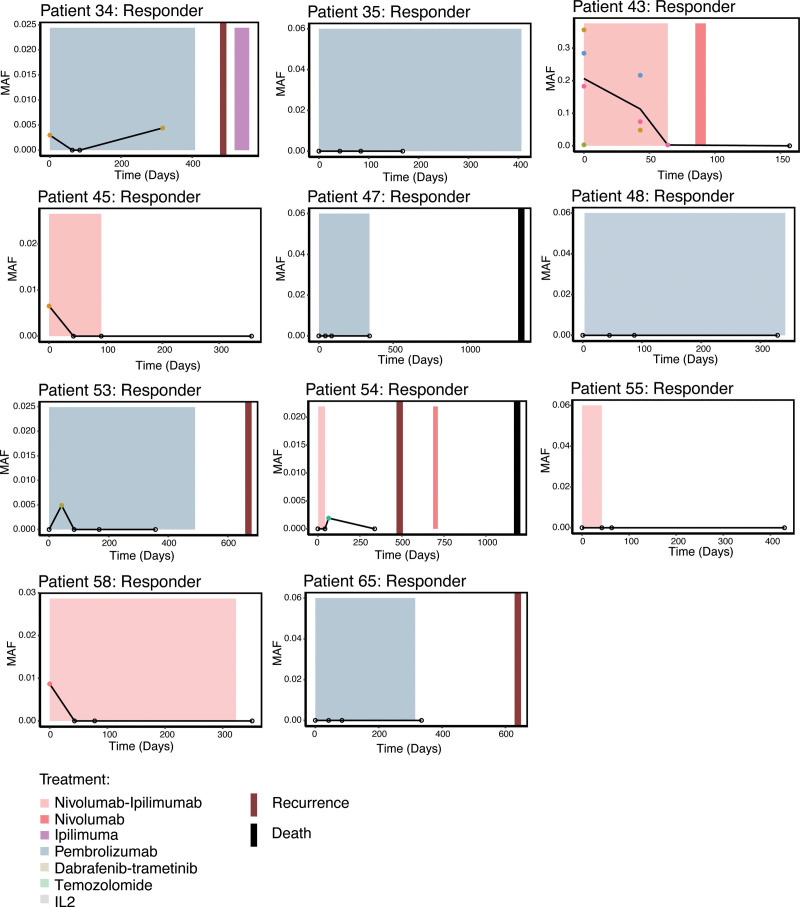
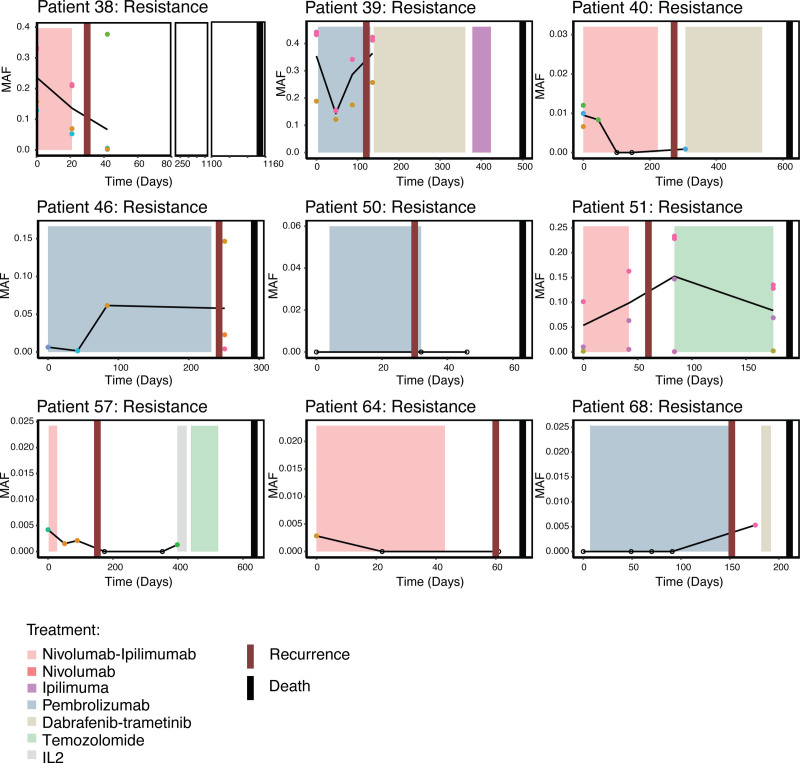
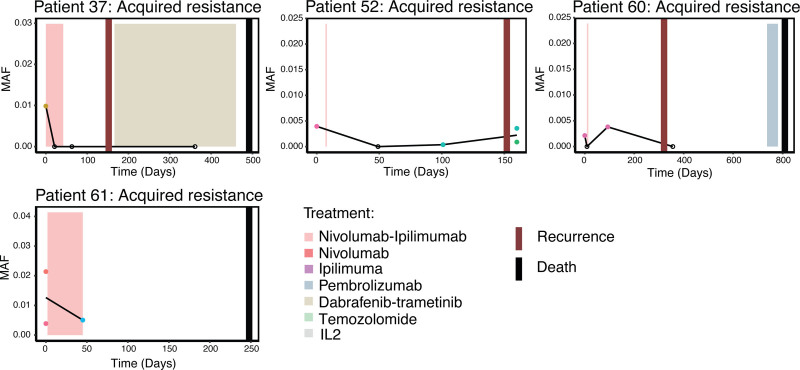
Immunotherapy has revolutionized treatment of patients diagnosed with metastatic melanoma, where nearly half of patients receive clinical benefit. However, immunotherapy is also associated with immune-related adverse events, which may be severe and persistent. It is therefore important to identify patients that do not benefit from therapy early. Currently, regularly scheduled CT scans are used to investigate size changes in target lesions to evaluate progression and therapy response. This study aims to explore if panel-based analysis of circulating tumor DNA (ctDNA) taken at 3-week intervals may provide a window into the growing cancer, can be used to identify nonresponding patients early, and determine genomic alterations associated with acquired resistance to checkpoint immunotherapy without analysis of tumor tissue biopsies. We designed a gene panel for ctDNA analysis and sequenced 4-6 serial plasma samples from 24 patients with unresectable stage III or IV melanoma and treated with first-line checkpoint inhibitors enrolled at the Department of Oncology at Aarhus University Hospital, Denmark. TERT was the most mutated gene found in ctDNA and associated with a poor prognosis. We detected more ctDNA in patients with high metastatic load, which indicates that more aggressive tumors release more ctDNA into the bloodstream. Although we did not find evidence of specific mutations associated with acquired resistance, we did demonstrate in this limited cohort of 24 patients that untargeted, panel-based ctDNA analysis has the potential to be used as a minimally invasive tool in clinical practice to identify patients where the benefits of immunotherapy outweigh the drawbacks.


Conflict of interest statement

There are no conflicts of interest.

Figures

Fig. 1
Fig. 1
Study overview. Twenty-four patients with metastatic melanoma were enrolled in the study at Aarhus University Hospital in 2017. Prior to receiving systemic treatment with first-line checkpoint inhibitors, a baseline blood sample was taken. Subsequently, 10 patients were selected to receive treatment with Pembrolizumab and the remaining 14 patients received a combination of Nivolumab and Ipilimumab. Over the course of treatment, three additional blood samples were extracted. After cell-free DNA extraction from plasma, circulating tumor DNA was sequenced at 15000x depth using a custom gene panel consisting of 40 genes known to be associated with immunotherapy response. Mutations were called in the resulting ctDNA data by running the Shearwater algorithm on a per-sample basis, using the samples from independent patients as background. Following statistical analyses were performed in R.
Fig. 2
Fig. 2
Mutation analysis. (a) Violinplots showing the mutant allele frequency at baseline. Values shown on the Y-axis are calculated by taking the mean MAF overall filtered variants per patient. X-axis and color show response category. (b) Stacked bar plots showing the percentage of patients per response category where ctDNA was detected at baseline. X-axis shows response category, Y-axis displays patient percentage, color corresponds to the detection status at baseline. (c) Heatmap showing the percentage of patients carrying mutations in panel genes. The percentages are calculated within categories. Color intensity corresponds to the percentage values. (d) Heatmap showing the percentage of patients carrying mutations in panel genes, split according to metastatic load categories. Visualization follows panel (c). (e) Heatmap-barplots showing the driver mutation profile of the cohort. Blue tiles indicate that a mutation was detected at baseline, red tiles indicate mutations that were not found at baseline but were detected at a later time point. Top annotations show patient characteristics: response category (pink: response, green: resistance, blue: acquired resistance), survival status (gray: alive, black: dead), and metastatic load (blue: low, <3 metastatic sites, red: high, ≥3 metastatic sites). Barplots on the side show the percentage of patients carrying a driver mutation per response category (pink: response, green: resistance, blue: acquired resistance). ctDNA, circulating tumor DNA; MAF, mutant allele frequency.
Fig. 3
Fig. 3
Driver mutation detection per response category. Dotplots showing driver mutation detection status over the course of the study. Y-axis shows patient ID, X-axis shows the days passed since the baseline blood sample was extracted. Dots correspond to blood tests taken, empty dots indicate no driver mutation detected, red dots indicate that driver mutations were detected in the sample.
Fig. 4
Fig. 4
Longitudinal analysis of ctDNA in patients with response. Per-patient plots showing the driver mutations detected over the course of treatment and clinical history. Y-axis shows the mutant allele frequency, X-axis shows the days since the baseline blood sample. Colored dots indicate detected mutations, empty dots signify that a blood sample was taken at the time point but no mutation was detected. Black line connecting the time points corresponds to the mean MAF over time. Colored boxes show the type and time frame of treatment. Red vertical lines show the date of clinical progression, black vertical lines show the date of death. Dashed vertical lines show the date of PET/CT or CT scans. CT, computed tomography; ctDNA, circulating tumor DNA; MAF, mutant allele frequency.
Fig. 5
Fig. 5
Longitudinal analysis of ctDNA in patients with resistance. Per-patient plots showing the driver mutations detected over the course of treatment and clinical history in patients resistant to treatment. Annotation follows Fig. 4. ctDNA, circulating tumor DNA.
Fig. 6
Fig. 6
Longitudinal analysis of ctDNA in patients who acquired resistance. Per-patient plots showing the driver mutations detected over the course of treatment and clinical history in patients developing acquired resistance to treatment. Annotation follows Fig. 4. ctDNA, circulating tumor DNA.

References

    1. Weiss SA, Wolchok JD, Sznol M. Immunotherapy of melanoma: facts and hopes. Clin Cancer Res 2019; 25:5191–5201. - PMC - PubMed
    1. Wang Y, Tong Z, Zhang W, Zhang W, Buzdin A, Mu X, et al. . FDA-approved and emerging next generation predictive biomarkers for immune checkpoint inhibitors in cancer patients. Front Oncol 2021; 11:683419. - PMC - PubMed
    1. Litchfield K, Reading JL, Puttick C, Thakkar K, Abbosh C, Bentham R, et al. . Meta-analysis of tumor- and T cell-intrinsic mechanisms of sensitization to checkpoint inhibition. Cell 2021; 184:596–614.e14. - PMC - PubMed
    1. Cristescu R, Mogg R, Ayers M, Albright A, Murphy E, Yearley J, et al. . Pan-tumor genomic biomarkers for PD-1 checkpoint blockade-based immunotherapy. Science 2018; 362. doi: 10.1126/science.aar3593. - PMC - PubMed
    1. Pedersen JG, Sokac M, Sørensen BS, Luczak AA, Aggerholm-Pedersen N, Birkbak NJ, et al. . Increased soluble PD-1 predicts response to nivolumab plus ipilimumab in melanoma. Cancers 2022; 14:3342. - PMC - PubMed