. 2023 Jul;21(3):501-516.
doi: 10.1007/s12021-023-09633-7. Epub 2023 Jun 9.

Single Neuron Modeling Identifies Potassium Channel Modulation as Potential Target for Repetitive Head Impacts

Affiliations

Single Neuron Modeling Identifies Potassium Channel Modulation as Potential Target for Repetitive Head Impacts

Daniel P Chapman et al. Neuroinformatics. 2023 Jul.

Abstract

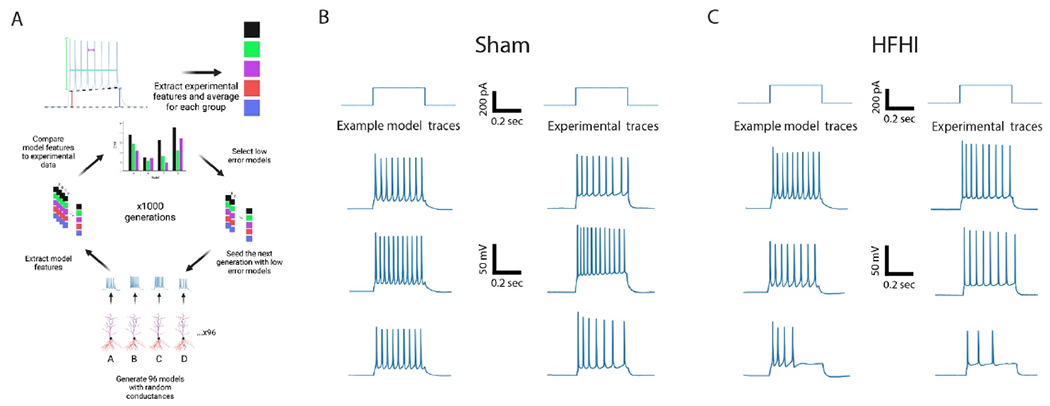
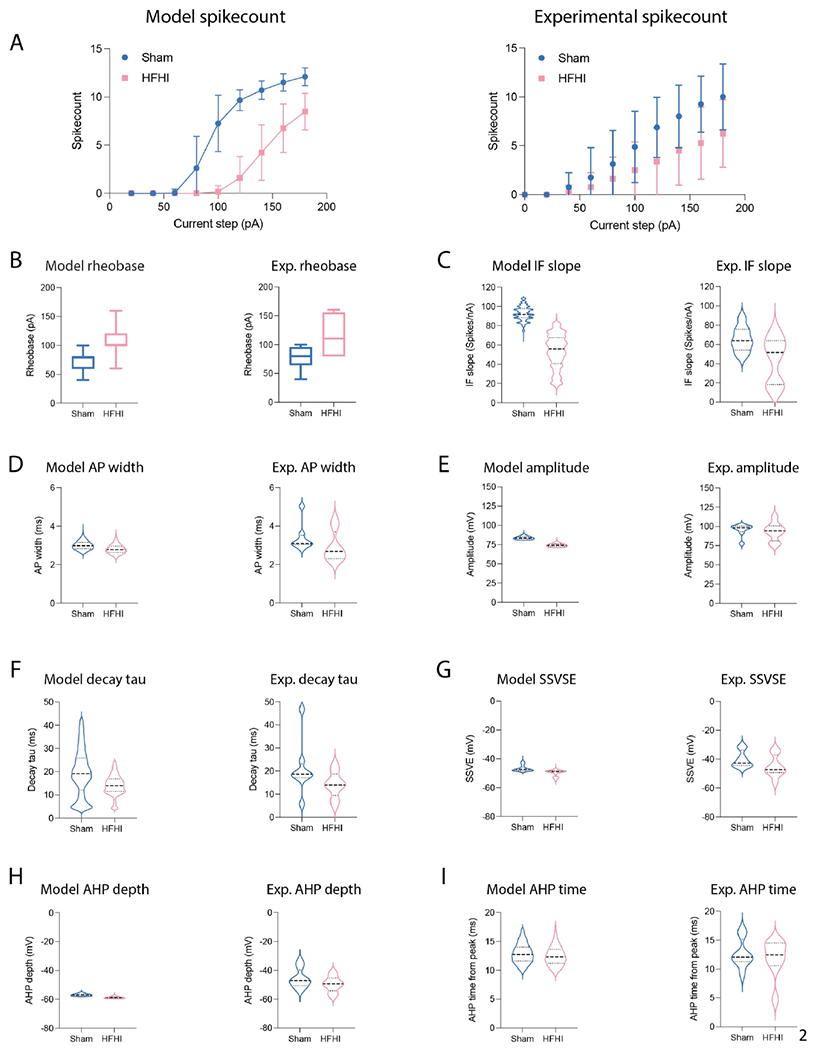
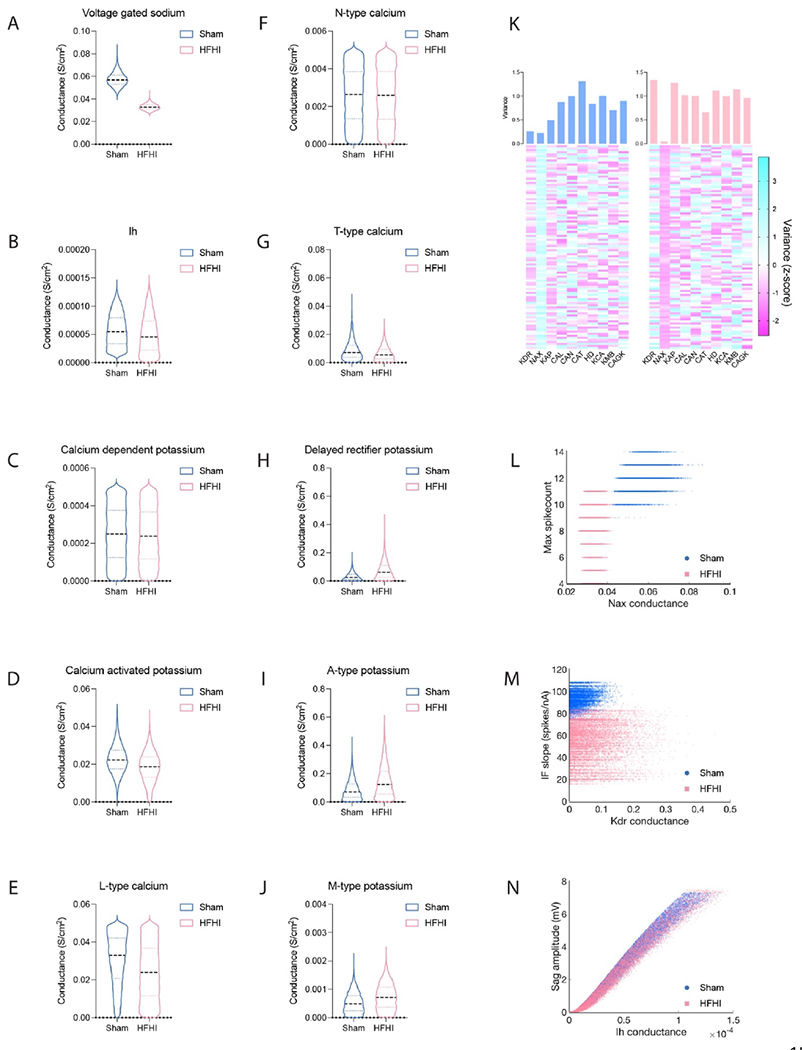
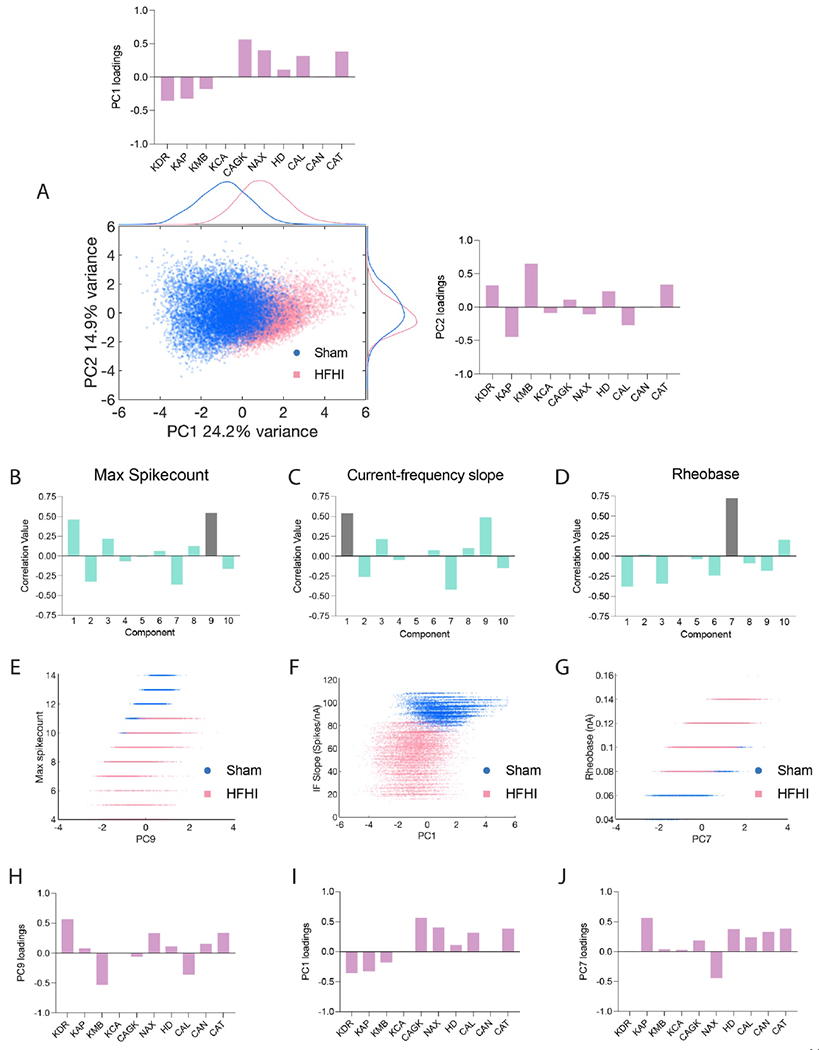
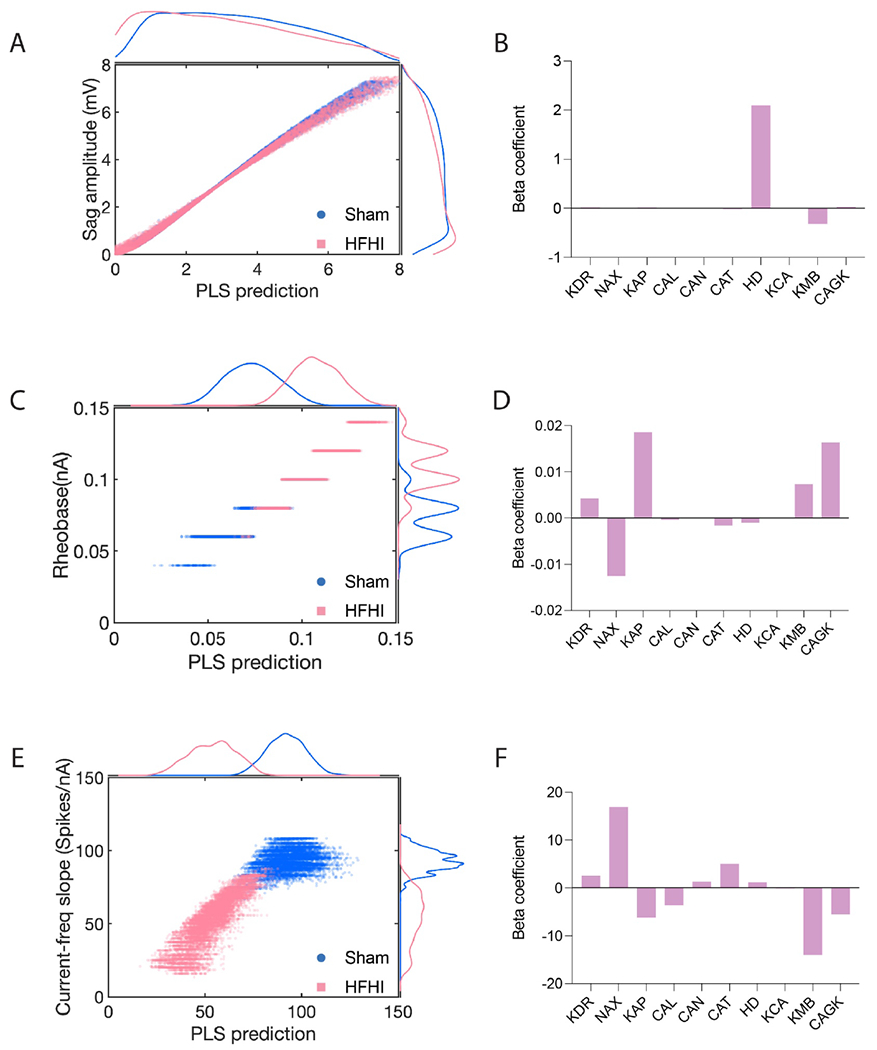
Traumatic brain injury (TBI) and repetitive head impacts can result in a wide range of neurological symptoms. Despite being the most common neurological disorder in the world, repeat head impacts and TBI do not have any FDA-approved treatments. Single neuron modeling allows researchers to extrapolate cellular changes in individual neurons based on experimental data. We recently characterized a model of high frequency head impact (HFHI) with a phenotype of cognitive deficits associated with decreases in neuronal excitability of CA1 neurons and synaptic changes. While the synaptic changes have been interrogated in vivo, the cause and potential therapeutic targets of hypoexcitability following repetitive head impacts are unknown. Here, we generated in silico models of CA1 pyramidal neurons from current clamp data of control mice and mice that sustained HFHI. We use a directed evolution algorithm with a crowding penalty to generate a large and unbiased population of plausible models for each group that approximated the experimental features. The HFHI neuron model population showed decreased voltage gated sodium conductance and a general increase in potassium channel conductance. We used partial least squares regression analysis to identify combinations of channels that may account for CA1 hypoexcitability after HFHI. The hypoexcitability phenotype in models was linked to A- and M-type potassium channels in combination, but not by any single channel correlations. We provide an open access set of CA1 pyramidal neuron models for both control and HFHI conditions that can be used to predict the effects of pharmacological interventions in TBI models.

Keywords: Brain injury–traumatic; Computational modeling; Computational neuroscience; Mouse model; Neuron physiology; Subconcussive head impact.


Conflict of interest statement

Statements and Declarations

The authors declare that the research was conducted in the absence of any commercial or financial relationships that could be construed as a potential conflict of interest.

Figures

Figure 1.
Figure 1.. Computational model setup and optimization.
A) Model setup and optimization scheme. B) Example traces of 180 pA current injection (top) for experimental traces (right) and 9,520 sham neuron models (left) that were within 2 SD of all features from experimental data. C) Example traces of 180 pA current injection (top) for experimental traces (right)11,024 zero error models found HFHI neuron models (left).
Figure 2.
Figure 2.. Computational model features approximate experimental data.
A) The computational models (left) from the optimizations approximate the decreased spikecount relative to shams seen in experimental data at 24 hours (right). Mean +/− SD for both datasets. Additional excitability features like B) rheobase and C) IF slope are shifted towards hypoexcitability phenotypes in both the experimental data and the model space. Other experimental features not directly related to excitability are also approximated by the model populations such as D) action potential width, E) action potential amplitude, F) decay tau, G) steady state voltage stimend, H) afterhyperpolarization depth, and C) afterhyperpolarization time. Model populations (left plot of each subfigure) and experimental data (right plot of each subfigure) are presented as violin plots, horizontal thick dotted lines represent median; bottom and top horizontal thin dotted lines represent 1st and 3rd quartiles respectively. IF = current frequency; AP = action potential; SSVSE = steady state voltage stimend; AHP = afterhyperpolarization.
Figure 3.
Figure 3.. Computational HFHI neuron models show mildly altered channel conductance and increased Kv range.
Violin plots of model conductances (nSham = 9,520 models, nHFHI = 11,024 models) for A) voltage gated sodium; B) hyperpolarization activated cation current; C) calcium dependent potassium channel; D) calcium activated potassium channel; E) long type calcium; F) neuronal type calcium; G) transient type calcium; H) delayed rectifier potassium; I) A-type potassium; and J) M-type potassium. Voltage gated sodium (A), hyperpolarization activated cation current (B), and T-type calcium (G) show the largest differences between the groups. K) heatmap showing 100 normalized example parameter sets for sham (left) and HFHI (right) models. Variance of the whole dataset for each parameter is shown above the heatmap and shows decreased variance, and thus degeneracy, amongst HFHI neuron models, especially in delayed rectifier potassium, voltage gated sodium, and T-type calcium. Despite these differences in channel conductances between groups, they are poor predictors of frequency metrics such as L) max spikecount, M) current-frequency slope. N) Sag amplitude was plotted against Ih conductance as a positive control for a known feature carried by a single current. Parameters from model populations are presented as violin plots, horizontal thick dotted lines represent median; bottom and top horizontal thin dotted lines represent 1st and 3rd quartiles respectively. Z-scores from L represent scores relative to a normalization across a dataset from both groups. Acronyms in panel K: KDR = delayed rectifier potassium; NAX = voltage gated sodium; KAP = A-type potassium; CAL = L-type calcium; CAN = N-type calcium; CAT = T-type calcium; HD = hyperpolarization activated cation current (Ih); KCA = calcium dependent potassium; KMB = M-type potassium channel; CAGK = calcium activated potassium channel.
Figure 4.
Figure 4.. Principal components separate groups and weakly predict excitability features.
A) Scatter-hist plot of PC’s 1 and 2 show separation of sham and HFHI neuron models largely across PC1 which is loaded by (A, right bar graph) a diverse set of channels, including delayed rectifier potassium, M-type potassium, voltage gated sodium, hyperpolarization activated cation current, and T-type calcium. Groups are not separated by PC2 which is loaded by (A, top bar graph) A-type potassium and calcium activated potassium. B) Several PCs correlate to the maximum spikecount and C) shows a scatter plot of max spikecount vs. PC9 (dark shaded in B). D) Shows that PC9 is loaded predominantly by KDR and KMB. E-G) same as B-D but for current-frequency slope and PC1 respectively. H-J) same as B-D and E-G but for rheobase and PC7 respectively. PC7 is loaded largely by the voltage gated calcium channels in addition to KAP and NAX. Acronyms in A,D,G, and J: KDR = delayed rectifier potassium; NAX = voltage gated sodium; KAP = A-type potassium; CAL = L-type calcium; CAN = N-type calcium; CAT = T-type calcium; HD = hyperpolarization activated cation current (Ih); KCA = calcium dependent potassium; KMB = M-type potassium channel; CAGK = calcium activated potassium channel.
Figure 5.
Figure 5.. Partial least squared regression strongly predicts excitability features.
A) Scatter-hist plot of sag amplitude against a PLSR model as a positive control. The model accounts for ~95% of variance in sag amplitude across the model populations. B) Beta coefficients for sag-amplitude PLSR is dominated by Ih. C) PLSR model fit accounts for ~90% of variance in rheobase across the model populations. D) Beta coefficients for the rheobase feature is strongly positively loaded by 3 voltage gated potassium channels (KAP, KMB, and CAGK) and inversely loaded by voltage gated sodium. E) PLSR accounts for ~85% of variance in IF slope across model populations. F) This feature is strongly loaded by voltage gated sodium and inversely loaded by M-type potassium. Acronyms in B, D, and F: KDR = delayed rectifier potassium; NAX = voltage gated sodium; KAP = A-type potassium; CAL = L-type calcium; CAN = N-type calcium; CAT = T-type calcium; HD = hyperpolarization activated cation current (Ih); KCA = calcium dependent potassium; KMB = M-type potassium channel; CAGK = calcium activated potassium channel.

Similar articles

Cited by

References

    1. Arundine M, & Tymianski M (2004). Molecular mechanisms of glutamate-dependent neurodegeneration in ischemia and traumatic brain injury. Cell Mol Life Sci, 61(6), 657–668. 10.1007/s00018-003-3319-x - DOI - PMC - PubMed
    1. Ascoli GA, Donohue DE, & Halavi M (2007). NeuroMorpho.Org: a central resource for neuronal morphologies. J Neurosci, 27(35), 9247–9251. 10.1523/JNEUROSCI.2055-07.2007 - DOI - PMC - PubMed
    1. Ascoli GA, Gasparini S, Medinilla V, & Migliore M (2010). Local control of postinhibitory rebound spiking in CA1 pyramidal neuron dendrites. J Neurosci, 30(18), 6434–6442. 10.1523/JNEUROSCI.4066-09.2010 - DOI - PMC - PubMed
    1. Aungst SL, Kabadi SV, Thompson SM, Stoica BA, & Faden AI (2014). Repeated mild traumatic brain injury causes chronic neuroinflammation, changes in hippocampal synaptic plasticity, and associated cognitive deficits. J Cereb Blood Flow Metab, 34(7), 1223–1232. 10.1038/icbfm.2014.75 - DOI - PMC - PubMed
    1. Baculis BC, Zhang J, & Chung HJ (2020). The Role of K(v)7 Channels in Neural Plasticity and Behavior. Front Physiol, 11, 568667. 10.3389/fphys.2020.568667 - DOI - PMC - PubMed

Publication types

Substances

LinkOut - more resources