. 2023 Jun 7;4(2):102262.
doi: 10.1016/j.xpro.2023.102262. Online ahead of print.

Optimized protocol for in vivo affinity purification proteomics and biochemistry using C. elegans

Affiliations

Optimized protocol for in vivo affinity purification proteomics and biochemistry using C. elegans

Muriel Desbois et al. STAR Protoc. .

Abstract

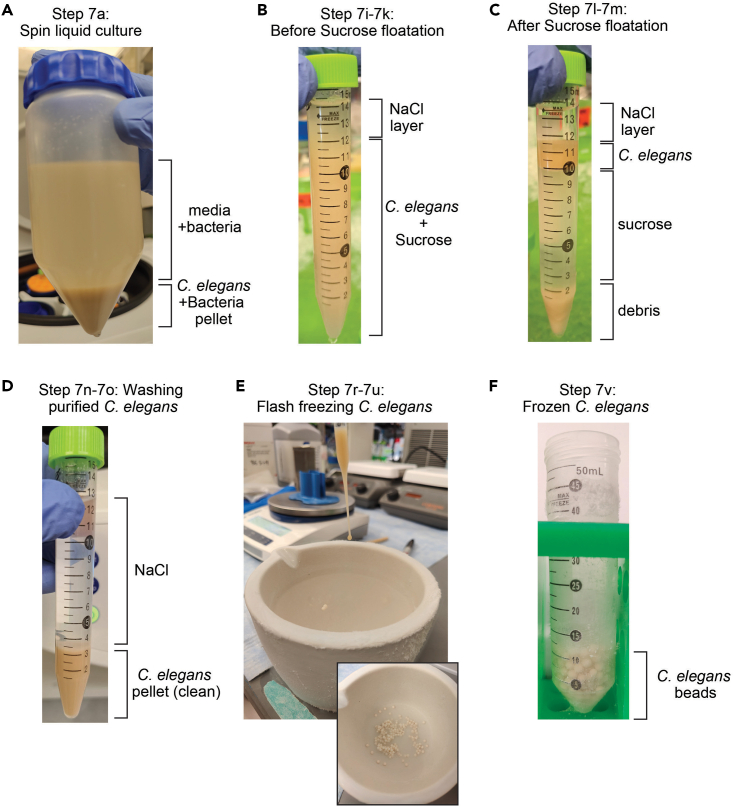
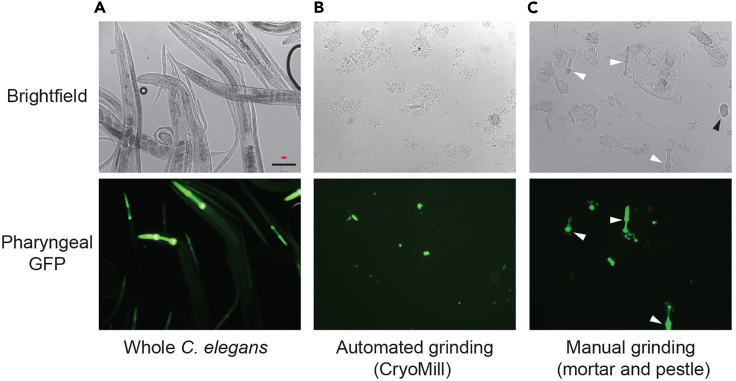
We present an optimized protocol for in vivo affinity purification proteomics and biochemistry using the model organism C. elegans. We describe steps for target tagging, large-scale culture, affinity purification using a cryomill, mass spectrometry and validation of candidate binding proteins. Our approach has proven successful for identifying protein-protein interactions and signaling networks with verified functional relevance. Our protocol is also suitable for biochemical evaluation of protein-protein interactions in vivo. For complete details on the use and execution of this protocol, please refer to Crawley et al.,1 Giles et al.,2 and Desbois et al.3.

Keywords: Mass Spectrometry; Model Organisms; Neuroscience; Protein Biochemistry; Protein expression and purification; Proteomics.


Conflict of interest statement

Declaration of interests The authors declare no competing interests.

Figures

None
Graphical abstract
Figure 1
Figure 1
Experimental workflow for AP-proteomics in C. elegans Schematic illustrating full workflow for AP-proteomics using C. elegans. Workflow is divided into four main sections: 1) C. elegans strain building and validation, 2) affinity purification and mass spectrometry, 3) bioinformatic analysis of proteomic hits, and 4) validation of putative binding proteins.
Figure 2
Figure 2
Designing strains and constructs for ubiquitin ligase substrate enrichment (A) Example of three transgenic strains required for AP-proteomics experiments with ubiquitin ligase as POI. Note RPM-1 RING family ubiquitin ligase is used as example. (B) Schematic depicting RPM-1 which functions in a multi-component E3 ubiquitin ligase complex to target substrates for ubiquitination and degradation via the proteasome (upper diagram). RPM-1 LD construct generated by mutating three catalytic residues (C3535A, H3537A, H3540A). Substrates are biochemically ‘trapped’ by RPM-1 LD/FSN-1/SKR-1 ubiquitin ligase complex which enriches substrate interactions (lower diagram).
Figure 3
Figure 3
Evaluation of GS::RPM-1 function using transgenic rescue (A) rpm-1 mutants display high frequency axon termination defects. Defects are not altered by pha-1 ts mutant which is used as transgenic selection cassette. GS::RPM-1 with MCS linker is fully functional and robustly rescues rpm-1 (lf) defects. In contrast, GS::RPM-1 with Gateway linker and RPM-1 with C-terminal tag (RPM-1::GS) do not rescue efficiently. Untagged RPM-1 is positive control for rescue. (B) Evaluation of integrated transgenes showing GS::RPM-1 (MCS linker) is functional while GS::RPM-1 LD is not. GS::GFP is included as negative control for GS affinity tag. Histograms represent means, dots represent average for single count (35–40 worms/count), error bars are SEM. Significance was tested using Student’s t-test with Bonferroni correction. ∗∗∗p < 0.001, ∗∗p < 0.01 and ns = not significant.
Figure 4
Figure 4
Images for key steps in harvesting C. elegans from large-scale liquid cultures (step 7) (A) Photograph of C. elegans pellet after spinning culture from one flask into 250 mL conical tube. (B) C. elegans-sucrose mixture with 2 mL layer of NaCl that facilitates separation of layers during sucrose flotation. (C) Different layers found after sucrose floatation. Note layer of enriched, cleaned C. elegans. (D) C. elegans pellet after 3 washes post sucrose floatation. (E) Example of flash freezing process where Pasteur pipette is used to place drops of C. elegans into mortar with liquid N2. (F) Flash frozen beads of C. elegans in 50 mL tube before storage at −80°C.
Figure 5
Figure 5
Example of quality control for affinity purification using RPM-1 ubiquitin ligase as POI (A) Silver staining used to visualize affinity purified samples for POI (GS::RPM-1 and GS::RPM-1 LD) and negative control (GS::GFP). Shown are two independent replicates for each affinity purification target. Affinity purification samples were generated from whole C. elegans extracts (Tris 0.1% NP-40 lysis buffer) using IgG-Dynabeads. Note numerous enriched silver stained species in GS::RPM-1 and GS::RPM-1 LD test samples compared to GS::GFP negative control. Right lanes show serial dilution of Cytiva high molecular weight (HMW) protein standards where Myosin is used to estimate POI quantity. (B) Western blot with anti-SBP antibody used to confirm expression and size of POI (GS::RPM-1 and GS::RPM-1 LD) in affinity purified samples.
Figure 7
Figure 7
Example of proteomics data organization (step 22) Each experiment is indicated in the first column and color code highlights varying detergent and buffer conditions. Later columns indicate: database ID, protein name, protein size, percent coverage, total spectral count (peptide), exclusive spectral count, and unique spectral count for samples (GS::GFP control, GS::RPM-1 and GS::RPM-1 LD). Shown are functionally validated RPM-1 binding proteins (FSN-1, SKR-1, GLO-4, RAE-1, PPM-2) and ubiquitination substrates (UNC-51, CDK-5).
Figure 6
Figure 6
Detergent type and concentration affect AP-proteomic profiles (A) Silver stain showing POI (GS::RPM-1 and GS::RPM-1 LD) and negative control (GS::GFP) across three extraction conditions. (B) Venn diagrams comparing AP-proteomic hits for GS::RPM-1 from different independent experiments under similar extraction conditions. (C) Venn diagram comparing AP-proteomic hits for GS::RPM-1 across different extraction conditions. Note that only hits identified in both experiments for a given condition were evaluated. (D) Scatter plots comparing single AP-proteomic experiments between specified genotypes. Proteomic hits are compared between GS::GFP negative control and POI test samples, GS::RPM-1 and GS::RPM-1 LD. Proteomic hits represent individual proteins and gray lines delineate 2-fold enrichment over GS::GFP control. Putative substrates (dashed red oval) are enriched in GS::RPM-1 LD versus GS::RPM-1 sample. Total spectral count value is plotted on log10 scale.
Figure 8
Figure 8
Dynabead matrix and HALT protease inhibitors improve POI affinity purification and reduce degradation (A) Silver stain for POI (GS::RPM-1) and negative control (GS::GFP). We observed cleaner background in GS::GFP control sample and more enrichment of silver stained species in GS::RPM-1 test sample when using IgG-Dynabeads compared to IgG-Agarose beads. (B–D) Anti-SBP Western blot to detect GS::RPM-1. (B) Shows similar capture of GS::RPM-1 with IgG-Dynabeads and IgG-Agarose. (C) Shows primarily intact full-length GS::RPM-1 when Pierce HALT protease inhibitors are added to lysis buffer. (D) Shows extensive GS::RPM-1 degradation products occur with Roche cOmplete protease inhibitors.
Figure 9
Figure 9
Automated cyromill grinding of C. elegans is superior to manual grinding by mortar and pestle (A–C) Visual comparison using brightfield (upper panels) and epifluorescence microscopy (lower panels) of (A) whole unground C. elegans, (B) automated grinding with cryomill under liquid nitrogen cooling, and (C) manual grinding by mortar and pestle. Note automated cyromill consistently grinds C. elegans to low micrometer particles without any visible intact pharynxes, larvae or embryos. In contrast, manual grinding is inconsistent leaving intact portions of worms (white arrowheads denote pharynxes) and eggs (black arrowhead). Transgenic Pmyo-2::GFP used to visualize pharynx. Scale bars are 100 μm (black) and 20 μm (red).

References

    1. Crawley O., Opperman K.J., Desbois M., Adrados I., Borgen M.A., Giles A.C., Duckett D.R., Grill B. Autophagy is inhibited by ubiquitin ligase activity in the nervous system. Nat. Commun. 2019;10:5017. doi: 10.1038/s41467-019-12804-3. - DOI - PMC - PubMed
    1. Giles A.C., Desbois M., Opperman K.J., Tavora R., Maroni M.J., Grill B. A complex containing the O-GlcNAc transferase OGT-1 and the ubiquitin ligase EEL-1 regulates GABA neuron function. J. Biol. Chem. 2019;294:6843–6856. doi: 10.1074/jbc.RA119.007406. - DOI - PMC - PubMed
    1. Desbois M., Opperman K.J., Amezquita J., Gaglio G., Crawley O., Grill B. Ubiquitin ligase activity inhibits Cdk5 to control axon termination. PLoS Genet. 2022;18 doi: 10.1371/journal.pgen.1010152. - DOI - PMC - PubMed
    1. Chalfie M., Tu Y., Euskirchen G., Ward W.W., Prasher D.C. Green fluorescent protein as a marker for gene expression. Science. 1994;263:802–805. doi: 10.1126/science.8303295. - DOI - PubMed
    1. Mello C.C., Kramer J.M., Stinchcomb D., Ambros V. Efficient gene transfer in C. elegans: extrachromosomal maintenance and integration of transforming sequences. EMBO J. 1991;10:3959–3970. - PMC - PubMed

LinkOut - more resources