. 2023 Jun 2;8(84):eadd7446.
doi: 10.1126/sciimmunol.add7446. Epub 2023 Jun 9.

Rapid recruitment and IFN-I-mediated activation of monocytes dictate focal radiotherapy efficacy

Affiliations

Rapid recruitment and IFN-I-mediated activation of monocytes dictate focal radiotherapy efficacy

Sirimuvva Tadepalli et al. Sci Immunol. .

Abstract

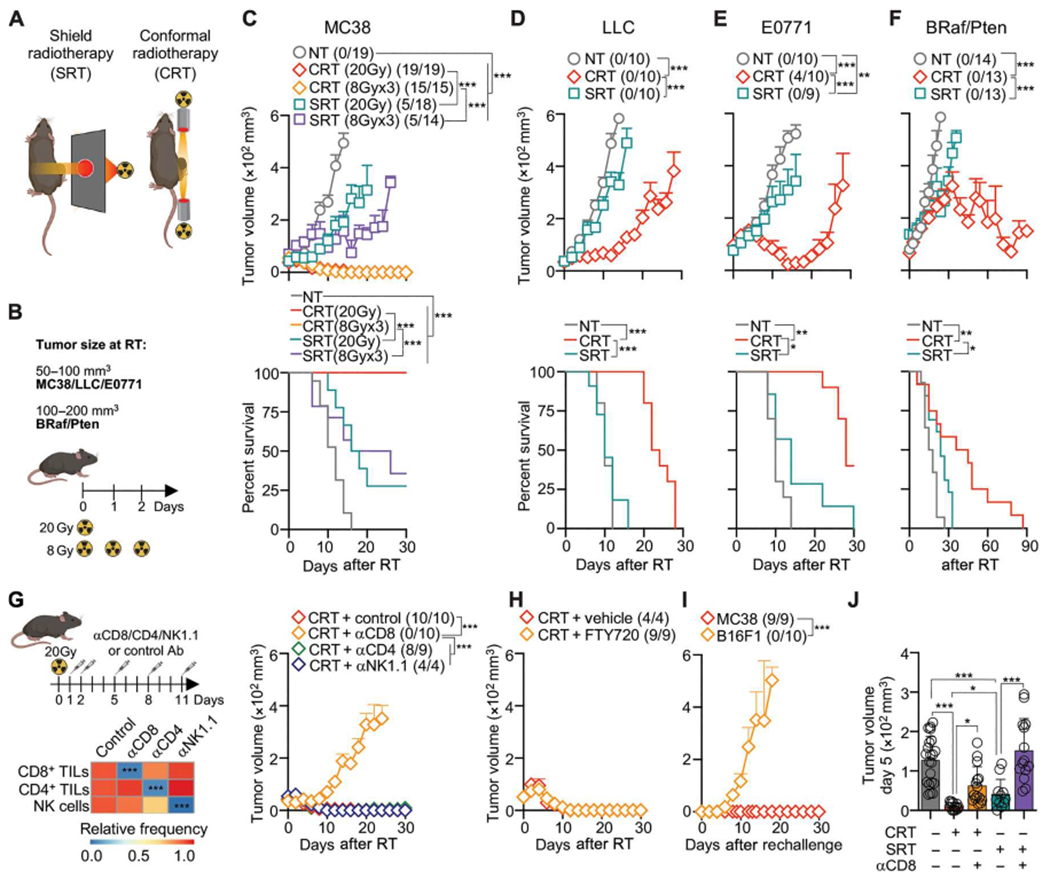
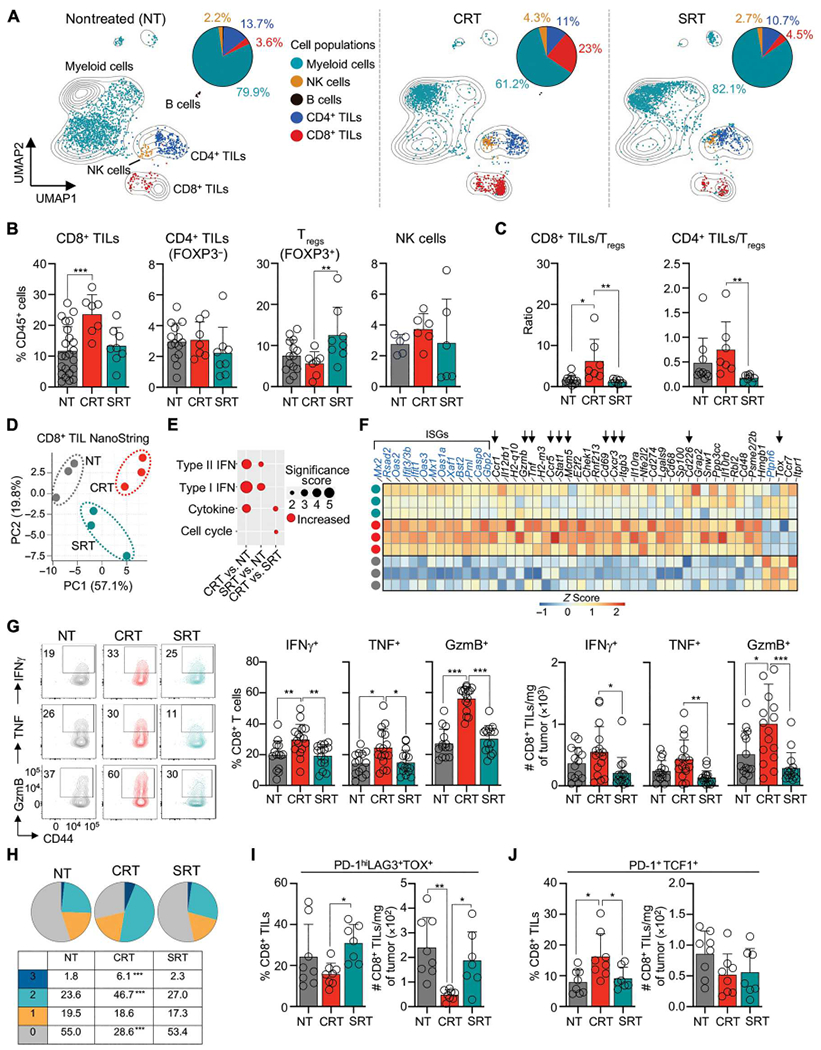
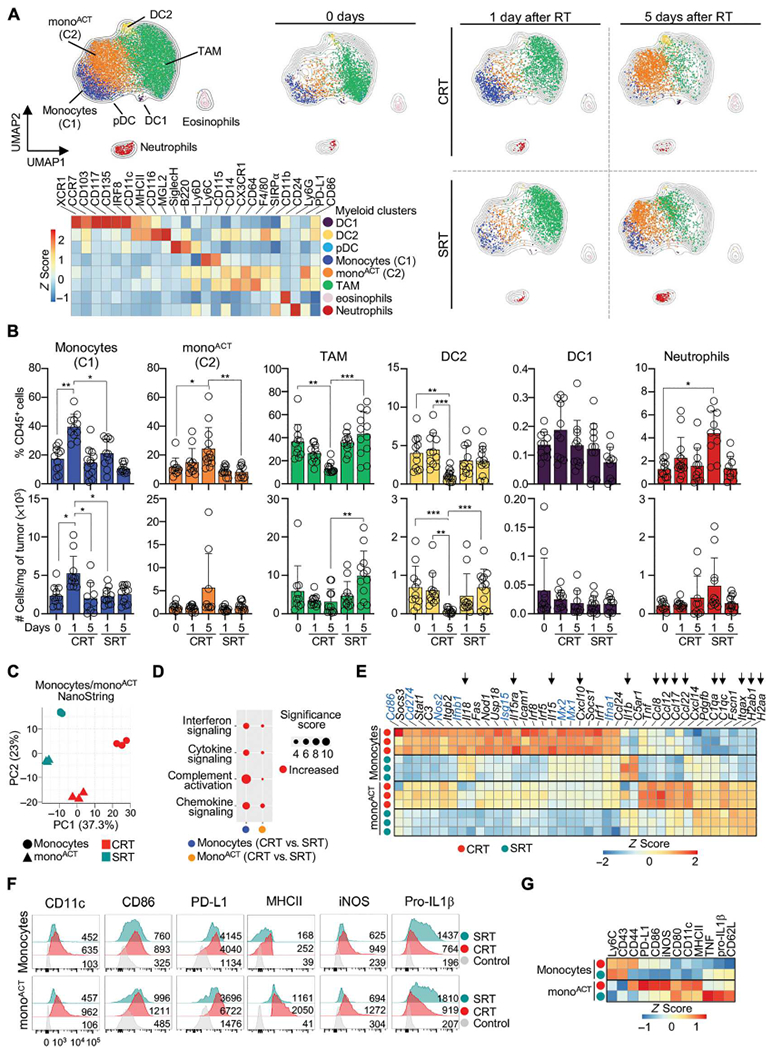
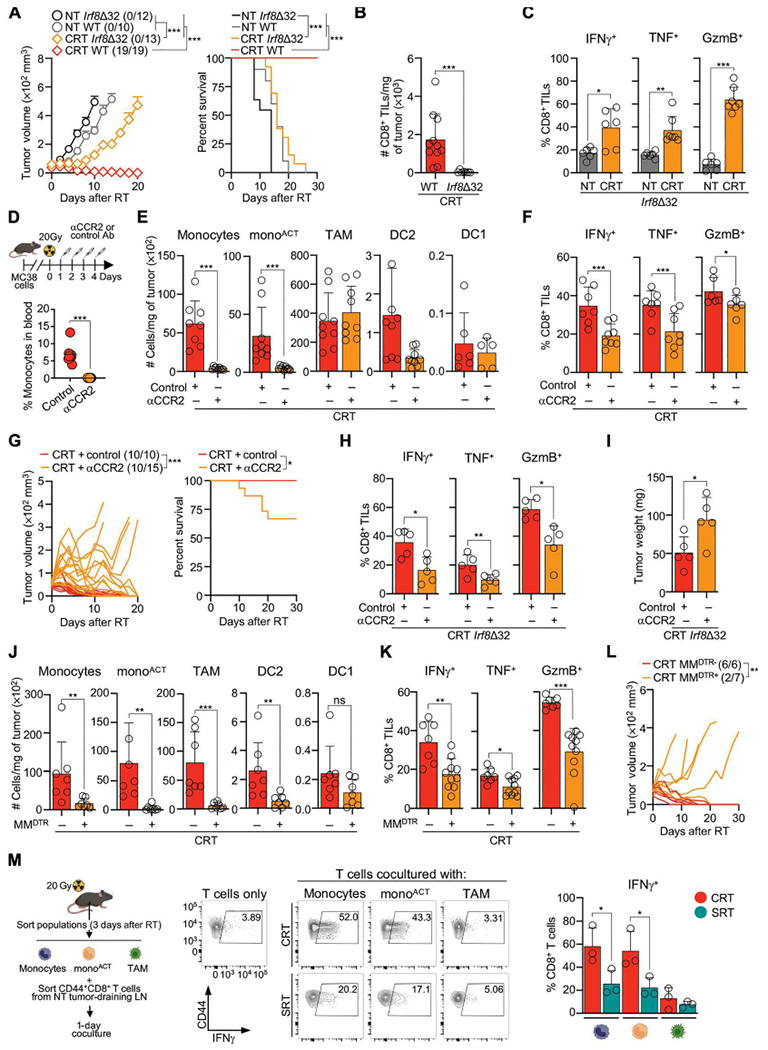
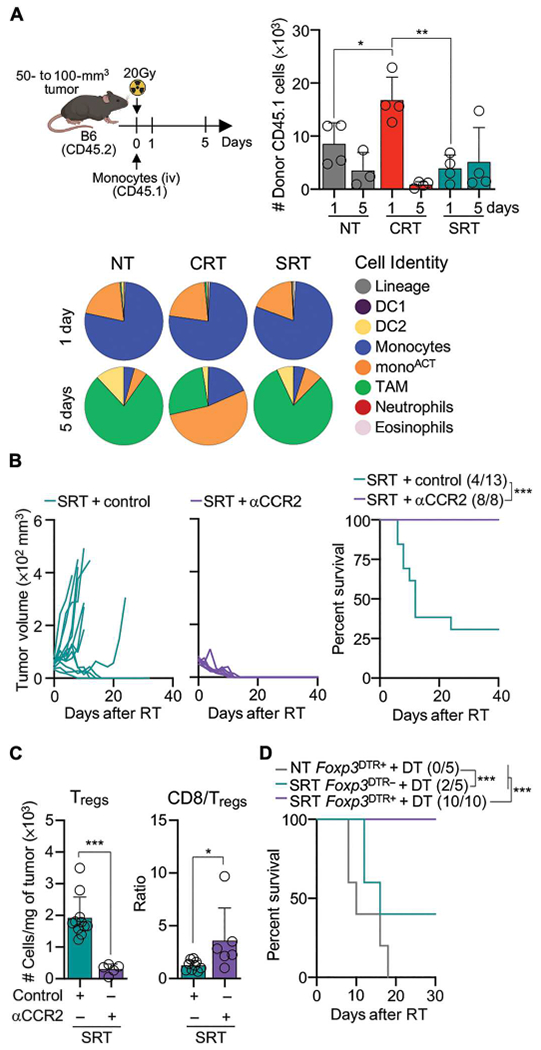
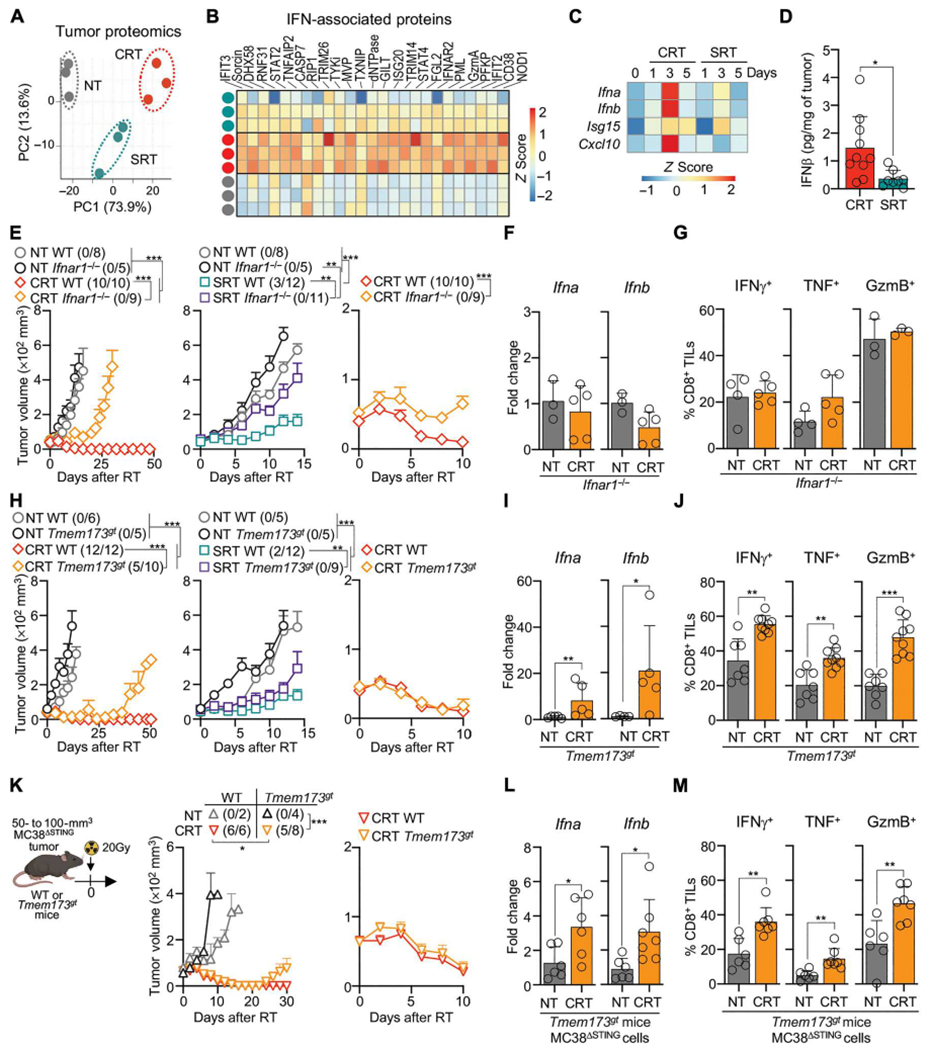
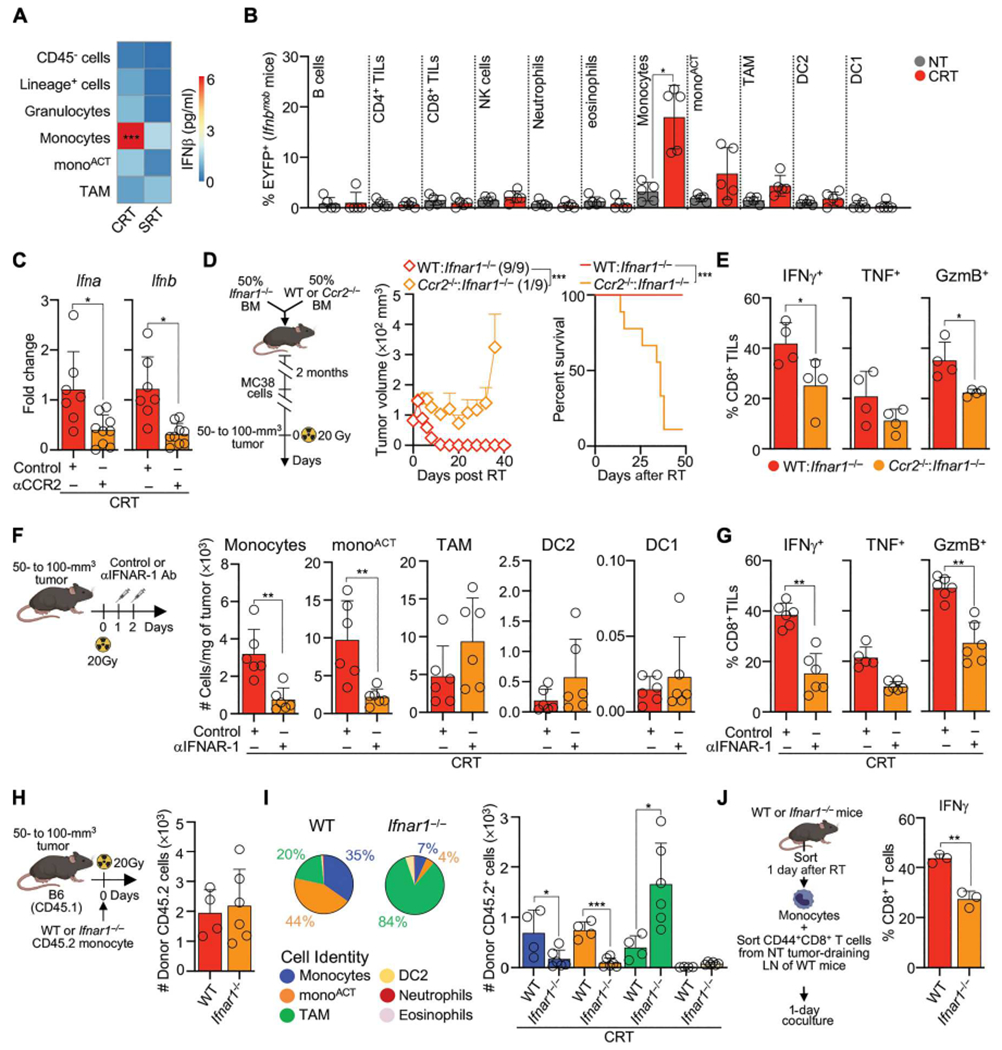
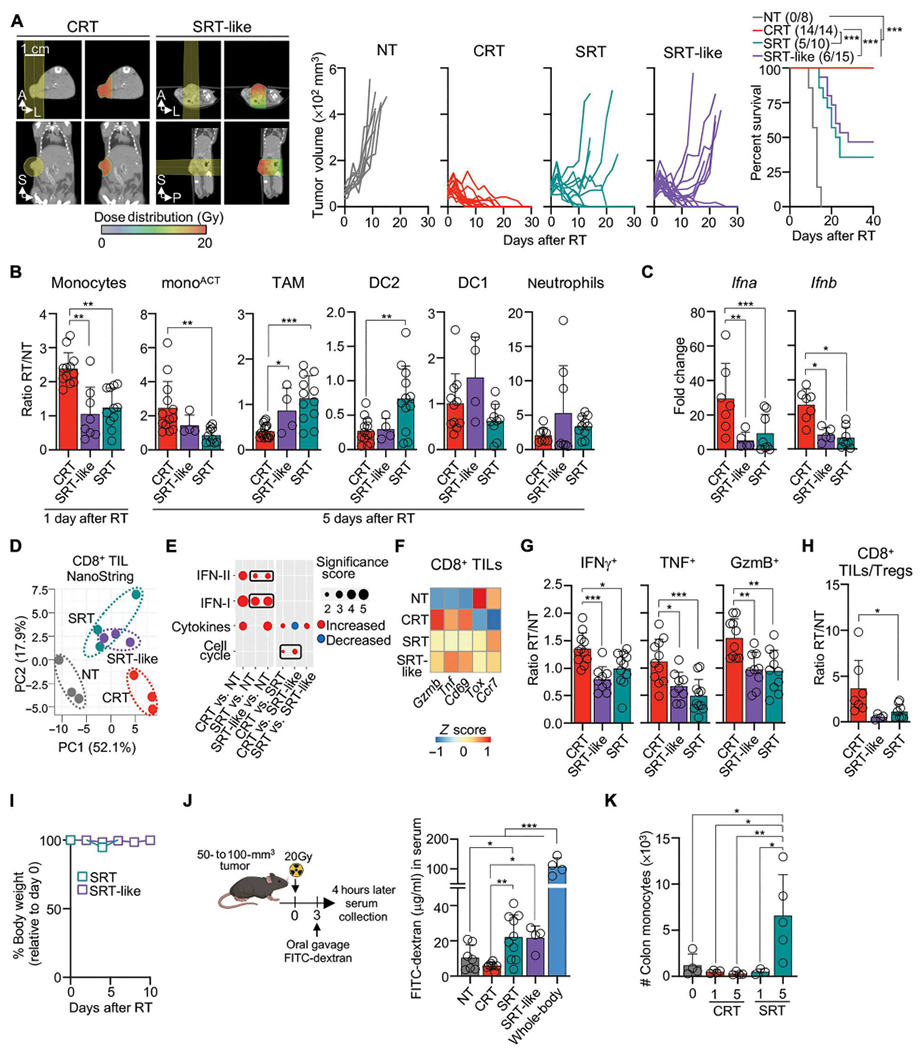
The recruitment of monocytes and their differentiation into immunosuppressive cells is associated with the low efficacy of preclinical nonconformal radiotherapy (RT) for tumors. However, nonconformal RT (non-CRT) does not mimic clinical practice, and little is known about the role of monocytes after RT modes used in patients, such as conformal RT (CRT). Here, we investigated the acute immune response induced by after CRT. Contrary to non-CRT approaches, we found that CRT induces a rapid and robust recruitment of monocytes to the tumor that minimally differentiate into tumor-associated macrophages or dendritic cells but instead up-regulate major histocompatibility complex II and costimulatory molecules. We found that these large numbers of infiltrating monocytes are responsible for activating effector polyfunctional CD8+ tumor-infiltrating lymphocytes that reduce tumor burden. Mechanistically, we show that monocyte-derived type I interferon is pivotal in promoting monocyte accumulation and immunostimulatory function in a positive feedback loop. We also demonstrate that monocyte accumulation in the tumor microenvironment is hindered when RT inadvertently affects healthy tissues, as occurs in non-CRT. Our results unravel the immunostimulatory function of monocytes during clinically relevant modes of RT and demonstrate that limiting the exposure of healthy tissues to radiation has a positive therapeutic effect on the overall antitumor immune response.


Conflict of interest statement

Competing interests: J.I. serves on the scientific advisory board of Immunitas Therapeutics. All the other authors declare that they have no competing interests.

Figures

Fig. 1.
Fig. 1.. CRT efficacy depends on CD8+ TILs.
(A and B) Schematic of RT modes and fractionation regimen. (C to F) B6 mice were implanted with MC38 subcutaneously (n = 14 to 19 per group, three to five experiments), LLC subcutaneously (n = 10 per group, two or three experiments), and E0771 orthotopically (n = 9 or 10 per group, two experiments). BRaf/Pten tumors were induced by 4-hydroxytamoxifen (n = 13 or 14 per group, two to four experiments). Top: Mean tumor growth + SEM with ratio of surviving mice in parentheses. Bottom: Survival curves. (C) Tumors were treated with 20 Gy or three 8-Gy (8 Gy ×3) doses of RT. (D to F) Tumors were treated with 20 Gy RT. (G) MC38-bearing mice after CRT and 200 μg of αCD8, αCD4, αNK1.1, or control Ab. Left: Heatmap of relative blood leukocyte frequency relative to control Ab at 3 days after RT (n = 4 to 10 per group, three experiments). Right: Mean tumor growth + SEM (n = 4 to 10 per group, one or two experiments). (H) MC38-bearing mice after CRT and 100 μg of FTY720 inoculated daily from −1 to 10 days (means + SEM; n = 4 to 10 per group, two experiments). (I) MC38-bearing mice that eliminated tumors after 20 Gy CRT were rechallenged 50 days later with MC38 or B16F1 (means + SEM; n = 9 or 10 per group, two experiments). (J) Mean tumor volume + SD at 5 days after RT and αCD8/control Ab inoculation (n = 11 to 21 per group, three to five experiments). Statistics: Two-way ANOVA plus Tukey’s post hoc test for mean tumor growth (C to I); Mantel-Cox test for survival curves (C to F); one-way ANOVA plus Tukey’s post hoc test (J).
Fig. 2.
Fig. 2.. CRT increases effector CD8+ TIL function.
(A) CyTOF analysis of immune cells in MC38 tumors 5 days after RT or NT. UMAP of all cells and treatments (contour plot) were overlaid with cell populations for each treatment. Pie charts show frequency of cells per total leukocytes. (B) TIL frequency 5 days after RT, by flow cytometry (n = 5 to 23 per group, two or three experiments). (C) As in (B), but CD8+ or CD4+ TIL to Treg ratio (n = 7 to 10 per group, two or three experiments). (D to F) NanoString transcriptomic analysis of CD8+ TILs sorted from NT, or 3 days after RT. (D) PCA of DEGs. (E) Pathway enrichment analysis of DEGs. Size indicates significance score. (F) Heatmap of normalized counts of CRT versus NT DEGs (Z-scored). Selected IFN-stimulated genes (blue) and other genes of interest (arrows). (G to J) MC38 tumors from NT or 3 days after RT, by flow cytometry. (G) Representative flow cytometry plots (left), frequency (middle), and total number per milligram of tumor (right) of CD8+ TILs producing IFN-γ, TNF, and GzmB after ex vivo restimulation (n = 13 to 15 per group, three to five experiments). (H) As in (G), but the proportion of CD8+ TILs producing 1, 2, or 3 effector molecules by Boolean gating analysis. (I and J) Frequency and total number per milligram of tumor PD-1hiLAG3+TOX+CD8+ TILs (I) and PD-1+TCF1+CD8+ TILs (J). Statistics: One-way ANOVA plus Tukey’s post hoc test.
Fig. 3.
Fig. 3.. CRT induces rapid infiltration and activation of monocytes.
(A) MC38 tumors from NT, 1 and 5 days after RT, by CyTOF. Myeloid cells were gated as live/singlets/CD45+/CD3/CD19/CD335/CD8 (n = 3 per group, two experiments). Top left: UMAP of all cells and treatments. Right: UMAPs of each treatment condition overlaid onto UMAP of all cells. Bottom Left: Heatmap represents Z-scored expression of markers in clusters across all conditions. (B) Frequency (top) and total number per milligram of tumor (bottom) of each population at 1 and 5 days after RT, by flow cytometry (n = 11 to 13 per group, two or three experiments). (C to E) NanoString transcriptomic analysis of monocytes and monoACT 3 days after RT. (C) PCA of normalized cell counts. (D) Pathway enrichment analysis of normalized counts. Size indicates significance score. (E) Heatmap of normalized counts of monocytes after CRT versus all conditions (Z-scored). Selected IFN-associated genes (blue), and other genes of interest (arrows). (F and G) Monocytes and monoACT 3 days after RT, by flow cytometry. (n = 3 to 5 per group, two or three experiments). (F) Representative histograms showing the geometric mean fluorescent intensity. (G) Heatmap of Z-scored marker expression. Statistics: One-way ANOVA plus Tukey’s post hoc test (B).
Fig. 4.
Fig. 4.. CRT-recruited monocytes promote effector CD8+ TIL function.
(A to C) MC38-bearing WT or Irf8Δ32 mice after CRT. (A) Mean tumor growth + SEM (left) and survival curve (right) (n = 10 to 19 per group, three or four experiments). (B) CD8+ TIL number per milligram of tumor 3 days after RT by flow cytometry (n = 9 to 11 per group, three experiments). (C) As in (B), but frequency of CD8+ TILs expressing IFN-γ, TNF, and GzmB after ex vivo restimulation (n = 6 or 7 per group, three experiments). (D to G) MC38-bearing WT mice after CRT and αCCR2/control Ab. (D) αCCR2 Ab inoculation schematic (top) and blood monocytes frequency at 3 days (bottom). (E) Number of cells per milligram of tumor 3 days after RT (n = 5 to 9 per group, three or four experiments). (F) Frequency of CD8+ TILs expressing IFN-γ, TNF, and GzmB 3 days after RT, after ex vivo restimulation (n = 7 or 8 per group, two or three experiments). (G) Individual mouse tumor growth (left; ratio of surviving mice in parentheses) and survival curves (right) (n = 10 to 15 per group, three experiments). (H and I) As in (D), but with Irf8Δ32 mice collected at 3 days after CRT (n = 5 per group, two experiments) (H) Frequency of CD8+ TILs expressing IFN-γ, TNF, and GzmB. (I) Tumor weight. (J to L) MC38-bearing MMDTR− and MMDTR+ mice after CRT and 4 ng/g of body weight DT inoculated on day 0 (intravenous) and days 1, 2, 3, and 4 (intraperitoneal). (J) Cells per milligram of tumor 3 days after CRT (n = 7 per group, two experiments). (K) Frequency of CD8+ TILs expressing IFN-γ, TNF, and GzmB 3 days after CRT, after ex vivo restimulation (n = 7 to 10 per group, three experiments). (L) Individual mouse tumor growth after CRT and DT inoculation (n = 6 or 7 per group, two experiments). (M) Ex vivo coculture of tumor-sorted myeloid cell populations (3 days after RT) with effector/memory CD8+ T cells sorted from tumor-draining LNs of NT mice. Experimental schematic (left), representative flow cytometry (middle) and accumulative data (right) of IFN-γ+CD8+ T cells 1 day after coculture (n = 3 per group, three experiments). Statistics: Two-way ANOVA plus Tukey’s post hoc test for mean tumor growth (A, G, and L); Mantel-Cox test for survival curves (A and G); unpaired t test (B to F and H to K); one-way ANOVA plus Tukey’s post hoc test (M).
Fig. 5.
Fig. 5.. CRT, but not SRT, promotes monocyte activation.
(A) BM CD45.1 monocytes were adoptively transferred into MC38-bearing CD45.2 mice 2 hours after RT. Top left: Experimental design. Top right:Transferred cells detected in tumors 1 and 5 days after RT by flow cytometry. Bottom: CD45.1 cell identity (n = 4 per group, two experiments). (B) MC38-bearing mice after SRT and αCCR2/control Ab (as in Fig. 4D). Left: Individual mouse tumor growth. Right: Survival curves with ratio of surviving mice in parentheses (n = 8 to 13 per group, two or three experiments). (C) Tregs Per milligram of tumor (left) and ratio of CD8+ TILs/Tregs (right) 5 days after SRT. (D) MC38-bearing Foxp3DTR+ and Foxp3DTR− mice NT or after SRT and DT inoculation (1 and 0.5 μg at 3 and 6 days after SRT, respectively) (n = 5 to 10 per group, three experiments). Statistics: Two-way ANOVA plus Tukey’s post hoc test for individual tumor growth curves (B); Mantel-Cox test for survival curves (B and D); unpaired t test (C); one-way ANOVA and Kruskal-Wallis post hoc test (A).
Fig. 6.
Fig. 6.. CRT eliminates tumors through an IFN-I–dependent but STING-independent signaling pathway.
(A to C) MC38 tumors from WT mice, NT or 5 days after RT. (A) PCA of tumor protein differential abundance by mass spectrometry (n = 3 per group, one experiments). (B) Selected IFN-associated proteins, relative abundance (Z-scored) by mass spectrometry. (C) Ifna, Ifnb, Isg15, and Cxcl10 by qPCR (n = 5 to 20 per group, two to four experiments). (D) IFN-β ELISA of tumor lysates 3 days after RT (n = 8 to 10 per group, three experiments). (E to G) MC38-bearing WT and Ifnar1−/− mice after RT. (E) Mean tumor growth + SEM (n = 5 to 10 per group, two or three experiments). Left and middle curves show CRT and SRT, respectively. Right curves show the first 10 days after CRT. (F) Tumor Ifna and Ifnb in NT mice or 3 days after CRT by qPCR (n = 5 per group, two experiments). (G) CD8+ TILs expressing IFN-γ, TNF, and GzmB in NT mice or 3 days after CRT by flow cytometry (n = 3 to 5 per group, two experiments). (H to J) As in (E) to (G) but comparing MC38-bearing WT and Tmem173gt mice. (Kto M) MC38ΔSTING-bearing WT or Tmem173gt mice NT or after CRT. (K) Mean tumor growth + SEM over time (left) or 10 days after CRT (right) (n = 4 to 8, two experiments, except n = 2 for NT WT mice to control for MC38ΔSTING growth). (L) Ifna and Ifnb in tumors 3 days after CRT by qPCR (n = 6 or 7 per group, two experiments). (M) Frequency of CD8+ TILs producing IFN-γ, TNF, and GzmB by flow cytometry. Statistics: Two-way ANOVA plus Tukey’s post hoc test for mean tumor growth (E, H, and K); unpaired t test (D, F, G, I, J, L, and M).
Fig. 7.
Fig. 7.. Monocytes are the main producers and responders to IFN-I after CRT.
(A) Sorted cells from NT or 3 days after RT from MC38 tumors were cultured for 12 to 15 hours, and supernatant IFN-β was measured by ELISA (n = 3 to 6 per group, three to five experiments) (B) Tumors from MC38-bearing Ifnbmob mice were analyzed 3 days after CRT for EYFP+ cells (n = 5 per group, three experiments) by flow cytometry. Values are normalized to NT controls. (C) Tumor Ifna and Ifnb 3 days after CRT and αCCR2/control Ab by qPCR (n = 7 to 9 per treatment, two or three experiments). (D and E) Mixed BMCs generated by engrafting 50% Ifnar1−/− BM and 50% WT or Ccr2−/− BM into lethally irradiated CD45.1 mice. BMCs were transplanted with MC38 tumors and were CRT-treated. (D) Schematic experimental design (left), mean tumor growth + SEM with ratio of surviving mice in parentheses (middle), and survival curves (right) (n = 9 per group, two experiments). (E) Frequency of CD8+ TILs producing IFN-γ, TNF, and GzmB 3 days after CRT, after ex vivo restimulation (n = 4 per group, one experiments). (F and G) MC38-bearing mice after CRT and αIFNAR-1/control Ab. (F) Cells per milligram of tumor 3 days after CRT by flow cytometry (n = 6 per group, two experiments). (G) Frequency of CD8+ TILs producing IFN-γ, TNF, and Gzmb 3 days after CRT, after ex vivo restimulation (n = 6 per group, two experiments). (H and I) WT or Ifnar1−/− BM monocytes (CD45.2) were adoptively transferred into MC38-bearing CD45.1 mice 1 to 2 hours after CRT. (H) Number of tumor-infiltrating CD45.2 donor cells 3 days after CRT (n = 4 per group, two experiments). (I) Cell type proportion (left) and number (right) of recovered CD45.2 cells (n = 4 per group, two experiments). (J) MC38-infiltrating monocytes sorted from WT or Ifnar1−/− mice 1 day after CRT were cocultured with CD44+CD8+ T cells sorted from MC38 tumor-draining LNs of NT mice. Frequency of IFN-γ+CD8+ T cells 1 day after coculture by flow cytometry (n = 3 per group, two experiments). Statistics: One-way ANOVA plus Tukey’s post hoc test (A, B, and I); unpaired t test (C, E, F, G, H, and J); two-way ANOVA plus Tukey’s post hoc test for tumor growth and Mantel-Cox test for survival (D).
Fig. 8.
Fig. 8.. CRT efficacy decreases when radiation affects healthy tissues.
(A) CT scans with beam orientation and dose distribution (left), individual tumor growth for MC38-bearing WT mice NT and after RT (middle), and survival curves with ratio of surviving mice in parentheses (right) (n = 8 to 15 per group, two or three experiments) (B to H) MC38-bearing mice after RT. (B) Cell numbers relative to NT controls for 1 day (monocytes) or 5 days (remaining populations) after RT by flow cytometry (n = 4 to 12 mice, two orthree experiments). (C) Tumor Ifna and Ifnb 3 days after RT relative to NT controls by qPCR (n = 5 to 8 per group, two or three experiments). (D to F) Transcriptomic analysis of CD8+ TILs 3 days after RT by NanoString (n = 3 per group). (D) PCA of the DEGs. (E) Pathway enrichment analysis of DEGs. The size and color indicate the significance score and up-regulated/down-regulated genes, respectively. (F) Normalized counts of selected genes (Z-scored). (G) CD8+ TILs producing IFN-γ, TNF, and GzmB 3 days after RT relative to NT controls by flow cytometry (n = 4 to 16 mice, two to four experiments). (H) Ratio of CD8+ TILs/Tregs. (I) Body weight after RT shown relative to time 0 measurements (n = 5 per group, two experiments). (J) Left: Diagram of FITC-dextran oral gavage of MC38-bearing mice, performed 3 days after RT. Right: Serum FITC-dextran measured 4 hours after gavage by spectrophotometer (n = 4 to 10 mice per group, three experiments). (K) Number of colon monocytes 1 or 5 days after RT by flow cytometry (n = 3 to 5 per group, two experiments). Statistics: Mantel-Cox test for survival curve (A); one-way ANOVA plus Tukey’s post hoc test (B, C, G, H, J, and K); two-way ANOVA plus Tukey’s post hoc test (I).

Comment in

References

    1. Liang H, Deng L, Hou Y, Meng X, Huang X, Rao E, Zheng W, Mauceri H, Mack M, Xu M, Fu Y-X, Weichselbaum RR, Host STING-dependent MDSC mobilization drives extrinsic radiation resistance. Nat. Commun 8, 1736 (2017). - PMC - PubMed
    1. Xu J, Escamilla J, Mok S, David J, Priceman S, West B, Bollag G,McBride W, Wu L, CSF1R signaling blockade stanches tumor-infiltrating myeloid cells and improves the efficacy of radiotherapy in prostate cancer. Cancer Res. 73, 2782–2794 (2013). - PMC - PubMed
    1. Hegde S, Leader AM, Merad M, MDSC: Markers, development, states, and unaddressed complexity. Immunity 54, 875–884 (2021). - PMC - PubMed
    1. Ostrand-Rosenberg S, Horn LA, Ciavattone NG, Radiotherapy both promotes and inhibits myeloid-derived suppressor cell function: Novel strategies for preventing the tumor-protective effects of radiotherapy. Front. Oncol 9, 215 (2019). - PMC - PubMed
    1. Chen H-M, Ma G, Gildener-Leapman N, Eisenstein S, Coakley BA, Ozao J, Mandeli J, Divino C, Schwartz M, Sung M, Ferris R, Kao J, Wang L-H, Pan P-Y, Ko EC, Chen S-H, Myeloid-derived suppressor cells as an immune parameter in patients with concurrent sunitinib and stereotactic body radiotherapy. Clin. Cancer Res 21, 4073–4085 (2015). - PMC - PubMed

Substances