. 2023 Jun 9;9(23):eabq7595.
doi: 10.1126/sciadv.abq7595. Epub 2023 Jun 9.

Translational imaging of TSPO reveals pronounced innate inflammation in human and murine CD8 T cell-mediated limbic encephalitis

Affiliations

Translational imaging of TSPO reveals pronounced innate inflammation in human and murine CD8 T cell-mediated limbic encephalitis

Marco Gallus et al. Sci Adv. .

Abstract

Autoimmune limbic encephalitis (ALE) presents with new-onset mesial temporal lobe seizures, progressive memory disturbance, and other behavioral and cognitive changes. CD8 T cells are considered to play a key role in those cases where autoantibodies (ABs) target intracellular antigens or no ABs were found. Assessment of such patients presents a clinical challenge, and novel noninvasive imaging biomarkers are urgently needed. Here, we demonstrate that visualization of the translocator protein (TSPO) with [18F]DPA-714-PET-MRI reveals pronounced microglia activation and reactive gliosis in the hippocampus and amygdala of patients suspected with CD8 T cell ALE, which correlates with FLAIR-MRI and EEG alterations. Back-translation into a preclinical mouse model of neuronal antigen-specific CD8 T cell-mediated ALE allowed us to corroborate our preliminary clinical findings. These translational data underline the potential of [18F]DPA-714-PET-MRI as a clinical molecular imaging method for the direct assessment of innate immunity in CD8 T cell-mediated ALE.


Figures

Fig. 1.
Fig. 1.. [18F]DPA-714 PET-MRI of patients with autoimmune limbic encephalitis.
FLAIR-MRI (left), [18F]DPA-714 PET (middle), and fused (right) images of three representative patients with seropositive and seronegative ALE [one case of ALE with anti-GAD65 AABs (top), one case of ALE with anti-Hu AABs (and other AABs targeting intracellular neural antigens; center), and one case of ALE without detectable AABs (bottom)]. Focal uptake in amygdala/hippocampus of the affected hemisphere is marked with an arrow.
Fig. 2.
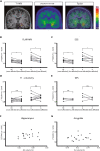
Fig. 2.. Quantitative analysis of the [18F]DPA-714 PET in relation to FLAIR-MRI, EEG, T1-MRI, and neuropsychological functioning of patients with ALE.
(A) Representative coronal T1-weighted MR (left) and [18F]DPA-714-PET (center) image of a patient with ALE with marked left mesial temporal encephalitis (red) and fused image (right). (B to E) Quantification of the SUVR of the hippocampus (HC) and amygdala (A) of patients with ALE (n = 10) according to lateralization of FLAIR signal (B, HC: P = 0.008; A: P = 0.004), EEG (C, HC: P = 0.016; A: P = 0.008), T1-volume (D, HC: P = 0.570; A: P = 0.910), and neuropsychological (NPS) testing (E, HC: P = 0.625; A: P = 0.625). Cross-correlation between relative MRI–based volume and SUVR of the hippocampus (F) and the amygdala (G) in patients with ALE (hippocampus, r2 = 0.13 and P = 0.61; amygdala, r2 = 0.07 and P = 0.79). Statistical significance between groups in (A) to (E) was determined with two-tailed Mann-Whitney U test or Wilcoxon signed-rank test. Correlation between MRI volume and activity concentration was investigated using Spearman correlation coefficient.
Fig. 3.
Fig. 3.. TSPO colocalizes with activated microglia and reactive astrocytes in seropositive and seronegative CD8 T cell–mediated ALE.
(A) Overview of the TSPO expression pattern in human brain specimen derived from healthy brain, temporal lobe epilepsy without any inflammation, ALE with anti-Hu AABs, and acute and chronic ALE with anti-GAD65 AABs. In healthy brain, TSPO can be found at low levels not only in Iba-1+ microglia but also in other cell types such as endothelial cells, oligodendrocyrtes and astrocytes. Moreover, in TLE without inflammation and without neurodegeneration, Iba-1+ microglial cells are only weakly TSPO reactive. In anti-Hu ALE, TSPO is strongly up-regulated in areas with extensive T cell infiltration, especially mirroring Iba-1+ microglia activation. During acute inflammation and neurodegeneration, TSPO reflects mainly reactive gliosis in anti-GAD65 ALE. In the chronic stage of anti-GAD65 where T cell inflammation subsided, TSPO shows moderate activity in microglia and astrocytes. (B) Exemplary costaining of TSPO with Iba-1 in CD8 T cell–mediated human seropositive (anti-Hu and anti-GAD65 ALE) and seronegative specimen. In particular, in seropositive anti-Hu ALE and anti-GAD65 ALE, the presence of CD8 T cells is associated with strong TSPO reactivity in surrounding microglia. In seronegative ALE, TSPO+ microglia and astrocytes (yellow arrowhead) can be seen together with TSPO-negative microglia (red arrowhead) and TSPO-negative neurons (white arrowhead).
Fig. 4.
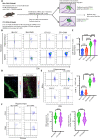
Fig. 4.. Peripheral immunization induces antigen-specific CD8 T cell–mediated limbic encephalitis in C57BL/6 mice after AAV-mediated hippocampal neuronal antigen transfer.
(A) C57BL/6 mice were immunized with the SIINFEKL peptide in combination with CASAC and received i.p. 200 ng of PT 24 and 72 hours later. Seven days after the immunization, bilateral stereotactic injections of rAAV vectors into the CA1 region of the hippocampus were performed. Animals received either the OVAV inducing OVA expression together with the yellow-fluorescent protein Venus or a vector inducing emerald green fluorescent protein expression as control (CV) under the neuron-specific human synapsin-1 promoter. To compare our BL6 model to our previously published ALE model, vector injection was also performed in OT-I mice. Experimental readout was performed 1 week after surgery. (B) Flow cytometry dot plots representing number and percentage of antigen-specific (Tetramer+) CD8 cells in the hippocampus and spleen of immunized C57BL/6 mice and OT-I animals. (C) Quantification of antigen-specific T cells in the hippocampus. n = 8 per group. BL6-OVAV animals show significantly more antigen-specific T cells in the hippocampus compared to the control groups (BL6-OVAV versus BL6-CV, P = 0.0043; BL6-OVAV versus OT-I-CV, P = 0.0052) and significantly less compared to OT-I-OVAV mice (P = 0.0001). (D) OVA expression (green) but not GFP protein (green) expression attracts CD8 T cells (red) into the hippocampus. (E) Flow cytometry dot plots show representative intracellular IFN-γ expression (in %) in CD8+ T cells. n = 8 animals per group; hippocampi of two animals were pooled for analysis. BL6-OVAV and OT-I-OVAV hippocampus-derived antigen-specific cells showed similar (P = 0.24) significantly elevated INF-γ expression when compared to the control groups (P = 0.0001). (F) CD8+-Tetramer+ T cells derived from the hippocampus of OVAV-injected animals show similar CD25 (P = 019) and CD69 (P = 0.08) expression. Statistical significance between groups in (C) and (E) was determined with one-way ANOVA and subsequent Tukey post hoc test and in (F), with Student’s t test.
Fig. 5.
Fig. 5.. Immunization-induced antigen-specific CD8 T cell–mediated limbic encephalitis in wild-type C57BL/6 mice is associated with neuronal loss, long-term memory impairment, and acute clinical epileptic seizures.
(A) Representative staining 1 week after vector-based neuronal antigen transfer demonstrates areas with neuron-specific protein NeuN signal loss (*) in the hippocampus of BL6-OVAV animals. In BL6-CV animals, no pathological changes were observed. The white arrow indicates the stereotactic insertion channel. (B) NOR displayed significantly impaired long-term (retrieval after 24 hours) spatial memory performance (P = 0.001), while short-term and intermediate-term (retrieval after 5 min and 4 hours) spatial memory performance was unaltered in BL6-OVAV (n = 20 light gray) compared to BL6-CV (n = 20 dark gray) mice within 1 week after vector-based neuronal antigen transfer. Statistical significance was determined by two-way ANOVA with Bonferroni post hoc test. (C) Furthermore, all BL6-OVAV animals showed at least one acute clinical epileptic seizure, while in the BL6-CV group, no epileptic seizures were observed. (D) Classification of the clinically observed epileptic seizures according to the Racine scale. Most of the animals showed grade I or II epileptic seizures.
Fig. 6.
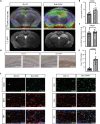
Fig. 6.. CD8 T cell–mediated limbic encephalitis is associated with hippocampal T2-signal and volume increase as well as significantly increased TSPO-radiotracer uptake.
(A) Representative [18F]DPA-714 PET-MRI images coregistered with the corresponding MRI of a SIINFEKL-CASAC immunized CV (left)– and OVAV (right)–injected BL6 mouse 1 week after vector-based neuronal antigen transfer (top row). T2-weighted images with volume enlargement and generalized edema (bright) as signs of inflammation in the hippocampus in the BL6-OVAV group versus the BL6-CV group. Blood remnants (dark) are detectable on the cortex surface due to bilateral intrahippocampal injection in both experimental groups. (B) The mean radiotracer uptake within the right (R) and left (L) hippocampus expressed as percentage of the injected dose per milliliter (%ID/ml) indicated a significant increase in radiotracer uptake in the BL6-OVAV-group compared to the BL6-CV group (n = 12, P = 0.003). (C) Analysis of the MRI-based relative hippocampus volume revealed slight but significant volume enlargement in the BL6-OVAV group compared to the BL6-CV group (n = 16, P = 0.009). (D) Cross-validation of [18F]DPA-714 PET imaging by TSPO immunohistochemistry. (E) The percentage of TSPO+ area was significantly higher in the BL6-OVAV group compared to the BL6-CV-group (n = 18, P < 0.001). (F) TSPO was up-regulated in Iba-1+ microglia, while minor expression was detected in GFAP-positive astrocytes in the hippocampus. Nuclei were counterstained with DAPI (blue). Statistical significance between groups was determined by Student’s t test or Mann-Whitney U test.

References

    1. T. Ravizza, B. Gagliardi, F. Noé, K. Boer, E. Aronica, A. Vezzani, Innate and adaptive immunity during epileptogenesis and spontaneous seizures: Evidence from experimental models and human temporal lobe epilepsy. Neurobiol. Dis. 29, 142–160 (2008). - PubMed
    1. J. Bauer, A. J. Becker, W. Elyaman, J. Peltola, S. Rüegg, M. J. Titulaer, J. A. Varley, E. Beghi, Innate and adaptive immunity in human epilepsies. Epilepsia 58, 57–68 (2017). - PMC - PubMed
    1. C. Geis, J. Planagumà, M. Carreño, F. Graus, J. Dalmau, Autoimmune seizures and epilepsy. J. Clin. Investig. 129, 926–940 (2019). - PMC - PubMed
    1. C. G. Bien, C. E. Elger, Limbic encephalitis: A cause of temporal lobe epilepsy with onset in adult life. Epilepsy Behav. 10, 529–538 (2007). - PubMed
    1. C. G. Bien, A. Schulze-Bonhage, M. Deckert, H. Urbach, C. Helmstaedter, T. Grunwald, C. Schaller, C. E. Elger, Limbic encephalitis not associated with neoplasm as a cause of temporal lobe epilepsy. Neurology 55, 1823–1828 (2000). - PubMed

Supplementary concepts