. 2023 Jun 9;9(23):eadf2165.
doi: 10.1126/sciadv.adf2165. Epub 2023 Jun 9.

Airborne fine particles drive H1N1 viruses deep into the lower respiratory tract and distant organs

Affiliations

Airborne fine particles drive H1N1 viruses deep into the lower respiratory tract and distant organs

Zheng Dong et al. Sci Adv. .

Abstract

Mounting data suggest that environmental pollution due to airborne fine particles (AFPs) increases the occurrence and severity of respiratory virus infection in humans. However, it is unclear whether and how interactions with AFPs alter viral infection and distribution. We report synergetic effects between various AFPs and the H1N1 virus, regulated by physicochemical properties of the AFPs. Unlike infection caused by virus alone, AFPs facilitated the internalization of virus through a receptor-independent pathway. Moreover, AFPs promoted the budding and dispersal of progeny virions, likely mediated by lipid rafts in the host plasma membrane. Infected animal models demonstrated that AFPs favored penetration of the H1N1 virus into the distal lung, and its translocation into extrapulmonary organs including the liver, spleen, and kidney, thus causing severe local and systemic disorders. Our findings revealed a key role of AFPs in driving viral infection throughout the respiratory tract and beyond. These insights entail stronger air quality management and air pollution reduction policies.


Figures

Fig. 1.
Fig. 1.. AFPs interact with and load H1N1 viruses.
(A) Schematic diagram showing the preparation of virus-laden airborne fine particles (AFPs). Here, AFPs [50 μg/ml of each; particulate matter with a diameter smaller than 2.5 μm (PM2.5), dust, biochar, and carbon black] were incubated with 1.0 × 10⁴ plaque-forming unit (PFU) H1N1 PR8 viruses for 1 hour and washed three times with phosphate-buffered saline (PBS) before examination of morphology, viral load, and infectivity. (B) Transmission electron microscopy (TEM; top panel) and scanning EM (SEM; bottom panel) images show that H1N1 PR8 viruses (denoted by red squares) are adsorbed into the surface of PM2.5, dust, and biochar but are enveloped by carbon black particles. (C) Quantitative real-time polymerase chain reaction (qRT-PCR) analysis of viral loads on AFPs at 20, 50, and 100 μg/ml (n = 3). Viral load for each AFP was obtained by converting cycle threshold (Ct) values using the standard curves (fig. S3). (D and E) Correlation analysis between (D) surface area and (E) pore volume of AFPs and viral loads on AFPs (50 μg/ml). Pearson correlation (R2) and statistical significance (P value) are shown. *P < 0.05.
Fig. 2.
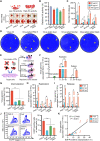
Fig. 2.. AFP-borne viruses remain infectious in vitro.
(A) Viral hemagglutinin (HA) activity assay involves coincubation of viruses and standardized concentration of red blood cells (RBCs; top illustration). Experimental data (bottom panel) showed that RBCs were agglutinated after incubation with solo viruses (virus control) or AFP-virus complexes for 4 hours. (B) Relative HA activity of AFP-borne viruses after 4 hours of incubation (n = 5). AFP concentration is 50 μg/ml, and virus titer is 1.0 × 10⁶ PFU. (C) Numbers of plaques formed in Madin-Darby canine kidney (MDCK) cells treated with virus-laden AFPs (20, 50, and 100 μg/ml; n = 3). (D) Representative images of viral plaques. MDCK cells were infected with solo viruses (at 200 PFU) or virus-laden AFPs (50 μg/ml) and stained with crystal violet following a 48-hour infection. Yellow arrowheads denote viral plaques. (E) Schematic showing internalized (37°C for 1 hour), replicated, and released viruses (8, 24, and 48 hours post infection, hpi) in AFP-borne virus-infected target cells. (F) Quantification of internalized, replicated, and released viruses in A549 cells infected with solo viruses (at 200 PFU) through qRT-PCR assay (n = 4). (G to I) Quantification of (G) internalized, (H) replicated, and (I) released viruses in AFP-borne virus-infected A549 cells (n = 4). (J) Flow cytometry data (left) and corresponding quantitative analysis (right) of A549 cells infected with enhanced green fluorescent protein (EGFP)–tagged viruses bound onto AFPs at 24 hpi (n = 4). SSC-H, side scatter height. (K) Correlation analysis between replicated viruses and EGFP-positive cell percentage in viable cells at 8, 24, and 48 hpi. Pearson correlation (R2) and statistical significance (P value) are shown. *P < 0.05; **P < 0.001.
Fig. 3.
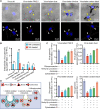
Fig. 3.. AFPs transport viruses into target cells.
(A) Representative merged images of bright-field and fluorescence (top panel) and confocal immunostaining images (bottom panel) of A549 cells upon incubation with solo viruses (at 200 PFU) or virus-laden AFPs (50 μg/ml) for 1 hour. AFPs close to plasma membrane (yellow arrowheads), viruses (white arrowheads), and cell membranes (white dashed lines) are shown. Viral HA protein is stained with an anti-HA antibody (red), and cell nuclei are stained with 4′,6-diamidino-2-phenylindole (DAPI; blue). (B) Quantification of the replicated viruses in A549 cells with and without neuraminidase (NA) pretreatment following 24 hours of infection with virus-laden AFPs (50 μg/ml; n = 3). (C) Quantification of replicated viruses in NA-pretreated A549 cells followed by a 24-hour infection with virus-laden AFPs (50 μg/ml) in the presence of different inhibitors (n = 3). (D) Schematic showing that virus-laden AFPs are mainly internalized through clathrin-dependent endocytosis, followed by lipid raft–mediated endocytosis. *P < 0.05; **P < 0.001, relative to untreated control, or as indicated.
Fig. 4.
Fig. 4.. AFPs favor progeny virion budding.
(A) Representative merged images of bright-field and fluorescence (top panel) and confocal immunostaining images (bottom panel) of A549 cells upon incubation with solo viruses (at 200 PFU) or virus-laden AFPs (50 μg/ml) for 24 hours. Intracellular virions are stained with an anti-HA antibody (red). Lipid rafts are stained with an anti-flotillin 1 antibody (green). Cell nuclei are stained with DAPI (blue). Yellow arrowheads denote the location of AFPs, and white arrowheads indicate intracellular virions. Cells are indicated through dashed lines. (B) Schematic illustrating AFPs in directing the budding and release of progeny virions. (C) Relative ratio of extracellular virus counts to intracellular virus counts at 24 hpi (n = 4). Virus concentration in virus control is the same as that loaded onto each AFP. Data are presented as percent changes relative to the according virus control. (D) Representative merged images of bright-field and fluorescence (top panel) and confocal fluorescence images (bottom panel) of A549 cells treated with AFPs (20 μg/ml) for 24 hours. Red fluorescence (Evans blue) is indicative of the injuries of cell plasma membrane. Cell nuclei are stained with DAPI in blue. *P < 0.05; **P < 0.001, relative to virus control.
Fig. 5.
Fig. 5.. AFPs alter the distribution of viruses along the respiratory tract.
(A) Timeline and experimental design for evaluating viral titers in the nasal cavity, trachea, and lung in BALB/c mice that were intranasally infected with virus-laden AFPs (200 μg/kg body weight). i.n., intranasal. (B) Percentage of viruses detected in the nasal cavity (red), trachea (green), and lung (blue) through SYBR green–based qRT-PCR analysis at 1, 3, and 8 days post infection (dpi; n = 5). Data are presented as the proportion of virus titers at each site relative to the whole titers in the respiratory tract. (C) Inductively coupled plasma mass spectrometry analysis of Au content in the nasal cavity (red), trachea (green), and lung (blue) of mice intranasally administrated with 1.0 mg/kg body weight Au-doped AFPs for 2 hours (n = 4). Data are presented as the proportion of Au content at each site relative to the whole mass in the respiratory tract. (D) Representative nasal cavity sections from mice treated with 1.0 mg/kg body weight virus-laden AFPs for 2 hours. Inserts show magnified views of smaller red squares. Blank control is PBS only. (E) Representative hematoxylin and eosin (H&E)–stained lung sections from mice treated with PBS (blank control), solo viruses, or virus-laden AFPs (200 μg/kg body weight) at 1 dpi. AFP accumulation (black arrowheads) is observed. (F) Representative confocal images of lung sections obtained from mice as described in (E). Viruses are stained with an anti-HA antibody (green), and cell nuclei are stained with DAPI (blue).
Fig. 6.
Fig. 6.. AFPs drive the spread of viruses into extrapulmonary organs.
(A) Representative confocal images of lung sections obtained from mice treated with solo viruses (top panel), SiO2 particles (middle panel), or virus-laden SiO2 particles (200 μg/kg body weight; bottom panel) for 1 day. SiO2 control group received the same mass of particles as the virus-laden SiO2 group. Virus concentration in virus control is equal to that loaded onto SiO2 particles. (B) Representative immunofluorescent staining of the liver, spleen, and kidney sections obtained from mice treated with virus-laden SiO2 particles for 3 days. The right panel indicates magnified views of red squares. Viruses are stained with an anti-HA antibody (green), and cell nuclei are stained with DAPI (blue). (C) Relative changes of virus titers in the blood and distant organs (liver, spleen, and kidney) from mice infected with virus-laden AFPs (200 μg/kg body weight) or solo viruses at 1, 3, and 8 dpi (n = 5). Virus titers are quantified through TaqMan qRT-PCR and presented as percent changes relative to the corresponding virus control at 1 dpi. Ct value >38 was considered nondetectable. (D) Proportion of virus-positive organs in animals infected with virus-laden AFPs (200 μg/kg body weight) in contrast to the same titers of solo viruses at 1 and 3 dpi, as determined by TaqMan qRT-PCR (n = 10). *P < 0.05; **P < 0.001, relative to the corresponding virus control at 1 dpi, or as indicated.
Fig. 7.
Fig. 7.. Virus-laden AFPs cause greater systemic immune responses in vivo than virus infection alone.
Relative changes of neutrophil counts (left panel), lymphocyte counts (middle panel), and the ratio of neutrophil/lymphocyte (right panel) in the peripheral blood of mice treated with (A) PM2.5-, (B) dust-, (C) biochar-, and (D) carbon black–bearing viruses at 200 μg/kg body weight or the same titers of solo viruses at 1, 3, and 8 dpi (n = 5). Change was calculated relative to blank control (PBS). (E) Relative changes in body weight of mice treated with PBS (blank control, green line), AFPs alone (orange line), virus control (purple line), and virus-laden AFPs (red line) over the 8-day infection period. Change in body weight was compared with initial weight (n = 5 mice per group). Virus titers in virus control are the same as those loaded onto according AFPs. *P < 0.05; **P < 0.001, relative to blank control, or as indicated.
Fig. 8.
Fig. 8.. Schematic illustration of the interaction between AFPs and H1N1 virus and the spread of the virus driven by AFPs.
AFPs such as PM2.5, dust, biochar, and carbon black adsorb different amounts of viruses to form infectious AFP-virus complexes (top panel). AFP-virus complexes infect the host cells through a receptor-independent pathway, and AFPs direct the internalization and budding of the viruses (middle panel). Different AFP-borne viruses are distributed at different locations along the respiratory tract and transported into distant extrapulmonary organs (bottom panel).

Similar articles

Cited by

References

    1. Chen G., Zhang W., Li S., Zhang Y., Williams G., Huxley R., Ren H., Cao W., Guo Y., The impact of ambient fine particles on influenza transmission and the modification effects of temperature in China: A multi-city study. Environ. Int. 98, 82–88 (2017). - PMC - PubMed
    1. Wu X., Nethery R. C., Sabath M. B., Braun D., Dominici F., Air pollution and COVID-19 mortality in the United States: Strengths and limitations of an ecological regression analysis. Sci. Adv. 6, eabd4049 (2020). - PMC - PubMed
    1. Kogevinas M., Castaño-Vinyals G., Karachaliou M., Espinosa A., de Cid R., Garcia-Aymerich J., Carreras A., Cortés B., Pleguezuelos V., Jiménez A., Vidal M., O’Callaghan-Gordo C., Cirach M., Santano R., Barrios D., Puyol L., Rubio R., Izquierdo L., Nieuwenhuijsen M., Dadvand P., Aguilar R., Moncunill G., Dobaño C., Tonne C., Ambient air pollution in relation to SARS-CoV-2 infection, antibody response, and COVID-19 disease: A cohort study in Catalonia, Spain (COVICAT Study). Environ. Health Perspect. 129, 117003 (2021). - PMC - PubMed
    1. Dolci M., Favero C., Bollati V., Campo L., Cattaneo A., Bonzini M., Villani S., Ticozzi R., Ferrante P., Delbue S., Particulate matter exposure increases JC polyomavirus replication in the human host. Environ. Pollut. 241, 234–239 (2018). - PubMed
    1. Hussey S. J. K., Purves J., Allcock N., Fernandes V. E., Monks P. S., Ketley J. M., Andrew P. W., Morrissey J. A., Air pollution alters Staphylococcus aureus and Streptococcus pneumoniae biofilms, antibiotic tolerance and colonisation. Environ. Microbiol. 19, 1868–1880 (2017). - PMC - PubMed

Substances