. 2023 Aug 31;142(9):812-826.
doi: 10.1182/blood.2022019333.

Lipid nanoparticles allow efficient and harmless ex vivo gene editing of human hematopoietic cells

Affiliations

Lipid nanoparticles allow efficient and harmless ex vivo gene editing of human hematopoietic cells

Valentina Vavassori et al. Blood. .

Abstract

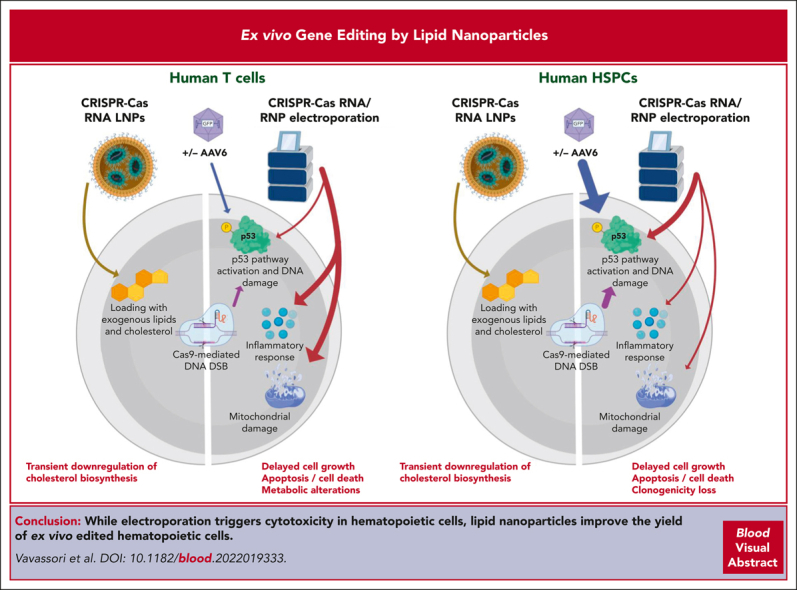
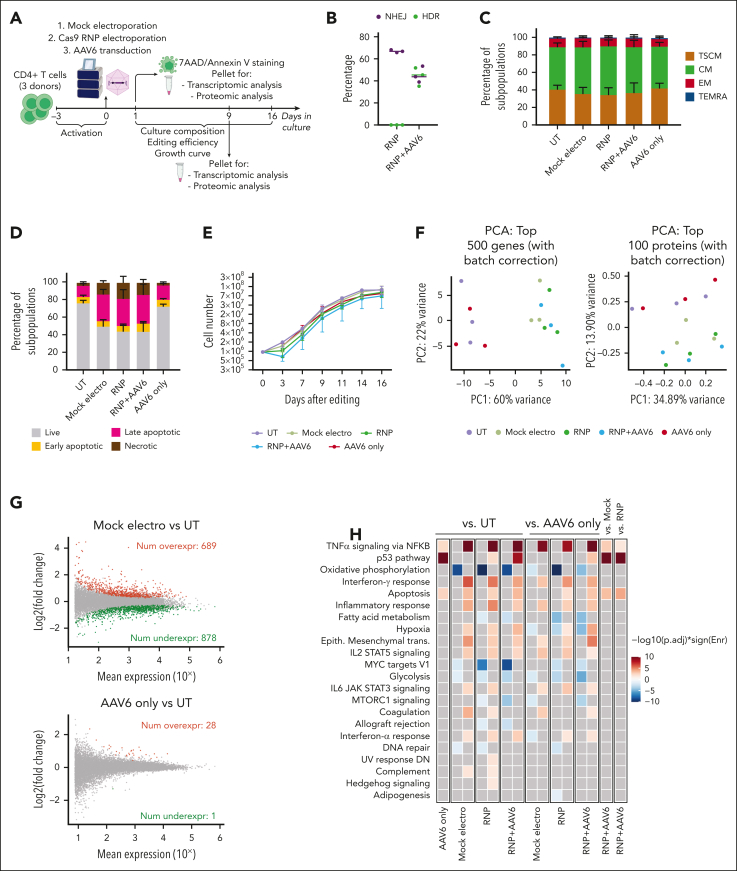
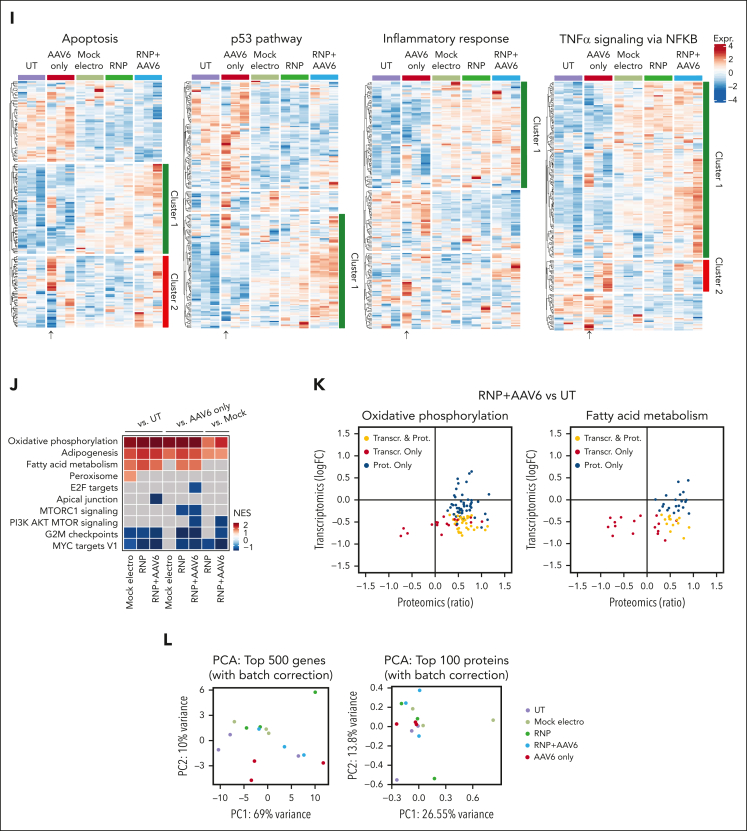
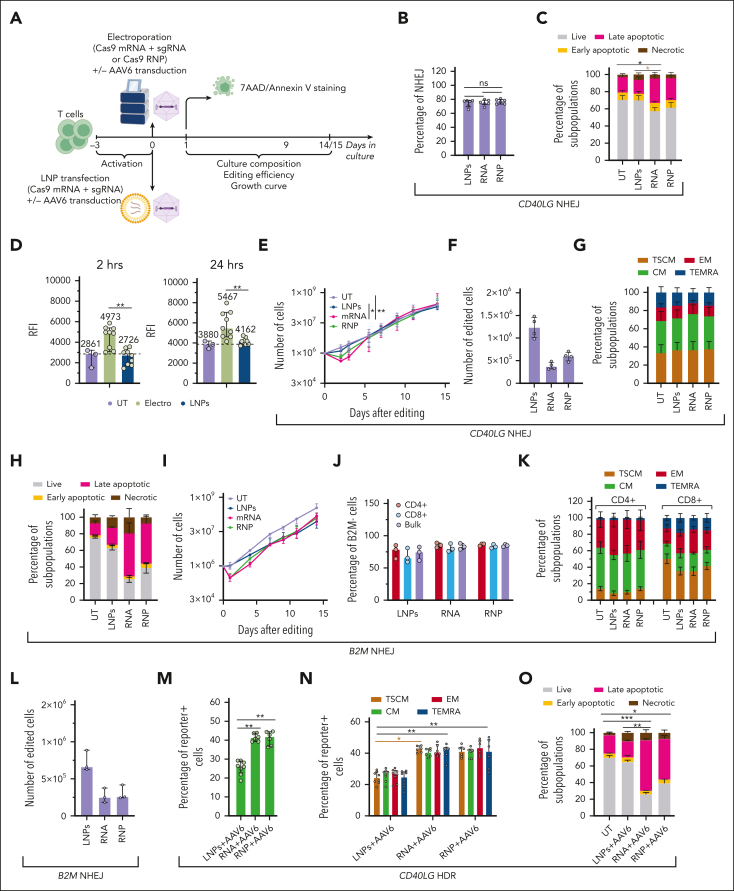
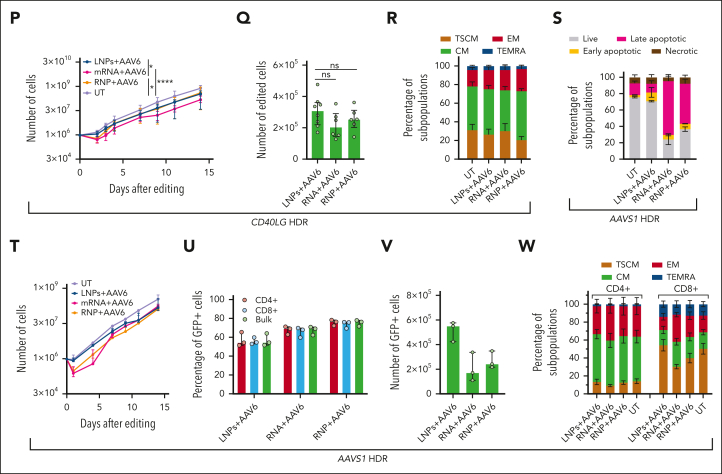
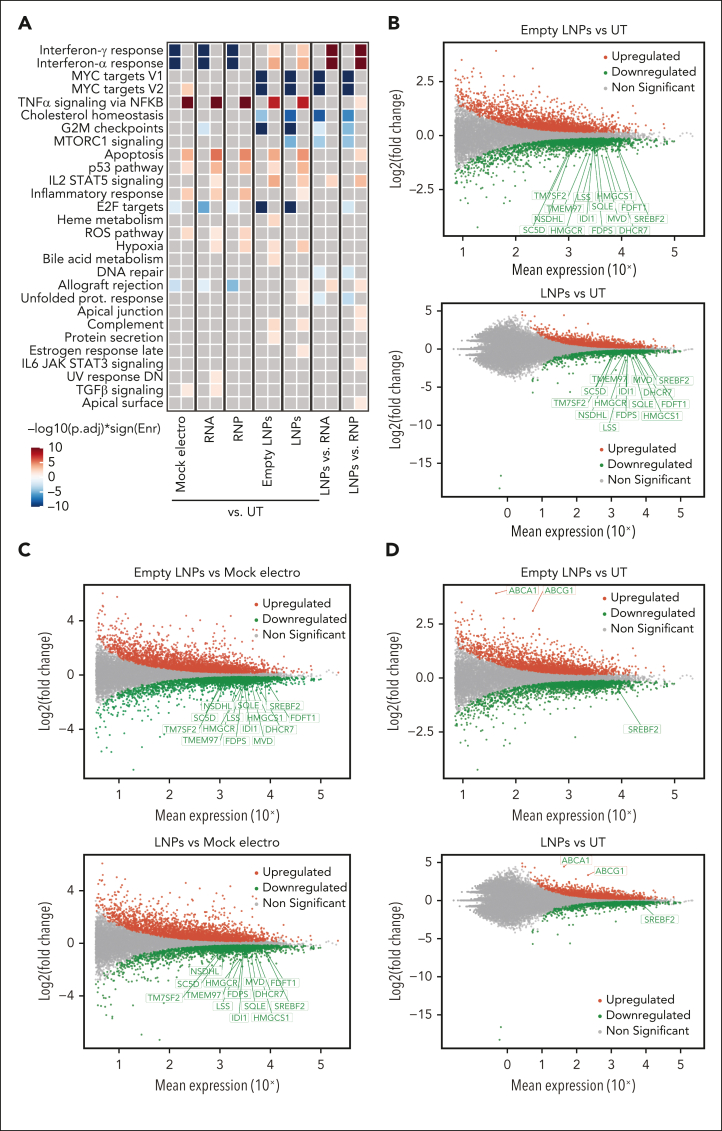
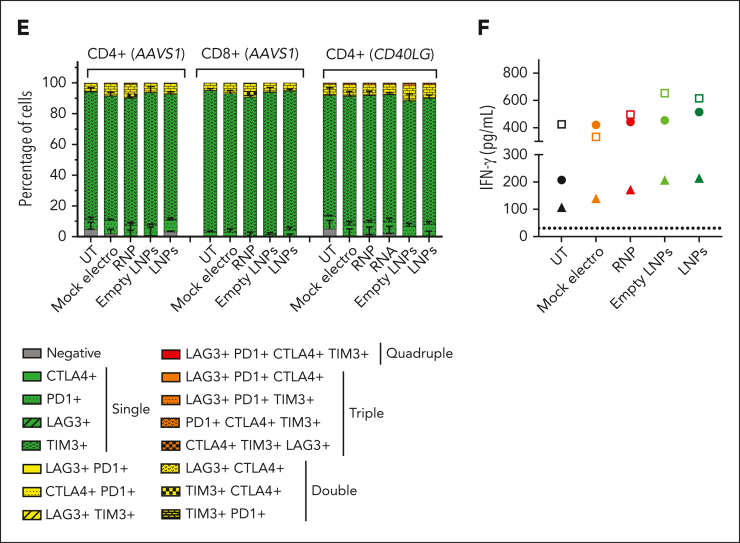
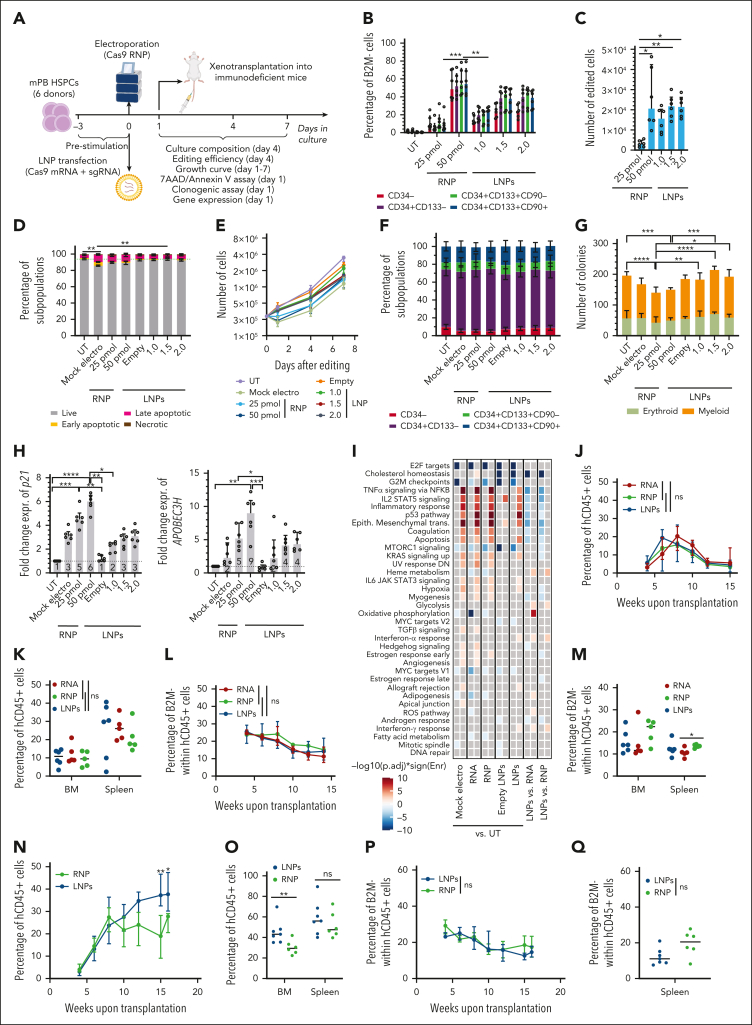
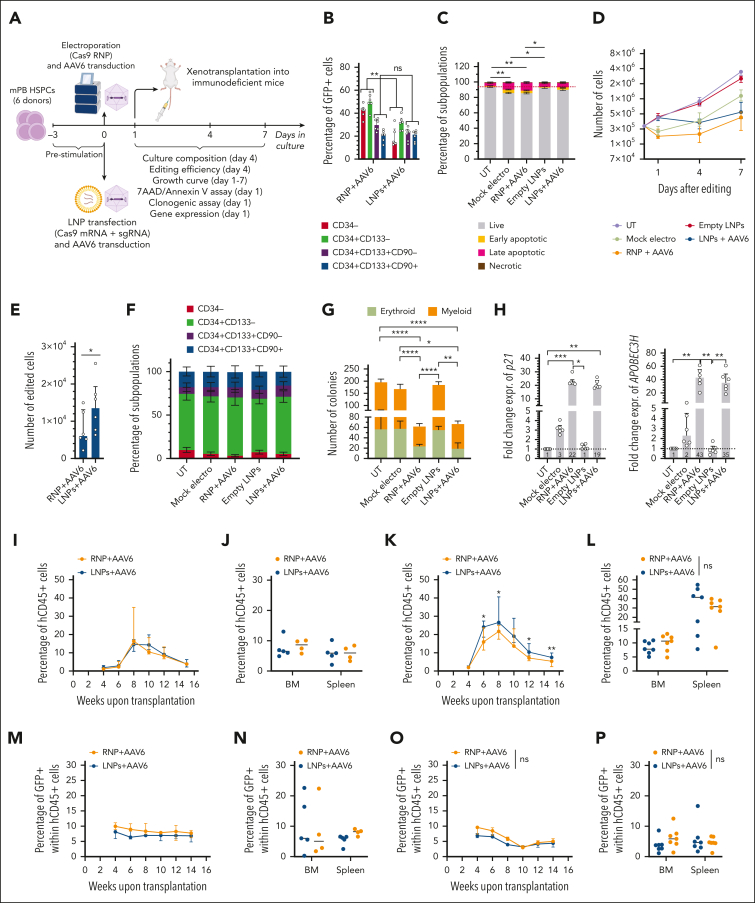
Ex vivo gene editing in T cells and hematopoietic stem/progenitor cells (HSPCs) holds promise for treating diseases. Gene editing encompasses the delivery of a programmable editor RNA or ribonucleoprotein, often achieved ex vivo via electroporation, and when aiming for homology-driven correction of a DNA template, often provided by viral vectors together with a nuclease editor. Although HSPCs activate a robust p53-dependent DNA damage response upon nuclease-based editing, the responses triggered in T cells remain poorly characterized. Here, we performed comprehensive multiomics analyses and found that electroporation is the main culprit of cytotoxicity in T cells, causing death and cell cycle delay, perturbing metabolism, and inducing an inflammatory response. Nuclease RNA delivery using lipid nanoparticles (LNPs) nearly abolished cell death and ameliorated cell growth, improving tolerance to the procedure and yielding a higher number of edited cells compared with using electroporation. Transient transcriptomic changes upon LNP treatment were mostly caused by cellular loading with exogenous cholesterol, whose potentially detrimental impact could be overcome by limiting exposure. Notably, LNP-based HSPC editing dampened p53 pathway induction and supported higher clonogenic activity and similar or higher reconstitution by long-term repopulating HSPCs compared with electroporation, reaching comparable editing efficiencies. Overall, LNPs may allow efficient and harmless ex vivo gene editing in hematopoietic cells for the treatment of human diseases.


Conflict of interest statement

Conflict-of-interest disclosure: L.N., V.V., and S.F. are listed as inventors on patent applications of gene editing owned and managed by the San Raffaele Scientific Institute and the Telethon Foundation. L.N. is the founder and quota holder of GeneSpire, a startup company aiming to develop gene editing applications in hematopoietic cells. The remaining authors declare no competing financial interests.

Figures

None
Graphical abstract
Figure 1.
Figure 1.
Electroporation induces transient transcriptomic and proteomic changes that promote cell cycle arrest and trigger apoptosis in human CD4+ T cells. (A) Schematic representations of gene editing experimental procedure and multiparametric analysis performed in CD4+ T cells. (B) Percentage of HDR- and NHEJ-edited alleles after CD40LG editing with CRISPR/Cas9 with RNP only or RNP + AAV6 in CD4+ T cells from males (n = 3). Median. (C) Cell population composition of CD4+ T cells in the indicated conditions (n = 3), 16 days after treatment. Data are represented as mean ± standard error of the mean (SEM). CD4+ T-cell phenotypes were defined as follows: effector memory RA (TEMRA): CD45RA+CD62L; effector memory (EM): CD45RACD62L-; central memory (CM): CD45RACD62L+; and T memory stem (TSCM): CD45RA+CD62L+. (D) Percentage of live, early/late apoptotic, and necrotic cells 24 hours after editing from panel C (n = 3). Data are represented as mean ± SEM. (E) Growth curve of CD4+ T cells from panel C (n = 3). Data are represented as median ± range. (F) Unsupervised principal component analyses (PCAs) of transcriptomic (left) and proteomic (right) data 12 hours after treatment of CD4+ T cells from panel C. (G) Plot of log intensity ratios vs the mean average signals (MA plot) showing significant DEGs in the mock electro vs UT (top) or AAV6 only vs UT (bottom) comparisons. (H) Heatmap showing enrichment results from all comparisons between conditions from panel C on the hallmark gene set (Molecular Signatures Database). Color intensity reflects statistical significance of the test (adjusted P values), whereas signs (positive or negative) correspond to the set of DEGs used in the statistical test (upregulated or downregulated, respectively). No significant enrichment was found when comparisons are missing. (I) Heatmaps showing normalized read counts for all genes belonging to the indicated categories in conditions from panel C. (J) Heatmap showing NES of proteomic gene set enrichment analysis on differentially expressed proteins (DEPs) pre-ranked based on the ratio of all comparisons between conditions from panel C vs the hallmark gene sets. Missing comparisons indicate that no significant differences were captured in the analysis. (K) Plots showing changes of expression for genes or proteins belonging to the core enrichment of oxidative phosphorylation (left) or fatty acid metabolism (right) categories from the RNP + AAV6 vs UT comparison. (L) Unsupervised PCA of transcriptomic (left) and proteomic (right) data 9 days after treatment of CD4+ T cells from panel C. AAV6 only, AAV6 transduced-only cells, without electroporation.
Figure 1.
Figure 1.
Electroporation induces transient transcriptomic and proteomic changes that promote cell cycle arrest and trigger apoptosis in human CD4+ T cells. (A) Schematic representations of gene editing experimental procedure and multiparametric analysis performed in CD4+ T cells. (B) Percentage of HDR- and NHEJ-edited alleles after CD40LG editing with CRISPR/Cas9 with RNP only or RNP + AAV6 in CD4+ T cells from males (n = 3). Median. (C) Cell population composition of CD4+ T cells in the indicated conditions (n = 3), 16 days after treatment. Data are represented as mean ± standard error of the mean (SEM). CD4+ T-cell phenotypes were defined as follows: effector memory RA (TEMRA): CD45RA+CD62L; effector memory (EM): CD45RACD62L-; central memory (CM): CD45RACD62L+; and T memory stem (TSCM): CD45RA+CD62L+. (D) Percentage of live, early/late apoptotic, and necrotic cells 24 hours after editing from panel C (n = 3). Data are represented as mean ± SEM. (E) Growth curve of CD4+ T cells from panel C (n = 3). Data are represented as median ± range. (F) Unsupervised principal component analyses (PCAs) of transcriptomic (left) and proteomic (right) data 12 hours after treatment of CD4+ T cells from panel C. (G) Plot of log intensity ratios vs the mean average signals (MA plot) showing significant DEGs in the mock electro vs UT (top) or AAV6 only vs UT (bottom) comparisons. (H) Heatmap showing enrichment results from all comparisons between conditions from panel C on the hallmark gene set (Molecular Signatures Database). Color intensity reflects statistical significance of the test (adjusted P values), whereas signs (positive or negative) correspond to the set of DEGs used in the statistical test (upregulated or downregulated, respectively). No significant enrichment was found when comparisons are missing. (I) Heatmaps showing normalized read counts for all genes belonging to the indicated categories in conditions from panel C. (J) Heatmap showing NES of proteomic gene set enrichment analysis on differentially expressed proteins (DEPs) pre-ranked based on the ratio of all comparisons between conditions from panel C vs the hallmark gene sets. Missing comparisons indicate that no significant differences were captured in the analysis. (K) Plots showing changes of expression for genes or proteins belonging to the core enrichment of oxidative phosphorylation (left) or fatty acid metabolism (right) categories from the RNP + AAV6 vs UT comparison. (L) Unsupervised PCA of transcriptomic (left) and proteomic (right) data 9 days after treatment of CD4+ T cells from panel C. AAV6 only, AAV6 transduced-only cells, without electroporation.
Figure 2.
Figure 2.
CRISPR/Cas9 RNA delivery using LNP improves T-cell tolerance to gene editing. (A) Schematic representations of gene editing experimental procedure and related analyses after CRISPR/Cas9 RNA delivery using LNPs or CRISPR/Cas9 RNP/RNA delivery via electroporation in T cells. (B) Percentage of NHEJ-edited CD40LG alleles after editing CD4+ T cells from males using 1.25 μg of LNPs, 25 pmol of RNP, or 1.25 μg of RNA (n = 6). Friedman test with Dunn multiple comparisons. Median ± interquartile range (IQR). (C) Percentage of live, early/late apoptotic, and necrotic cells 24 hours after treatments in B and in UT cells (n = 6). Friedman test with Dunn multiple comparisons performed at live cells. Mean ± SEM. (D) Relative fluorescence intensity (RFI) of Mitotracker Red (mitochondrial membrane potential) normalized on Mitotracker Green (mitochondrial mass) measured via flow cytometry 2 hours (left) or 24 hours (right) after indicated treatments from supplemental Figure 4L (n=3, 9, and 9). LNPs and electroporated conditions were pooled for this analysis; Wilcoxon test; median ± IQR. (E) Growth curve from panel C (n = 6). Friedman test with Dunn multiple comparisons performed on day 3; median ± IQR. (F) Number of edited cells 24 hours after editing in 4 experiments from panel C (n = 4); median ± IQR. (G) Cell population composition from panel C (n = 6), 14 days after treatment. Mean ± SEM. (H) Percentage of live, early/late apoptotic, and necrotic CD3+ T cells 24 hours after B2M editing using 1.5 μg of LNPs, 50 pmol of RNP, or 1.5 μg of RNA (n = 3). UTs were used as the control; mean ± SEM. (I) Growth curve of CD3+ T cells from panel H (n = 3); median ± range. (J) Percentage of B2M cells (biallelic KO) measured via flow cytometry within CD4+, CD8+, and total CD3+ T-cell populations from panel H (n = 3); median ± range. (K) Cell population composition from panel H (n = 3), 14 days after treatment; mean ± SEM. (L) Number of B2M cells from panel H 24 hours after editing (n = 3); median ± range. (M) Percentage of reporter-positive CD4+ T cells from male donors after CD40LG editing using 1.25 μg of LNPs, 25 pmol of RNP, or 1.25 μg of RNA, and the cognate HDR template provided by AAV6 (n = 8, 6, and 6). Kruskal-Wallis test followed by post hoc analysis with Dunn test; median ± IQR. (N) Percentage of reporter-positive cells within CD4+ T cells subpopulations from panel M (n=8, 6, and 6). Kruskal-Wallis test followed by post hoc analysis with Dunn test; median ± IQR. (O) Percentage of live, early/late apoptotic, and necrotic CD4+ T cells 24 hours after editing in experiments from panel M. UTs were used as controls (n = 8, 8, 6, and 6). Kruskal-Wallis test followed by post hoc analysis with Dunn test on live cells; mean ± SEM. (P) Growth curve of CD4+ T cells from panel O. Kruskal-Wallis test followed by post hoc analysis with Dunn test performed on day 3; median ± IQR. (Q) Number of reporter-positive cells from panel O, 24 hours after editing. Kruskal-Wallis test followed by post hoc analysis with Dunn test; median ± IQR. (R) Cell population composition from panel O (n = 3), 14 days after treatment; mean ± SEM. (S) Percentage of live, early/late apoptotic, and necrotic CD3+ T cells 24 hours after AAVS1 editing using 1.25 μg of LNPs, 25 pmol of RNP, or 1.25 μg RNA, and the cognate HDR template provided by AAV6 (n = 3). UTs were used as controls. Mean ± SEM. (T) Growth curve of CD3+ T cells from panel S (n = 3); median ± range. (U) Percentage of GFP+ CD3+ T cells within CD4+, CD8+, and total populations from panel S (n = 3). Median ± range. (V) Number of GFP+ cells from panel R 24 hours after editing. Median ± IQR. (W) Cell population composition from panel S (n = 3), 14 days after treatment. Mean ± SEM. ns, not significant.
Figure 2.
Figure 2.
CRISPR/Cas9 RNA delivery using LNP improves T-cell tolerance to gene editing. (A) Schematic representations of gene editing experimental procedure and related analyses after CRISPR/Cas9 RNA delivery using LNPs or CRISPR/Cas9 RNP/RNA delivery via electroporation in T cells. (B) Percentage of NHEJ-edited CD40LG alleles after editing CD4+ T cells from males using 1.25 μg of LNPs, 25 pmol of RNP, or 1.25 μg of RNA (n = 6). Friedman test with Dunn multiple comparisons. Median ± interquartile range (IQR). (C) Percentage of live, early/late apoptotic, and necrotic cells 24 hours after treatments in B and in UT cells (n = 6). Friedman test with Dunn multiple comparisons performed at live cells. Mean ± SEM. (D) Relative fluorescence intensity (RFI) of Mitotracker Red (mitochondrial membrane potential) normalized on Mitotracker Green (mitochondrial mass) measured via flow cytometry 2 hours (left) or 24 hours (right) after indicated treatments from supplemental Figure 4L (n=3, 9, and 9). LNPs and electroporated conditions were pooled for this analysis; Wilcoxon test; median ± IQR. (E) Growth curve from panel C (n = 6). Friedman test with Dunn multiple comparisons performed on day 3; median ± IQR. (F) Number of edited cells 24 hours after editing in 4 experiments from panel C (n = 4); median ± IQR. (G) Cell population composition from panel C (n = 6), 14 days after treatment. Mean ± SEM. (H) Percentage of live, early/late apoptotic, and necrotic CD3+ T cells 24 hours after B2M editing using 1.5 μg of LNPs, 50 pmol of RNP, or 1.5 μg of RNA (n = 3). UTs were used as the control; mean ± SEM. (I) Growth curve of CD3+ T cells from panel H (n = 3); median ± range. (J) Percentage of B2M cells (biallelic KO) measured via flow cytometry within CD4+, CD8+, and total CD3+ T-cell populations from panel H (n = 3); median ± range. (K) Cell population composition from panel H (n = 3), 14 days after treatment; mean ± SEM. (L) Number of B2M cells from panel H 24 hours after editing (n = 3); median ± range. (M) Percentage of reporter-positive CD4+ T cells from male donors after CD40LG editing using 1.25 μg of LNPs, 25 pmol of RNP, or 1.25 μg of RNA, and the cognate HDR template provided by AAV6 (n = 8, 6, and 6). Kruskal-Wallis test followed by post hoc analysis with Dunn test; median ± IQR. (N) Percentage of reporter-positive cells within CD4+ T cells subpopulations from panel M (n=8, 6, and 6). Kruskal-Wallis test followed by post hoc analysis with Dunn test; median ± IQR. (O) Percentage of live, early/late apoptotic, and necrotic CD4+ T cells 24 hours after editing in experiments from panel M. UTs were used as controls (n = 8, 8, 6, and 6). Kruskal-Wallis test followed by post hoc analysis with Dunn test on live cells; mean ± SEM. (P) Growth curve of CD4+ T cells from panel O. Kruskal-Wallis test followed by post hoc analysis with Dunn test performed on day 3; median ± IQR. (Q) Number of reporter-positive cells from panel O, 24 hours after editing. Kruskal-Wallis test followed by post hoc analysis with Dunn test; median ± IQR. (R) Cell population composition from panel O (n = 3), 14 days after treatment; mean ± SEM. (S) Percentage of live, early/late apoptotic, and necrotic CD3+ T cells 24 hours after AAVS1 editing using 1.25 μg of LNPs, 25 pmol of RNP, or 1.25 μg RNA, and the cognate HDR template provided by AAV6 (n = 3). UTs were used as controls. Mean ± SEM. (T) Growth curve of CD3+ T cells from panel S (n = 3); median ± range. (U) Percentage of GFP+ CD3+ T cells within CD4+, CD8+, and total populations from panel S (n = 3). Median ± range. (V) Number of GFP+ cells from panel R 24 hours after editing. Median ± IQR. (W) Cell population composition from panel S (n = 3), 14 days after treatment. Mean ± SEM. ns, not significant.
Figure 3.
Figure 3.
LNPs induce pervasive transcriptomic changes without affecting T-cell functionality. (A) Heatmap showing enrichment results from all comparisons between conditions between conditions from supplemental Figure 5A on the hallmark gene set (Molecular Signatures Database). Color intensity reflects statistical significance of the test (adjusted P values), whereas signs (positive or negative) correspond to the set of DEGs used in the statistical test (upregulated or downregulated, respectively). (B-D) MA plot showing significant DEGs in (B) empty LNPs vs UTs (top) or LNPs vs UTs (bottom); (C) empty LNPs vs mock electros (top) or LNPs vs mock electros (bottom); (D) empty LNPs vs UTs (top) or LNPs vs UTs (bottom) comparisons. Labels highlight DEGs from panels B-C belonging to the core enrichment of cholesterol homeostasis category, and (D) SREBF2, ABCA1, and ABCG1. (E) Percentage of T cells negative and single-, double-, triple-, and quadruple-positive for exhaustion markers 14 days after treatments (n = 3). Mean ± SEM. (F) IFN-γ secretion 3 days after anti-CD3 polyclonal stimulation, ie, 14 days after treatments (n = 3). Each symbol represents a different T-cell donor.
Figure 3.
Figure 3.
LNPs induce pervasive transcriptomic changes without affecting T-cell functionality. (A) Heatmap showing enrichment results from all comparisons between conditions between conditions from supplemental Figure 5A on the hallmark gene set (Molecular Signatures Database). Color intensity reflects statistical significance of the test (adjusted P values), whereas signs (positive or negative) correspond to the set of DEGs used in the statistical test (upregulated or downregulated, respectively). (B-D) MA plot showing significant DEGs in (B) empty LNPs vs UTs (top) or LNPs vs UTs (bottom); (C) empty LNPs vs mock electros (top) or LNPs vs mock electros (bottom); (D) empty LNPs vs UTs (top) or LNPs vs UTs (bottom) comparisons. Labels highlight DEGs from panels B-C belonging to the core enrichment of cholesterol homeostasis category, and (D) SREBF2, ABCA1, and ABCG1. (E) Percentage of T cells negative and single-, double-, triple-, and quadruple-positive for exhaustion markers 14 days after treatments (n = 3). Mean ± SEM. (F) IFN-γ secretion 3 days after anti-CD3 polyclonal stimulation, ie, 14 days after treatments (n = 3). Each symbol represents a different T-cell donor.
Figure 4.
Figure 4.
CRISPR/Cas9 RNA delivery using LNP improves HSPC tolerance to gene editing. (A) Schematic representations of gene editing experimental procedure and related analyses after CRISPR/Cas9 RNA delivery using LNPs or CRISPR/Cas9 RNP/RNA delivery via electroporation in mPB HSPCs. (B) Percentage of B2M HSPCs within subpopulations (n = 6). Cells were electroporated with 25 or 50 pmol of RNP or transfected with 1, 1.5, or 2 μg of LNPs. mPB HSPC phenotype (from committed to primitive progenitors) is defined as follows: CD34; CD34+CD133; CD34+CD133+; and CD34+CD133+CD90+. Friedman test with Dunn multiple comparisons performed on the latter subpopulation; median ± IQR. (C) Number of edited cells from panel B, 24 hours after editing (n = 6); Friedman test with Dunn multiple comparisons; median ± IQR. (D) Percentage of live, early/late apoptotic, and necrotic CD34+CD133+CD90+ HSPCs, 24 hours after B2M editing in experiments from panel B (n = 6). Mock electros and empty LNPs were added as controls (n = 6). Friedman test with Dunn multiple comparisons performed on live cells; mean ± SEM. (E) Growth curve of HSPCs from panel D (n = 6); median ± IQR. (F) Cell population composition from panel D, 4 days after treatment; mean ± SEM. (G) Number of colonies generated using mPB HPSCs from panel D (n = 6). Friedman test with Dunn multiple comparisons; median ± IQR. (H) Fold change expression of p21 (left) and APOBEC3H (right) relative to UT 24 hours after treatment from experiments in panel D (n = 6). Friedman test with Dunn multiple comparisons; median ± IQR. (I) Heatmap showing enrichment results from different comparisons between conditions from supplemental Figure 6P against the hallmark gene set (Molecular Signatures Database). Color intensity reflects statistical significance of the test (adjusted P values), whereas signs (positive or negative) correspond to the set of DEGs used in the statistical test (upregulated or downregulated, respectively). (J) Percentage of circulating human (h)CD45+ cells over time in mice that underwent transplant with mPB HSPCs edited with 50 pmol of RNP, 1.5 μg of mRNA, or 1.5 μg of LNPs (n = 5,5,6). Kruskal-Wallis test; median ± IQR. (K) Percentage of hCD45+ cells in the bone marrow (BM) and spleen of mice from panel J. Kruskal-Wallis test; median. (L) Percentage of B2M cells over time, within the human graft in the PB of mice from panel J. Kruskal-Wallis test performed at the last time point; median ± IQR. (M) Percentage of B2M cells within human graft in BM and spleen of mice from panel J. Kruskal-Wallis test; median. (N) Percentage of circulating human (h)CD45+ cells over time in mice that underwent transplantation with CB HSPCs edited with 50 pmol of RNP or 1.5 μg of LNPs (n = 6 and 7); Mann-Whitney test; median ± IQR. (O) Percentage of hCD45+ cells in BM and spleen of mice from panel N; Mann-Whitney test; median. (P) Percentage of B2M cells over time, within the human graft in the PB of mice from panel N. Mann-Whitney test performed at the last time point; median ± IQR. (Q) Percentage of B2M cells within human graft in spleen of mice from panel N; Mann-Whitney test; median.
Figure 5.
Figure 5.
CRISPR/Cas9 RNA delivery using LNPs allows HDR-mediated editing in human HSPCs. (A) Schematic representations of gene editing experimental procedure, and related analyses, after CRISPR/Cas9 RNA delivery using LNPs or CRISPR/Cas9 RNP/RNA delivery via electroporation, in combination with the cognate AAV6, in mPB HSPCs. (B) Percentage of GFP+ cells within mPB HSPC subpopulations 96 hours after AAVS1 editing. Cells were edited with 25 pmol of RNP or 1 μg of LNPs and transduced with AAV6 immediately after electroporation or 2 hours before transfection, respectively. Wilcoxon test on individual subpopulations. Median ± IQR. (C) Percentage of live, early/late apoptotic, and necrotic CD34+CD133+CD90+ mPB HSPCs 24 hours after AAVS1 editing in experiments from panel B (n = 6). UTs, mock electros, and empty LNPs were added as controls (n = 6). Friedman test with Dunn multiple comparisons performed on live cells. Mean ± SEM. (D) Growth curve from panel C (n = 6). Median ± IQR. (E) Number of edited cells from panel C 24 hours after editing (n = 6). Wilcoxon test. Median ± IQR. (F) Cell population composition from panel C (n = 6), 4 days after treatment. Mean ± SEM. (G) Number of colonies generated by mPB HPSCs from panel C (n = 6). Median ± IQR. Friedman test with Dunn multiple comparisons. (H) Fold change expression of p21 and APOBEC3H relative to UTs 24 hours after treatment from experiments in panel C. Friedman test with Dunn multiple comparisons. Median ± IQR. (I) Percentage of circulating hCD45+ cells over time in mice that underwent transplantation with mPB HSPCs (from a pool of donors), edited with 25 pmol RNP or 1 μg of LNPs, in combination with AAV6 (n = 4 and 5). Median ± range. (J) Percentage of hCD45+ cells in the BM and spleen of mice from panel I. Median. (K) Percentage of circulating hCD45+ cells over time in mice that underwent transplantation with mPB HSPCs edited as in panel I but using a different pool of donors (n = 7). Mann-Whitney test. Median ± range. (L) Percentage of hCD45+ cells in BM and spleen of mice from panel K. Mann-Whitney test. Median. (M-P) Percentage of GFP+ cells over time within human graft in PB (M,O) or hematopoietic organs (N,P) of mice from panel I (M-N) and panel K (O-P). Mann-Whitney test. Median or median ± range.

Comment in

References

    1. Naldini L. Genetic engineering of hematopoiesis: current stage of clinical translation and future perspectives. EMBO Mol Med. 2019;11(3):e9958. - PMC - PubMed
    1. Ferrari S, Vavassori V, Canarutto D, et al. Gene editing of hematopoietic stem cells: hopes and hurdles toward clinical translation. Front Genome Ed. 2021;3:618378. - PMC - PubMed
    1. Provasi E, Genovese P, Lombardo A, et al. Editing T cell specificity towards leukemia by zinc finger nucleases and lentiviral gene transfer. Nat Med. 2012;18(5):807–815. - PMC - PubMed
    1. June CH, Sadelain M. Chimeric antigen receptor therapy. N Engl J Med. 2018;379(1):64–73. - PMC - PubMed
    1. Lin H, Cheng J, Mu W, Zhou J, Zhu L. Advances in universal CAR-T cell therapy. Front Immunol. 2021;12:744823. - PMC - PubMed

Publication types

MeSH terms