. 2023 Aug 10;142(6):589-606.
doi: 10.1182/blood.2022019145.

Infectious neutrophil deployment is regulated by resolvin D4

Affiliations

Infectious neutrophil deployment is regulated by resolvin D4

Stephania Libreros et al. Blood. .

Abstract

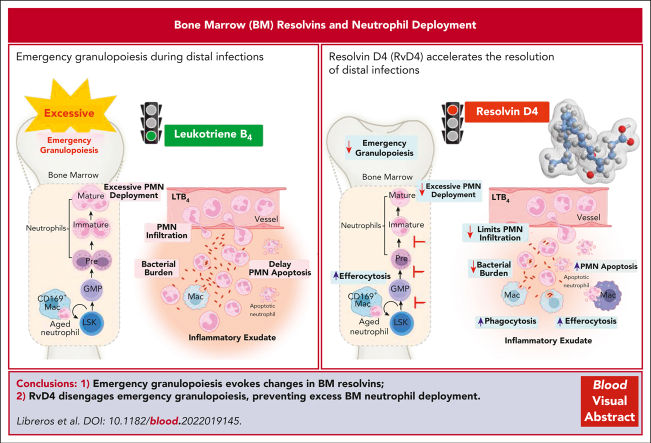
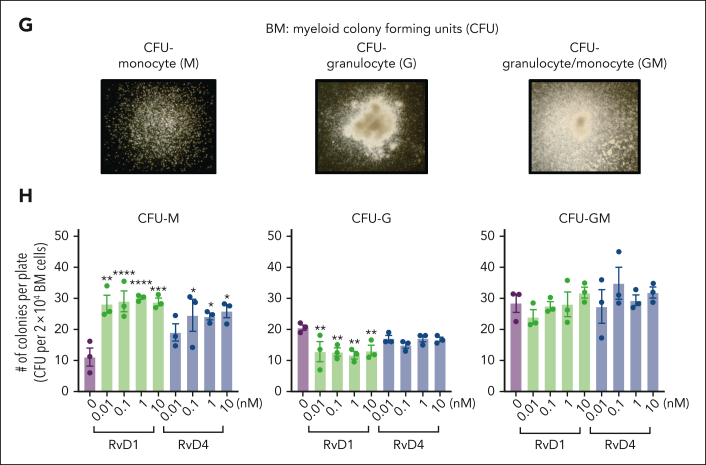
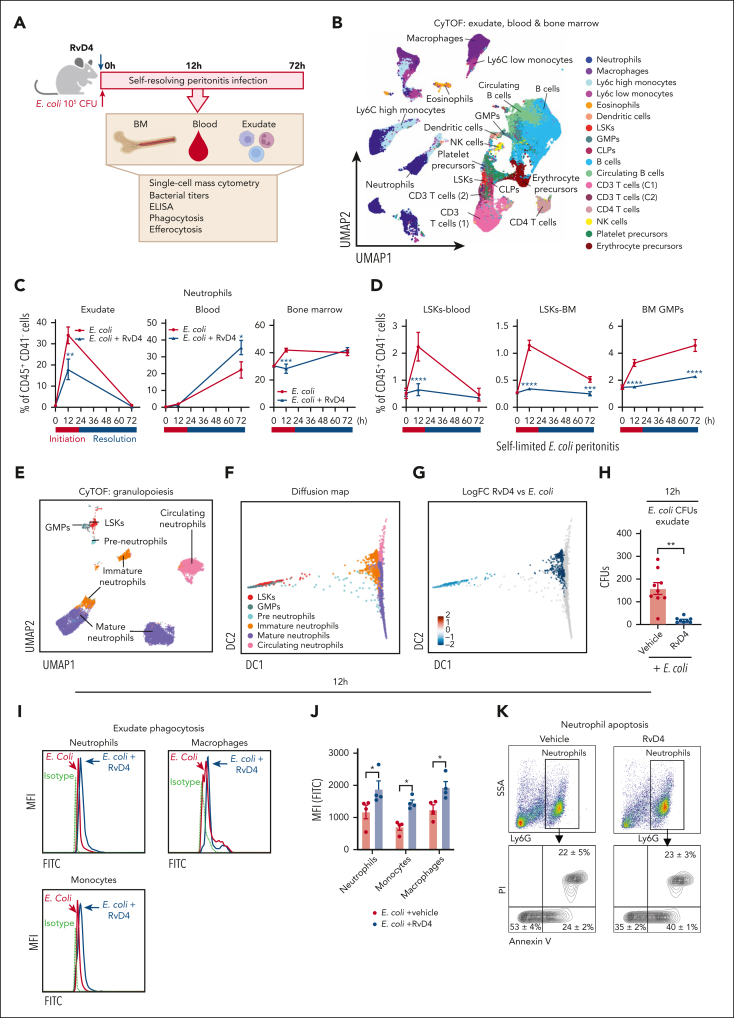
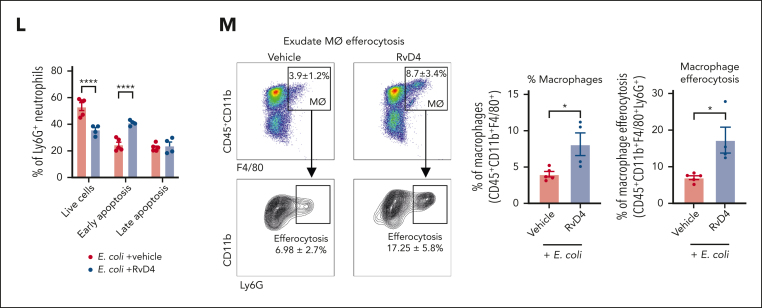
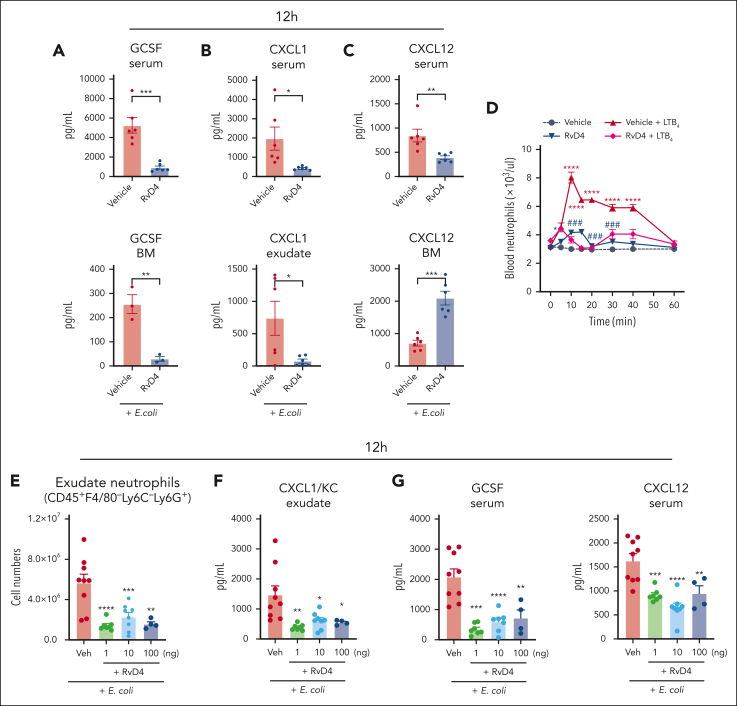
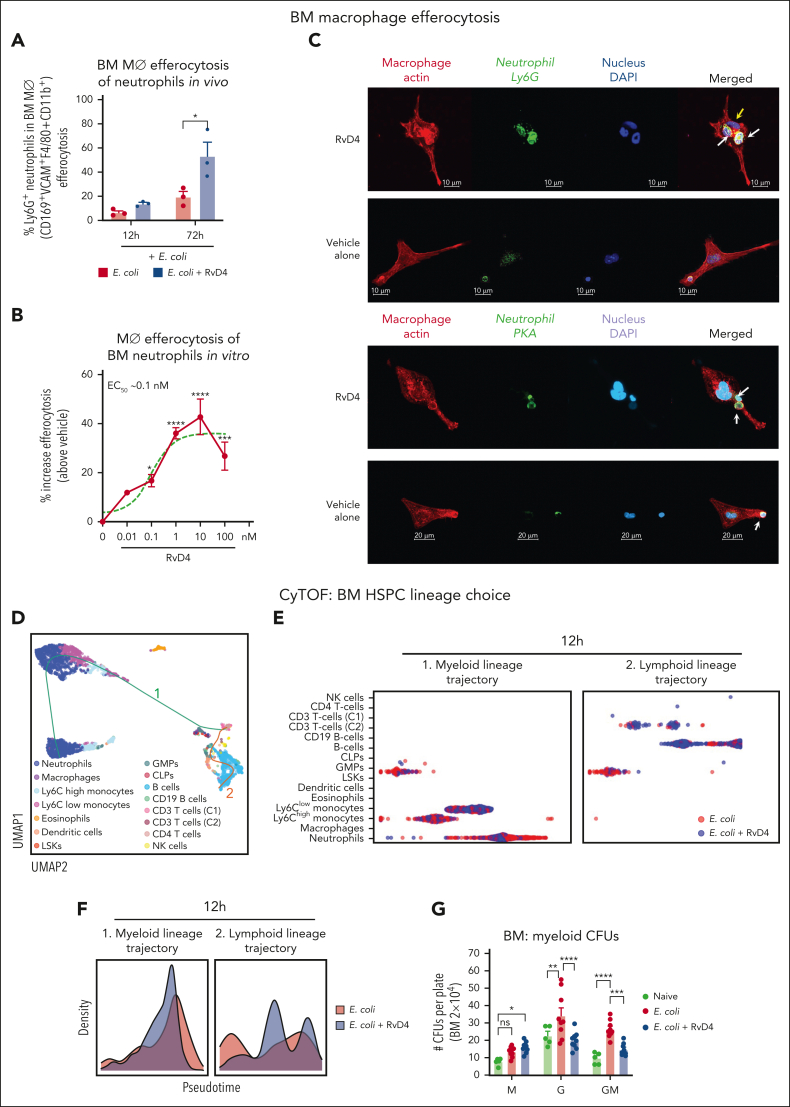
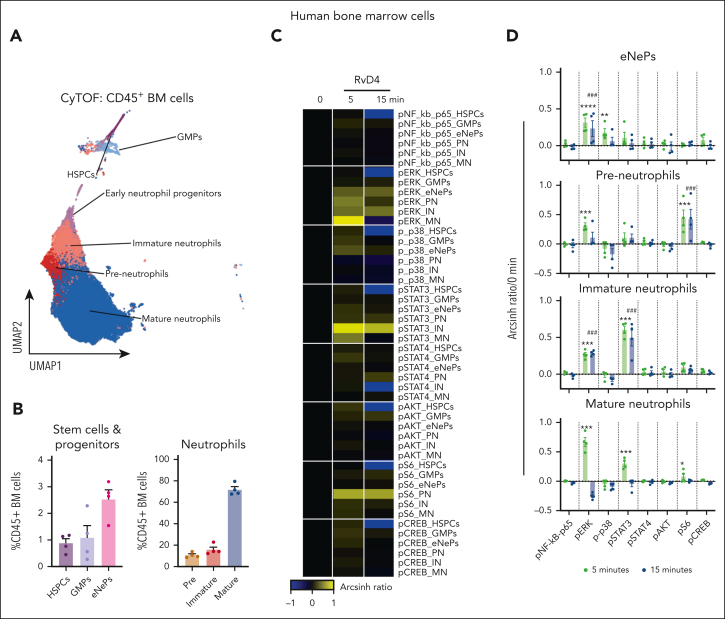
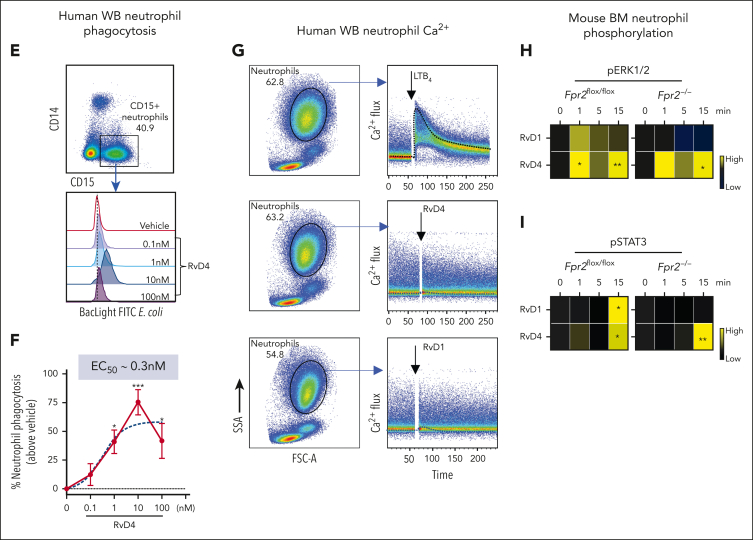
Neutrophils reside in the bone marrow (BM), ready for deployment to sites of injury/infection, initiating inflammation and its resolution. Here, we report that distal infections signal to the BM via resolvins to regulate granulopoiesis and BM neutrophil deployment. Emergency granulopoiesis during peritonitis evoked changes in BM resolvin D1 (RvD1) and BM RvD4. We found that leukotriene B4 stimulates neutrophil deployment. RvD1 and RvD4 each limited neutrophilic infiltration to infections, and differently regulated BM myeloid populations: RvD1 increased reparative monocytes, and RvD4 regulated granulocytes. RvD4 disengaged emergency granulopoiesis, prevented excess BM neutrophil deployment, and acted on granulocyte progenitors. RvD4 also stimulated exudate neutrophil, monocyte, and macrophage phagocytosis, and enhanced bacterial clearance. This mediator accelerated both neutrophil apoptosis and clearance by macrophages, thus expediting the resolution phase of inflammation. RvD4 stimulated phosphorylation of ERK1/2 and STAT3 in human BM-aspirate-derived granulocytes. RvD4 in the 1 to 100 nM range stimulated whole-blood neutrophil phagocytosis of Escherichia coli. RvD4 increased BM macrophage efferocytosis of neutrophils. Together, these results demonstrate the novel functions of resolvins in granulopoiesis and neutrophil deployment, contributing to the resolution of infectious inflammation.


Conflict of interest statement

Conflict-of-interest disclosure: The authors declare no competing financial interests.

Figures

None
Graphical abstract
Figure 1.
Figure 1.
Temporal changes in neutrophils during infection. Mice were inoculated intraperitoneally (IP) with E coli (105 CFU, self-limited dose; see “Methods”). Exudates and BM cells were collected at 0, 12, 24, 48, and 72 hours after inoculation. Numbers of exudate (A); whole blood (B); BM neutrophils (C); and BM granulocyte progenitors, LSKs and GMPs (D), were determined by flow cytometry. (E) Screen captures of RvD1 from targeted LC-MS/MS analysis. (Top) BM RvD1–targeted scheduled multiple reaction monitoring (MRM) in negative-ion mode for mass-to-charge (m/z) 375 → 215 (“→” indicates fragmentation/transition). (Bottom) Synthetic RvD1. MRM signal-to-noise ratio of >80. (F) Screen captures of RvD4 from targeted LC-MS/MS analysis. (Top) BM RvD4–targeted scheduled MRM in negative-ion mode for m/z 375 → 101. (Bottom) Synthetic RvD4. MRM signal-to-noise ratio of >40. (G) Screen capture of BM RvD4 MS/MS fragmentation. Inset: RvD4 structure and proposed fragmentation. BM RvD4 MS/MS fragmentation spectrum matched to an unbiased library of synthetic RvD4 standard with a fit score of 94.5%. BM-RvD4 MS/MS spectral ions gave a parent ion mass of m/z 375 (M-H) and daughter ions of m/z 357 (M-H–H2O), 339 (M-H–2H2O), 313 (M-H–H2O-CO2), 295 (M-H–2H2O-CO2), 255 (273–H2O), 233 (277–CO2), and 101 (M-H–CHOH-[CH]6-CH2-[CH]4-CHOH-CH2-[CH]2-CH2-CH3). (E-F) Screen captures taken from Sciex OS version 1.7.036606 (Explorer Mode). Note the additional digits in the screen captures in panel G are the default setting (the number [amu] in the second decimal place does not accurately reflect the mass of the ions).
Figure 2.
Figure 2.
Time-dependent changes in BM Rvs. (A) Time course of D-series Rvs and proresolving mediators in the BM from targeted LC-MS/MS. (B) Principal component analysis of time course of BM Rvs and proresolving mediators; (left) 3D scoring plot, and (right) 3D loading plot. Results are expressed as mean ± standard error of the mean (SEM); n = 4 or 6 mice per time point, panels A-B. Panel A: time 0 vs 12, 24, 48, and 72 hours, respectively; ∗P < .05, ∗∗P < .01, ∗∗∗P < .001, ∗∗∗∗P < .0001. Panel A: time 0 vs 12, 24, 48, and 72 hours, respectively, ∗P < .05, ∗∗∗∗P < .0001; 12 hours vs 48 and 72 hours, respectively, #P < .05, ####P < .0001; 48 vs 72 hours, ‡P < .05. (C) Time course of RvD4 in whole blood as determined with targeted LC-MS/MS. RvD4 blood pooled from 3 mice for each time point. Time 0 vs 12, 24, 48, and 72 hours, respectively; ∗∗∗∗P < .0001. Statistical analysis was carried out using 1-way ANOVA with Bonferroni multiple comparison test. (D-F) CyTOF: BM (CD45+CD41) isolated from mice with peritonitis at 0, 12, and 72 hours. (D) Composite BM map: force-directed layout (Vortex) showing (94 500 total single cells) clustered by X-shift (n = 3 mice per time point: 0, 12, and 72 hours; ∼10 500 cells per mouse). (E) BM time-course maps: force direct layout. (F) Number of BM neutrophil lineage (PN, preneutrophil; IN, immature neutrophil; and MN, mature neutrophils) and granulocyte stem and progenitor cells (MPP3 and GMPs). Results are mean ± SEM, n = 3 mice per time point. ∗P < .05, ∗∗P < .01, ∗∗∗P < .001, ∗∗∗∗P < 0. 0001. Statistical analysis was performed using 1-way ANOVA with Tukey multiple comparison test.
Figure 3.
Figure 3.
RvD1 and RvD4 regulate BM myeloid cell production during peritonitis. Mice inoculated with E coli (105 CFU, IP, a self-limited dose; see “Methods”) were administered with RvD1 (100 ng per mouse, IV), RvD4 (100 ng per mouse, IV), or vehicle (0.01% v/v ethanol in saline). Exudates and BM cells were collected at 0 hours, 12 hours (initiation phase), and 72 hours (resolution phase) of the acute inflammatory response. (A) Schematic of the experimental design and sample collection. (B) Cell number of neutrophils in the exudate. (C) CyTOF: BM UMAP labeled with 15 immune populations. (D) The number of BM neutrophils, GMPs, LSKs, and Ly6Clow monocyte cells. Results in panels B-D are mean ± SEM, n = 3 mice per time point. Time 0 hour vs 12 and 72 hours; #P < .05, ##P < .01. Rvs (RvD1 or RvD4) vs E coli + vehicle; ∗P < .05, ∗∗P < .01, ∗∗∗P < .001. Statistical analysis was carried out using 2-way ANOVA with Tukey multiple comparison test. (E) BM UMAPs of log fold-change (logFC) between time 0 vs time points (12 or 72 hours), or treatments (RvD1 or RvD4) calculated using edgeR with diffcyt. (F) BM UMAPs of logFC between E coli + RvD4 vs E coli + vehicle calculated using edgeR with diffcyt. (E-F) Only statistically significant populations are colored (P < .05) and adjusted using a Benjamini-Hochberg correction. (G) Light microscopy photographs of BM myeloid CFUs: M, monocytes (left); G, granulocyte (middle), and GM, macrophage/granulocyte (right), obtained with a 2× objective; representative images. (H) BM myeloid CFU quantification after dose-dependent treatment with vehicle only (0.01% ethanol v/v) or with either RvD1 or RvD4 (0.01-10 nM). CFU counts are per 2 × 104 BM cells. Vehicle vs 0.01, 0.1, 1, or 10 nM; ∗P < .05, ∗∗P < .01, ∗∗∗P < .001, ∗∗∗∗P < .0001. Statistical analysis was carried out using 2-way ANOVA with Bonferroni multiple comparisons test.
Figure 3.
Figure 3.
RvD1 and RvD4 regulate BM myeloid cell production during peritonitis. Mice inoculated with E coli (105 CFU, IP, a self-limited dose; see “Methods”) were administered with RvD1 (100 ng per mouse, IV), RvD4 (100 ng per mouse, IV), or vehicle (0.01% v/v ethanol in saline). Exudates and BM cells were collected at 0 hours, 12 hours (initiation phase), and 72 hours (resolution phase) of the acute inflammatory response. (A) Schematic of the experimental design and sample collection. (B) Cell number of neutrophils in the exudate. (C) CyTOF: BM UMAP labeled with 15 immune populations. (D) The number of BM neutrophils, GMPs, LSKs, and Ly6Clow monocyte cells. Results in panels B-D are mean ± SEM, n = 3 mice per time point. Time 0 hour vs 12 and 72 hours; #P < .05, ##P < .01. Rvs (RvD1 or RvD4) vs E coli + vehicle; ∗P < .05, ∗∗P < .01, ∗∗∗P < .001. Statistical analysis was carried out using 2-way ANOVA with Tukey multiple comparison test. (E) BM UMAPs of log fold-change (logFC) between time 0 vs time points (12 or 72 hours), or treatments (RvD1 or RvD4) calculated using edgeR with diffcyt. (F) BM UMAPs of logFC between E coli + RvD4 vs E coli + vehicle calculated using edgeR with diffcyt. (E-F) Only statistically significant populations are colored (P < .05) and adjusted using a Benjamini-Hochberg correction. (G) Light microscopy photographs of BM myeloid CFUs: M, monocytes (left); G, granulocyte (middle), and GM, macrophage/granulocyte (right), obtained with a 2× objective; representative images. (H) BM myeloid CFU quantification after dose-dependent treatment with vehicle only (0.01% ethanol v/v) or with either RvD1 or RvD4 (0.01-10 nM). CFU counts are per 2 × 104 BM cells. Vehicle vs 0.01, 0.1, 1, or 10 nM; ∗P < .05, ∗∗P < .01, ∗∗∗P < .001, ∗∗∗∗P < .0001. Statistical analysis was carried out using 2-way ANOVA with Bonferroni multiple comparisons test.
Figure 4.
Figure 4.
RvD4 stops neutrophil emergency deployment and accelerates the resolution of infection. Mice inoculated with E coli (105 CFU, IP) were also administered (IV) with RvD4 (100 ng per mouse) or vehicle alone (0.01% v/v ethanol in saline). Exudates, whole blood, and BM cells were collected at 0, 12, and 72 hours. (A) Schematic of the experimental design and sample collection. (B) CyTOF: UMAP of the infectious exudate, whole blood, and the BM, labeled with 17 immune populations. (C) Number of neutrophils in exudate, whole blood, and the BM. (D) Number of LSKs and GMPs in whole blood and the BM. (E) UMAP of neutrophil populations and progenitors in the BM, whole blood, and exudate. (F) Neutrophil lineage trajectory: diffusion map. LSKs, GMPs, PN (preneutrophils), IN (immature neutrophils), MN (mature neutrophils); and CN, circulating neutrophils. (G) RvD4 and E coli logFC change diffusion map calculated using edgeR with diffcyt. Only statistically significant populations are colored (P < .05) and adjusted using a Benjamini-Hochberg correction. Results in panels C-D are mean ± SEM; n = 3 samples biologically independent per time point. RvD4 vs E coli + vehicle; ∗P < .05, ∗∗P < .01, ∗∗∗P < .001, ∗∗∗∗P < .0001 using 1-way ANOVA with Tukey multiple comparison test. (H) Exudate: E coli bacterial titers (300 μL lavage) at 12 hours. Results are expressed as mean ± SEM; n = 8 or 9 samples per condition. RvD4 vs E coli + vehicle, ∗∗P < .01 using 2-tailed t test. (I-J) Exudate: in vivo phagocytosis. Intracellular E coli levels were determined in neutrophils (CD45+F4/80Ly6CLy6G+), monocytes (CD45+F4/80Ly6GLy6C+), and macrophages (CD45+Ly6GLy6CF4/80+). MFI, mean fluorescence intensity. (I) Representative histograms. (J) Quantification of MFI of intracellular E coli levels. Results are expressed as mean ± SEM; n = 4 samples; RvD4 vs E coli + vehicle, ∗P < .05 using 2-way ANOVA with Bonferroni multiple comparisons test. (K-L) Flow cytometry: exudate neutrophil apoptosis (CD45+Ly6G+annexinV+) at 12 hours. (K) Representative dot plots and (L) quantification of neutrophil apoptosis. Results are expressed as mean ± SEM; n = 4 or 5 samples. RvD4 vs E coli + vehicle, ∗∗∗∗P < .0001 using 2-way ANOVA with Bonferroni multiple comparisons test. (M) Flow cytometry: exudate in vivo macrophage efferocytosis (CD45+CD11b+F4/80+Ly6G+) at 12 hours. Results are expressed as mean ± SEM; n = 4 or 5 samples per condition. RvD4 vs E coli + vehicle, ∗P < .05 using 2-tailed t test.
Figure 4.
Figure 4.
RvD4 stops neutrophil emergency deployment and accelerates the resolution of infection. Mice inoculated with E coli (105 CFU, IP) were also administered (IV) with RvD4 (100 ng per mouse) or vehicle alone (0.01% v/v ethanol in saline). Exudates, whole blood, and BM cells were collected at 0, 12, and 72 hours. (A) Schematic of the experimental design and sample collection. (B) CyTOF: UMAP of the infectious exudate, whole blood, and the BM, labeled with 17 immune populations. (C) Number of neutrophils in exudate, whole blood, and the BM. (D) Number of LSKs and GMPs in whole blood and the BM. (E) UMAP of neutrophil populations and progenitors in the BM, whole blood, and exudate. (F) Neutrophil lineage trajectory: diffusion map. LSKs, GMPs, PN (preneutrophils), IN (immature neutrophils), MN (mature neutrophils); and CN, circulating neutrophils. (G) RvD4 and E coli logFC change diffusion map calculated using edgeR with diffcyt. Only statistically significant populations are colored (P < .05) and adjusted using a Benjamini-Hochberg correction. Results in panels C-D are mean ± SEM; n = 3 samples biologically independent per time point. RvD4 vs E coli + vehicle; ∗P < .05, ∗∗P < .01, ∗∗∗P < .001, ∗∗∗∗P < .0001 using 1-way ANOVA with Tukey multiple comparison test. (H) Exudate: E coli bacterial titers (300 μL lavage) at 12 hours. Results are expressed as mean ± SEM; n = 8 or 9 samples per condition. RvD4 vs E coli + vehicle, ∗∗P < .01 using 2-tailed t test. (I-J) Exudate: in vivo phagocytosis. Intracellular E coli levels were determined in neutrophils (CD45+F4/80Ly6CLy6G+), monocytes (CD45+F4/80Ly6GLy6C+), and macrophages (CD45+Ly6GLy6CF4/80+). MFI, mean fluorescence intensity. (I) Representative histograms. (J) Quantification of MFI of intracellular E coli levels. Results are expressed as mean ± SEM; n = 4 samples; RvD4 vs E coli + vehicle, ∗P < .05 using 2-way ANOVA with Bonferroni multiple comparisons test. (K-L) Flow cytometry: exudate neutrophil apoptosis (CD45+Ly6G+annexinV+) at 12 hours. (K) Representative dot plots and (L) quantification of neutrophil apoptosis. Results are expressed as mean ± SEM; n = 4 or 5 samples. RvD4 vs E coli + vehicle, ∗∗∗∗P < .0001 using 2-way ANOVA with Bonferroni multiple comparisons test. (M) Flow cytometry: exudate in vivo macrophage efferocytosis (CD45+CD11b+F4/80+Ly6G+) at 12 hours. Results are expressed as mean ± SEM; n = 4 or 5 samples per condition. RvD4 vs E coli + vehicle, ∗P < .05 using 2-tailed t test.
Figure 5.
Figure 5.
RvD4 regulates neutrophil infiltration in a dose-dependent manner. (A-C) Mice inoculated with E coli (105 CFU, IP) were also (IV) administered RvD4 (100 ng per mouse) or vehicle alone (0.01% v/v ethanol in saline). Exudates, whole blood, and BM cells were collected at 12 hours. Levels of G-CSF, CXCL1, and CXCL12 in the serum, BM, and exudate. Results are expressed as mean ± SEM; n = 3 to 5 samples per condition. RvD4 vs E coli + vehicle, ∗P < .05, ∗∗P < .01, ∗∗∗P < .001 using 2-tailed t test. (D) LTB4 whole-blood neutrophil mobilization. Naïve mice were IV administered LTB4 (red line), RvD4 (dark blue line), combination of RvD4 + LTB4 (purple), or vehicle only (0.01% ethanol v/v in saline). Neutrophils were enumerated by light microscopy and differential count. Results are expressed as mean ± SEM; n = 6 mice per condition. Time 0 minute vs 5, 10, 15, 20, 30, 40, and 60 minutes, respectively; ∗P < .05, ∗∗∗ P < .001, ∗∗∗∗P < .0001. RvD4 + LTB4 vs LTB4; ###P < .001, using 2-way ANOVA with Bonferroni multiple comparisons test. (E-G) Mice were inoculated with E coli (105 CFU, IP) and administered (IV) RvD4 at concentrations of 1, 10, or 100 ng per mouse, or vehicle only (0.01% v/v ethanol in saline). Exudates and whole blood were collected at 12 hours. (E) Cell number of neutrophils (CD45+F4/80Ly6CLy6G+) in peritoneal exudates; (F) levels of CXCL1 in exudate; (G) levels of G-CSF and CXCL12 in the serum. (E-G) Results are expressed as mean ± SEM; n = 7 (RvD4, 1 ng per mouse), n = 8 (RvD4, 10 ng per mouse), n = 4 (RvD4, 100 ng per mouse), or n = 9 (E coli + vehicle). RvD4 vs E coli + vehicle; ∗P < .05, ∗∗P < .01, ∗∗∗P < .001, ∗∗∗∗P < .0001 with 2-way ANOVA with Bonferroni multiple comparisons test.
Figure 6.
Figure 6.
RvD4 increases the CD169+ macrophage efferocytosis of neutrophils in the BM and regulates lineage differentiation. Mice were inoculated with E coli (105 CFU, IP) and received RvD4 (100 ng per mouse, IV) or vehicle only (0.01% v/v ethanol in saline). At 12 and 72 hours after inoculation, BM cells were collected. (A) Flow cytometry for efferocytosis of BM neutrophils by BM macrophages in vivo. Results are mean ± SEM; n = 3 mice per time point; ∗P < .05, vs E coli + vehicle. Statistical analysis was carried out using 1-way ANOVA with Tukey multiple comparison test. (B) Flow cytometry BM macrophage efferocytosis of aged neutrophils (see “Methods”). Dose response: RvD4-induced percent increase in BMDM efferocytosis of aged BM neutrophils relative to that in vehicle-treated cells (solid black line). The 50% effective concentration (EC50) was estimated using nonlinear regression (dashed green line) with log (RvD4) vs response (3 parameters). Results are expressed as mean ± SEM; n = 5 (aged BM neutrophils); ∗P < .05, ∗∗∗P < .001, ∗∗∗∗P < .0001 when compared with vehicle (as control) using 1-way ANOVA with Bonferroni multiple comparison test. (C) Confocal microscopy of BMDM efferocytosis of aged BM neutrophils. The scale bars represent 20 μm (see supplemental Videos 1 [RvD4] and 2 [vehicle] showing 3D reconstruction). The white arrows denote ingested neutrophils by a macrophage. Yellow arrow denotes (supplemental Video 1, RvD4) the #3 neutrophil ingested by a macrophage. Representative of n = 4 mice. (D) CyTOF: UMAP of BM leukocytes single-cell lineage trajectory. (E) CyTOF: BM violin scatter plot of LSKs single-cell trajectory analysis at 12 hours after E coli inoculation. (F) Densities pseudotime plot trajectories. The density plots reflect differences in BM cell densities between RvD4 + E coli vs E coli plus vehicle treatments, at 12 hours. (G) BM myeloid CFUs: M, monocytes; G, granulocyte; and GM, macrophage/granulocyte at 12 hours after E coli inoculation or in naïve control mice. Results are mean ± SEM; n = 5 (naïve) or n = 9 samples (E coli + RvD4, or E coli + vehicle) per time point. E coli + RvD4 vs E coli + vehicle or vs naïve; ∗P < .05, ∗∗P < .01, ∗∗∗P < .001, ∗∗∗∗P < .0001. Statistical analysis was carried out using 2-way ANOVA with Bonferroni multiple comparisons test.
Figure 7.
Figure 7.
RvD4 stimulates phosphorylation during human neutrophil differentiation. Human BM aspirates were incubated for 5 and 15 minutes at 37°C with RvD4 (10 nM) or vehicle (0.01% v/v ethanol). CyTOF was carried out using a panel of antibodies targeting intracellular signaling phosphoprotein. (A) BM UMAP granulocyte populations and progenitors. (B) Number of neutrophil populations and progenitors identified in the BM. (C) Heatmap of the mean fold changes in the abundance of the intracellular phosphoproteins in BM cell populations of RvD4-treated aspirates relative to those in aspirates treated with vehicle only (median intensity arcsinh ratio). CREB, cAMP-response element binding protein. (D) Changes in the abundance of the intracellular phosphoproteins in BM cell populations. Results in panel D are expressed as mean ± SEM of n = 4 individual BM donors; 0 vs 5 minutes (RvD4): ∗P < .05, ∗∗P < .01, ∗∗∗P < .001, ∗∗∗∗P < .0001, and 0 vs 15 minutes (RvD4): ###P < .001 by 1-way ANOVA with Bonferroni multiple comparison test. (E) Flow cytometry of human peripheral blood neutrophils (CD45+CD14CD15+) phagocytosis of Bac-light Green–labeled E coli. (Top) Representative dot plot identifying human neutrophils. (Bottom) Representative histograms of geometric MFIs of Bac-light Green–labeled E coli in neutrophils. (F) Dose response: RvD4-induced percent increase in neutrophil phagocytosis of Bac-light Green–labeled E coli relative to that in vehicle-treated samples. ∗P < .05, ∗∗∗∗P < .0001 when compared with vehicle control. Results are expressed as mean ± SEM, n = 4 healthy human donors. ∗P < .05, ∗∗∗∗P < .0001 when compared with vehicle control. EC50 was estimated using nonlinear regression (dashed line) with log (agonist) vs response (3 parameters). (G) Flow cytometry: calcium influx in human peripheral blood neutrophils incubated with 10 nM of either LTB4, RvD4, or RvD1. Results from n = 4 healthy human donors. (H-I) Flow cytometry: heat maps of phosphorylated signaling ERK1/2 (H) and STAT3 (I) at 0, 1, 5, and 15 minutes after incubation with RvD1 (10 nM) or RvD4 (10 nM) in Fpr2−/− (ALX receptor–deficient mice) and Fpr2flox/flox. Phosphorylation levels were calculated as the difference between the geometric mean signal intensity in RvD1- or RvD4-treated BM neutrophils (at 0, 1, 5, and 15 minutes) and the geometric mean signal intensity in vehicle-treated BM neutrophils at 0 minutes. Results are expressed as mean ± SEM, n = 3 mice from each group; 0 minute vs 1, 5, or 15 minutes, respectively; ∗P < .05, ∗∗P < .01.
Figure 7.
Figure 7.
RvD4 stimulates phosphorylation during human neutrophil differentiation. Human BM aspirates were incubated for 5 and 15 minutes at 37°C with RvD4 (10 nM) or vehicle (0.01% v/v ethanol). CyTOF was carried out using a panel of antibodies targeting intracellular signaling phosphoprotein. (A) BM UMAP granulocyte populations and progenitors. (B) Number of neutrophil populations and progenitors identified in the BM. (C) Heatmap of the mean fold changes in the abundance of the intracellular phosphoproteins in BM cell populations of RvD4-treated aspirates relative to those in aspirates treated with vehicle only (median intensity arcsinh ratio). CREB, cAMP-response element binding protein. (D) Changes in the abundance of the intracellular phosphoproteins in BM cell populations. Results in panel D are expressed as mean ± SEM of n = 4 individual BM donors; 0 vs 5 minutes (RvD4): ∗P < .05, ∗∗P < .01, ∗∗∗P < .001, ∗∗∗∗P < .0001, and 0 vs 15 minutes (RvD4): ###P < .001 by 1-way ANOVA with Bonferroni multiple comparison test. (E) Flow cytometry of human peripheral blood neutrophils (CD45+CD14CD15+) phagocytosis of Bac-light Green–labeled E coli. (Top) Representative dot plot identifying human neutrophils. (Bottom) Representative histograms of geometric MFIs of Bac-light Green–labeled E coli in neutrophils. (F) Dose response: RvD4-induced percent increase in neutrophil phagocytosis of Bac-light Green–labeled E coli relative to that in vehicle-treated samples. ∗P < .05, ∗∗∗∗P < .0001 when compared with vehicle control. Results are expressed as mean ± SEM, n = 4 healthy human donors. ∗P < .05, ∗∗∗∗P < .0001 when compared with vehicle control. EC50 was estimated using nonlinear regression (dashed line) with log (agonist) vs response (3 parameters). (G) Flow cytometry: calcium influx in human peripheral blood neutrophils incubated with 10 nM of either LTB4, RvD4, or RvD1. Results from n = 4 healthy human donors. (H-I) Flow cytometry: heat maps of phosphorylated signaling ERK1/2 (H) and STAT3 (I) at 0, 1, 5, and 15 minutes after incubation with RvD1 (10 nM) or RvD4 (10 nM) in Fpr2−/− (ALX receptor–deficient mice) and Fpr2flox/flox. Phosphorylation levels were calculated as the difference between the geometric mean signal intensity in RvD1- or RvD4-treated BM neutrophils (at 0, 1, 5, and 15 minutes) and the geometric mean signal intensity in vehicle-treated BM neutrophils at 0 minutes. Results are expressed as mean ± SEM, n = 3 mice from each group; 0 minute vs 1, 5, or 15 minutes, respectively; ∗P < .05, ∗∗P < .01.

Comment in

References

    1. Cassatella MA, editor. The Neutrophil: An Emerging Regulator of Inflammatory and Immune Response. Karger; 2003.
    1. Handin RI, Lux SE, Stossel TP. 2nd ed. Lippincott Williams & Wilkins; 2003. Blood: Principles and Practice of Hematology.
    1. Serhan CN. Pro-resolving lipid mediators are leads for resolution physiology. Nature. 2014;510(7503):92–101. - PMC - PubMed
    1. Mercier FE, Ragu C, Scadden DT. The bone marrow at the crossroads of blood and immunity. Nat Rev Immunol. 2011;12(1):49–60. - PMC - PubMed
    1. Julliard WA, Myo YPA, Perelas A, Jackson PD, Thatcher TH, Sime PJ. Specialized pro-resolving mediators as modulators of immune responses. Semin Immunol. 2022;59:101605. - PMC - PubMed

Publication types